

Key Insights
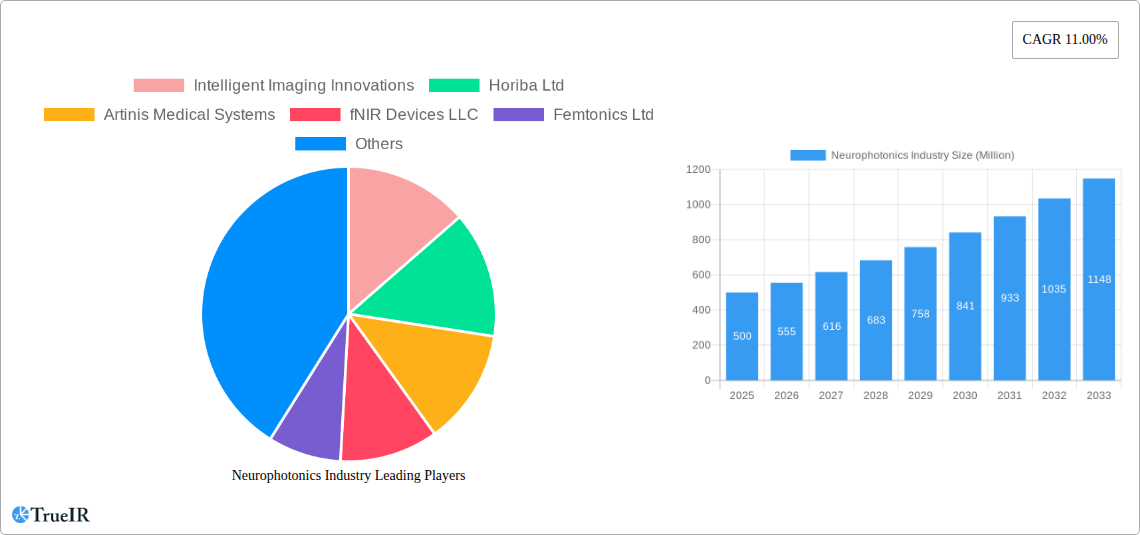
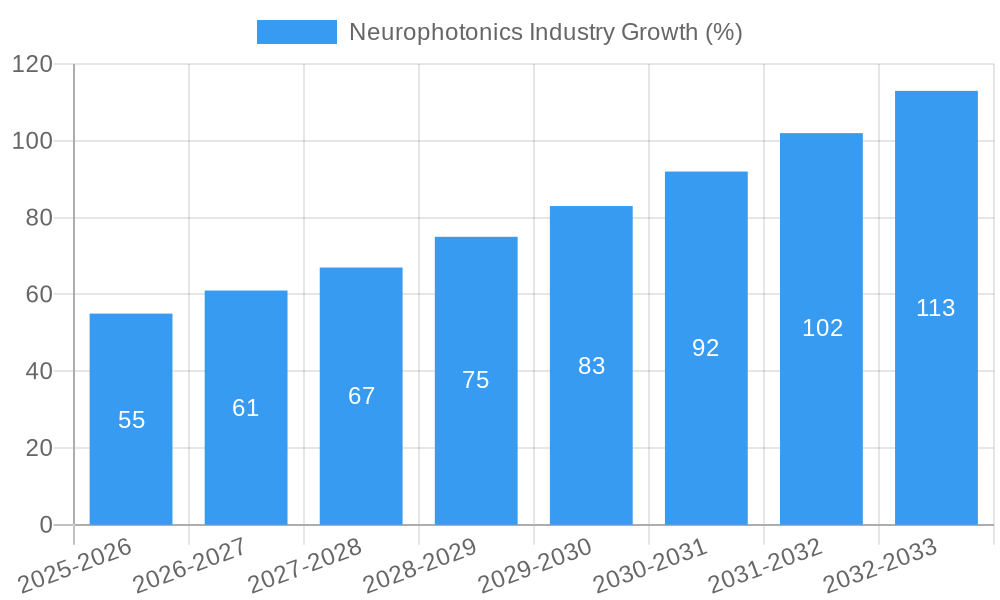
The neurophotonics market, encompassing technologies like microscopy, spectroscopy, and multimodal imaging for neurological research and clinical applications, is experiencing robust growth. The market size in 2025 is estimated at $500 million, projecting a Compound Annual Growth Rate (CAGR) of 11% from 2025 to 2033. This expansion is driven by several key factors. Advancements in imaging techniques offer increasingly detailed visualizations of brain structures and functions, leading to breakthroughs in neuroscience research. Furthermore, the rising prevalence of neurological disorders globally fuels demand for advanced diagnostic and therapeutic tools. The increasing adoption of minimally invasive procedures and the development of sophisticated data analysis techniques further contribute to market growth. While challenges remain, such as the high cost of equipment and the need for skilled professionals, the potential for improved neurological care and fundamental scientific discoveries is driving substantial investment in the field. The market is segmented into various system types (microscopy, spectroscopy, multimodal, and others) and applications (research, diagnostics, and therapeutics). North America and Europe currently hold significant market shares, but the Asia-Pacific region is projected to exhibit rapid growth due to increasing research funding and healthcare infrastructure development.
This dynamic market landscape is characterized by a strong presence of established players, including industry giants like Hitachi Ltd and Carl Zeiss AG, alongside innovative smaller companies specializing in specific neurophotonics technologies. Competition is expected to intensify as companies strive to develop more advanced and cost-effective solutions. The increasing integration of artificial intelligence (AI) and machine learning (ML) in image analysis is revolutionizing data interpretation, accelerating research and improving the accuracy of diagnoses. Future growth will hinge on further technological advancements, regulatory approvals for new therapies, and increased collaboration between researchers, clinicians, and technology developers. The development of portable and user-friendly neurophotonics devices will further expand market access and accessibility, potentially unlocking new therapeutic opportunities.
Neurophotonics Industry Market Report: 2019-2033
This comprehensive report provides an in-depth analysis of the Neurophotonics industry, offering invaluable insights for stakeholders, investors, and industry professionals. Covering the period from 2019 to 2033, with a focus on 2025, this report projects a dynamic and rapidly evolving market with significant growth potential. The report leverages extensive market research and data analysis to forecast market size, identify key trends, and analyze the competitive landscape. Explore the impact of technological advancements, regulatory changes, and market dynamics on the future trajectory of this exciting sector.
Neurophotonics Industry Market Structure & Competitive Landscape
The Neurophotonics industry exhibits a moderately consolidated market structure in 2025, with a Herfindahl-Hirschman Index (HHI) estimated at xx. Key players, including Horiba Ltd, Carl Zeiss AG, and Leica Microsystems, hold significant market share, driven by their established brand reputation, technological expertise, and extensive product portfolios. However, the market is witnessing increased competition from smaller, innovative companies such as Intelligent Imaging Innovations, fNIR Devices LLC, and Femtonics Ltd, specializing in niche applications and advanced technologies.
Market Concentration Analysis (2025):
- Top 5 companies account for xx% of the market share.
- Moderate concentration, allowing for both established players and new entrants.
- Concentration is expected to increase slightly by 2033 due to M&A activity.
Innovation Drivers:
- Advancements in optical imaging technologies, including multiphoton microscopy and optical coherence tomography (OCT).
- Development of novel contrast agents and fluorescent probes for improved sensitivity and specificity.
- Integration of artificial intelligence (AI) and machine learning (ML) for enhanced data analysis and image processing.
Regulatory Impacts:
- Stringent regulatory approvals for medical devices are a key factor influencing market growth.
- Varying regulatory landscapes across different regions pose challenges for market expansion.
Product Substitutes:
- Functional MRI (fMRI) and electroencephalography (EEG) remain major substitutes, but neurophotonics offers superior spatial and temporal resolution.
End-User Segmentation:
- Research institutions and hospitals are the primary end users, followed by pharmaceutical companies.
M&A Trends:
- The estimated value of M&A activities in the neurophotonics market between 2019 and 2024 was approximately $xx Million.
- Consolidation is expected to continue, driven by the need for expansion and technological integration.
Neurophotonics Industry Market Trends & Opportunities
The global neurophotonics market is experiencing robust growth, projected to reach $xx Million by 2033, exhibiting a Compound Annual Growth Rate (CAGR) of xx% during the forecast period (2025-2033). This growth is fueled by several key factors, including the increasing prevalence of neurological disorders, advancements in optical imaging technologies, and rising investments in research and development. Technological advancements, such as the development of miniaturized and portable neurophotonics systems, are significantly impacting market penetration, particularly in clinical settings. Consumer preference for less invasive diagnostic tools further drives demand. The competitive landscape is characterized by both established players and emerging companies, fostering innovation and driving down costs.
Market size projections:
- 2025: $xx Million
- 2033: $xx Million
- CAGR (2025-2033): xx%
Dominant Markets & Segments in Neurophotonics Industry
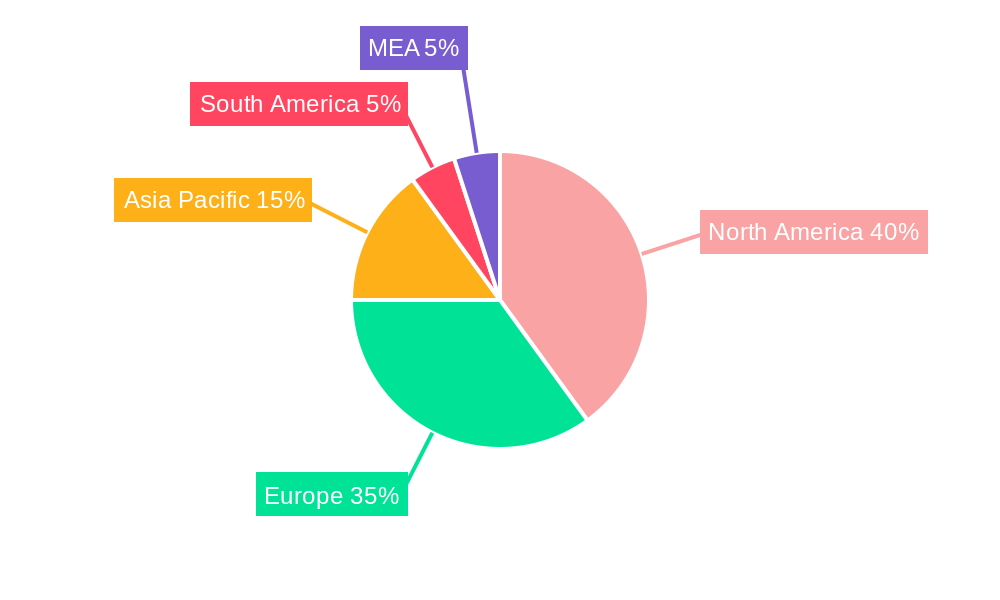
North America currently holds the largest market share in the neurophotonics industry in 2025, driven by strong research infrastructure, high healthcare expenditure, and a large patient pool. However, the Asia-Pacific region is projected to witness the fastest growth in the coming years.
Dominant Segments:
- System Type: Microscopy currently dominates the market, with a market share of xx%, followed by Spectroscopy at xx%. The Multimodal segment is expected to exhibit significant growth.
- Application: The Research segment represents the largest share, although Diagnostics and Therapeutics are expanding rapidly, fueled by the development of novel therapeutic modalities.
Key Growth Drivers:
- North America: Extensive research funding, advanced healthcare infrastructure, and established regulatory frameworks.
- Asia-Pacific: Rapidly growing healthcare sector, increasing awareness of neurological disorders, and rising investments in medical technology.
- Europe: Strong focus on innovation and collaboration within research institutions and healthcare systems.
Neurophotonics Industry Product Analysis
The neurophotonics industry is characterized by a diverse range of products, including sophisticated microscopy systems, spectroscopy instruments, and multimodal imaging devices. These tools offer superior spatial and temporal resolution compared to traditional neuroimaging techniques, enabling researchers and clinicians to obtain detailed information about brain structure and function. Ongoing technological advancements, such as the integration of AI and miniaturization, are enhancing the capabilities and usability of these systems, expanding their application in both research and clinical settings. Competition is based on factors such as image quality, ease of use, cost-effectiveness, and technological advancements.
Key Drivers, Barriers & Challenges in Neurophotonics Industry
Key Drivers:
- Increasing prevalence of neurological disorders globally.
- Advancements in optical imaging technologies, providing superior resolution and sensitivity.
- Growing investments in research and development, leading to the development of innovative neurophotonics products.
- Regulatory approvals for new applications in diagnostics and therapeutics are creating new market opportunities.
Key Challenges:
- High costs associated with the development and manufacturing of advanced neurophotonics systems.
- Complex regulatory procedures for medical device approvals, potentially delaying market entry.
- Limited reimbursement coverage for neurophotonics-based procedures in some healthcare systems, hindering market adoption.
- Potential competition from other neuroimaging modalities such as fMRI and EEG.
Growth Drivers in the Neurophotonics Industry Market
The neurophotonics market's growth is propelled by factors such as the rising prevalence of neurological disorders and the ongoing development of sophisticated optical imaging technologies that offer superior resolution and sensitivity. The increased investment in research and development fuels innovation, leading to more advanced products. Furthermore, regulatory approvals for new diagnostic and therapeutic applications are unlocking new market opportunities.
Challenges Impacting Neurophotonics Industry Growth
Significant challenges include the high cost of developing and manufacturing sophisticated systems, coupled with complex regulatory hurdles that slow down market entry. Limited reimbursement coverage in certain healthcare systems presents a significant barrier to adoption, along with the competition from existing neuroimaging modalities.
Key Players Shaping the Neurophotonics Industry Market
- Intelligent Imaging Innovations
- Horiba Ltd
- Artinis Medical Systems
- fNIR Devices LLC
- Femtonics Ltd
- Cairn Research
- Hitachi Ltd
- Carl Zeiss AG
- Leica Microsystems
- HemoPhotonics
Significant Neurophotonics Industry Milestones
- 2020: FDA approval of a novel neurophotonics-based diagnostic tool for Alzheimer's disease.
- 2021: Successful clinical trial demonstrating the efficacy of a neurophotonics-based therapeutic intervention for stroke.
- 2022: Launch of a new generation of miniaturized neurophotonics systems for improved portability and usability.
- 2023: Strategic partnership between a major neurophotonics company and a pharmaceutical firm to develop new therapeutic applications.
Future Outlook for Neurophotonics Industry Market
The future of the neurophotonics market appears bright, driven by continued technological advancements, a growing understanding of neurological disorders, and increased funding for research and development. Strategic partnerships between technology companies and healthcare providers are set to accelerate innovation and market penetration. Expansion into new therapeutic applications and the development of personalized treatment strategies based on neurophotonics technologies promise significant market potential.
Neurophotonics Industry Segmentation
-
1. System Type
- 1.1. Microscopy
- 1.2. Spectroscopy
- 1.3. Multimodal
- 1.4. Other System Type
-
2. Application
- 2.1. Research
- 2.2. Diagnostics
- 2.3. Therapeutics
Neurophotonics Industry Segmentation By Geography
- 1. North America
- 2. Europe
- 3. Asia Pacific
- 4. Rest of World
Neurophotonics Industry REPORT HIGHLIGHTS
| Aspects | Details |
|---|---|
| Study Period | 2019-2033 |
| Base Year | 2024 |
| Estimated Year | 2025 |
| Forecast Period | 2025-2033 |
| Historical Period | 2019-2024 |
| Growth Rate | CAGR of 11.00% from 2019-2033 |
| Segmentation |
|
Table of Contents
- 1. Introduction
- 1.1. Research Scope
- 1.2. Market Segmentation
- 1.3. Research Methodology
- 1.4. Definitions and Assumptions
- 2. Executive Summary
- 2.1. Introduction
- 3. Market Dynamics
- 3.1. Introduction
- 3.2. Market Drivers
- 3.2.1. ; Increasing Government Initiative for Research and Development; Technological Advancement in Pain Detection Technology
- 3.3. Market Restrains
- 3.3.1. ; Accessing the Human Brain in Live Individuals is Difficult
- 3.4. Market Trends
- 3.4.1. Increasing Research Activities Offers Potential Growth
- 4. Market Factor Analysis
- 4.1. Porters Five Forces
- 4.2. Supply/Value Chain
- 4.3. PESTEL analysis
- 4.4. Market Entropy
- 4.5. Patent/Trademark Analysis
- 5. Global Neurophotonics Industry Analysis, Insights and Forecast, 2019-2031
- 5.1. Market Analysis, Insights and Forecast - by System Type
- 5.1.1. Microscopy
- 5.1.2. Spectroscopy
- 5.1.3. Multimodal
- 5.1.4. Other System Type
- 5.2. Market Analysis, Insights and Forecast - by Application
- 5.2.1. Research
- 5.2.2. Diagnostics
- 5.2.3. Therapeutics
- 5.3. Market Analysis, Insights and Forecast - by Region
- 5.3.1. North America
- 5.3.2. Europe
- 5.3.3. Asia Pacific
- 5.3.4. Rest of World
- 5.1. Market Analysis, Insights and Forecast - by System Type
- 6. North America Neurophotonics Industry Analysis, Insights and Forecast, 2019-2031
- 6.1. Market Analysis, Insights and Forecast - by System Type
- 6.1.1. Microscopy
- 6.1.2. Spectroscopy
- 6.1.3. Multimodal
- 6.1.4. Other System Type
- 6.2. Market Analysis, Insights and Forecast - by Application
- 6.2.1. Research
- 6.2.2. Diagnostics
- 6.2.3. Therapeutics
- 6.1. Market Analysis, Insights and Forecast - by System Type
- 7. Europe Neurophotonics Industry Analysis, Insights and Forecast, 2019-2031
- 7.1. Market Analysis, Insights and Forecast - by System Type
- 7.1.1. Microscopy
- 7.1.2. Spectroscopy
- 7.1.3. Multimodal
- 7.1.4. Other System Type
- 7.2. Market Analysis, Insights and Forecast - by Application
- 7.2.1. Research
- 7.2.2. Diagnostics
- 7.2.3. Therapeutics
- 7.1. Market Analysis, Insights and Forecast - by System Type
- 8. Asia Pacific Neurophotonics Industry Analysis, Insights and Forecast, 2019-2031
- 8.1. Market Analysis, Insights and Forecast - by System Type
- 8.1.1. Microscopy
- 8.1.2. Spectroscopy
- 8.1.3. Multimodal
- 8.1.4. Other System Type
- 8.2. Market Analysis, Insights and Forecast - by Application
- 8.2.1. Research
- 8.2.2. Diagnostics
- 8.2.3. Therapeutics
- 8.1. Market Analysis, Insights and Forecast - by System Type
- 9. Rest of World Neurophotonics Industry Analysis, Insights and Forecast, 2019-2031
- 9.1. Market Analysis, Insights and Forecast - by System Type
- 9.1.1. Microscopy
- 9.1.2. Spectroscopy
- 9.1.3. Multimodal
- 9.1.4. Other System Type
- 9.2. Market Analysis, Insights and Forecast - by Application
- 9.2.1. Research
- 9.2.2. Diagnostics
- 9.2.3. Therapeutics
- 9.1. Market Analysis, Insights and Forecast - by System Type
- 10. North America Neurophotonics Industry Analysis, Insights and Forecast, 2019-2031
- 10.1. Market Analysis, Insights and Forecast - By Country/Sub-region
- 10.1.1. undefined
- 11. Europe Neurophotonics Industry Analysis, Insights and Forecast, 2019-2031
- 11.1. Market Analysis, Insights and Forecast - By Country/Sub-region
- 11.1.1. undefined
- 12. Asia Pacific Neurophotonics Industry Analysis, Insights and Forecast, 2019-2031
- 12.1. Market Analysis, Insights and Forecast - By Country/Sub-region
- 12.1.1. undefined
- 13. South America Neurophotonics Industry Analysis, Insights and Forecast, 2019-2031
- 13.1. Market Analysis, Insights and Forecast - By Country/Sub-region
- 13.1.1. undefined
- 14. North America Neurophotonics Industry Analysis, Insights and Forecast, 2019-2031
- 14.1. Market Analysis, Insights and Forecast - By Country/Sub-region
- 14.1.1. undefined
- 15. MEA Neurophotonics Industry Analysis, Insights and Forecast, 2019-2031
- 15.1. Market Analysis, Insights and Forecast - By Country/Sub-region
- 15.1.1. undefined
- 16. Competitive Analysis
- 16.1. Global Market Share Analysis 2024
- 16.2. Company Profiles
- 16.2.1 Intelligent Imaging Innovations
- 16.2.1.1. Overview
- 16.2.1.2. Products
- 16.2.1.3. SWOT Analysis
- 16.2.1.4. Recent Developments
- 16.2.1.5. Financials (Based on Availability)
- 16.2.2 Horiba Ltd
- 16.2.2.1. Overview
- 16.2.2.2. Products
- 16.2.2.3. SWOT Analysis
- 16.2.2.4. Recent Developments
- 16.2.2.5. Financials (Based on Availability)
- 16.2.3 Artinis Medical Systems
- 16.2.3.1. Overview
- 16.2.3.2. Products
- 16.2.3.3. SWOT Analysis
- 16.2.3.4. Recent Developments
- 16.2.3.5. Financials (Based on Availability)
- 16.2.4 fNIR Devices LLC
- 16.2.4.1. Overview
- 16.2.4.2. Products
- 16.2.4.3. SWOT Analysis
- 16.2.4.4. Recent Developments
- 16.2.4.5. Financials (Based on Availability)
- 16.2.5 Femtonics Ltd
- 16.2.5.1. Overview
- 16.2.5.2. Products
- 16.2.5.3. SWOT Analysis
- 16.2.5.4. Recent Developments
- 16.2.5.5. Financials (Based on Availability)
- 16.2.6 Cairn Research
- 16.2.6.1. Overview
- 16.2.6.2. Products
- 16.2.6.3. SWOT Analysis
- 16.2.6.4. Recent Developments
- 16.2.6.5. Financials (Based on Availability)
- 16.2.7 Hitachi Ltd
- 16.2.7.1. Overview
- 16.2.7.2. Products
- 16.2.7.3. SWOT Analysis
- 16.2.7.4. Recent Developments
- 16.2.7.5. Financials (Based on Availability)
- 16.2.8 Carl Zeiss AG
- 16.2.8.1. Overview
- 16.2.8.2. Products
- 16.2.8.3. SWOT Analysis
- 16.2.8.4. Recent Developments
- 16.2.8.5. Financials (Based on Availability)
- 16.2.9 Leica Microsystems
- 16.2.9.1. Overview
- 16.2.9.2. Products
- 16.2.9.3. SWOT Analysis
- 16.2.9.4. Recent Developments
- 16.2.9.5. Financials (Based on Availability)
- 16.2.10 HemoPhotonics
- 16.2.10.1. Overview
- 16.2.10.2. Products
- 16.2.10.3. SWOT Analysis
- 16.2.10.4. Recent Developments
- 16.2.10.5. Financials (Based on Availability)
- 16.2.1 Intelligent Imaging Innovations
List of Figures
- Figure 1: Global Neurophotonics Industry Revenue Breakdown (Million, %) by Region 2024 & 2032
- Figure 2: Global Neurophotonics Industry Volume Breakdown (K Unit, %) by Region 2024 & 2032
- Figure 3: North America Neurophotonics Industry Revenue (Million), by Country 2024 & 2032
- Figure 4: North America Neurophotonics Industry Volume (K Unit), by Country 2024 & 2032
- Figure 5: North America Neurophotonics Industry Revenue Share (%), by Country 2024 & 2032
- Figure 6: North America Neurophotonics Industry Volume Share (%), by Country 2024 & 2032
- Figure 7: Europe Neurophotonics Industry Revenue (Million), by Country 2024 & 2032
- Figure 8: Europe Neurophotonics Industry Volume (K Unit), by Country 2024 & 2032
- Figure 9: Europe Neurophotonics Industry Revenue Share (%), by Country 2024 & 2032
- Figure 10: Europe Neurophotonics Industry Volume Share (%), by Country 2024 & 2032
- Figure 11: Asia Pacific Neurophotonics Industry Revenue (Million), by Country 2024 & 2032
- Figure 12: Asia Pacific Neurophotonics Industry Volume (K Unit), by Country 2024 & 2032
- Figure 13: Asia Pacific Neurophotonics Industry Revenue Share (%), by Country 2024 & 2032
- Figure 14: Asia Pacific Neurophotonics Industry Volume Share (%), by Country 2024 & 2032
- Figure 15: South America Neurophotonics Industry Revenue (Million), by Country 2024 & 2032
- Figure 16: South America Neurophotonics Industry Volume (K Unit), by Country 2024 & 2032
- Figure 17: South America Neurophotonics Industry Revenue Share (%), by Country 2024 & 2032
- Figure 18: South America Neurophotonics Industry Volume Share (%), by Country 2024 & 2032
- Figure 19: North America Neurophotonics Industry Revenue (Million), by Country 2024 & 2032
- Figure 20: North America Neurophotonics Industry Volume (K Unit), by Country 2024 & 2032
- Figure 21: North America Neurophotonics Industry Revenue Share (%), by Country 2024 & 2032
- Figure 22: North America Neurophotonics Industry Volume Share (%), by Country 2024 & 2032
- Figure 23: MEA Neurophotonics Industry Revenue (Million), by Country 2024 & 2032
- Figure 24: MEA Neurophotonics Industry Volume (K Unit), by Country 2024 & 2032
- Figure 25: MEA Neurophotonics Industry Revenue Share (%), by Country 2024 & 2032
- Figure 26: MEA Neurophotonics Industry Volume Share (%), by Country 2024 & 2032
- Figure 27: North America Neurophotonics Industry Revenue (Million), by System Type 2024 & 2032
- Figure 28: North America Neurophotonics Industry Volume (K Unit), by System Type 2024 & 2032
- Figure 29: North America Neurophotonics Industry Revenue Share (%), by System Type 2024 & 2032
- Figure 30: North America Neurophotonics Industry Volume Share (%), by System Type 2024 & 2032
- Figure 31: North America Neurophotonics Industry Revenue (Million), by Application 2024 & 2032
- Figure 32: North America Neurophotonics Industry Volume (K Unit), by Application 2024 & 2032
- Figure 33: North America Neurophotonics Industry Revenue Share (%), by Application 2024 & 2032
- Figure 34: North America Neurophotonics Industry Volume Share (%), by Application 2024 & 2032
- Figure 35: North America Neurophotonics Industry Revenue (Million), by Country 2024 & 2032
- Figure 36: North America Neurophotonics Industry Volume (K Unit), by Country 2024 & 2032
- Figure 37: North America Neurophotonics Industry Revenue Share (%), by Country 2024 & 2032
- Figure 38: North America Neurophotonics Industry Volume Share (%), by Country 2024 & 2032
- Figure 39: Europe Neurophotonics Industry Revenue (Million), by System Type 2024 & 2032
- Figure 40: Europe Neurophotonics Industry Volume (K Unit), by System Type 2024 & 2032
- Figure 41: Europe Neurophotonics Industry Revenue Share (%), by System Type 2024 & 2032
- Figure 42: Europe Neurophotonics Industry Volume Share (%), by System Type 2024 & 2032
- Figure 43: Europe Neurophotonics Industry Revenue (Million), by Application 2024 & 2032
- Figure 44: Europe Neurophotonics Industry Volume (K Unit), by Application 2024 & 2032
- Figure 45: Europe Neurophotonics Industry Revenue Share (%), by Application 2024 & 2032
- Figure 46: Europe Neurophotonics Industry Volume Share (%), by Application 2024 & 2032
- Figure 47: Europe Neurophotonics Industry Revenue (Million), by Country 2024 & 2032
- Figure 48: Europe Neurophotonics Industry Volume (K Unit), by Country 2024 & 2032
- Figure 49: Europe Neurophotonics Industry Revenue Share (%), by Country 2024 & 2032
- Figure 50: Europe Neurophotonics Industry Volume Share (%), by Country 2024 & 2032
- Figure 51: Asia Pacific Neurophotonics Industry Revenue (Million), by System Type 2024 & 2032
- Figure 52: Asia Pacific Neurophotonics Industry Volume (K Unit), by System Type 2024 & 2032
- Figure 53: Asia Pacific Neurophotonics Industry Revenue Share (%), by System Type 2024 & 2032
- Figure 54: Asia Pacific Neurophotonics Industry Volume Share (%), by System Type 2024 & 2032
- Figure 55: Asia Pacific Neurophotonics Industry Revenue (Million), by Application 2024 & 2032
- Figure 56: Asia Pacific Neurophotonics Industry Volume (K Unit), by Application 2024 & 2032
- Figure 57: Asia Pacific Neurophotonics Industry Revenue Share (%), by Application 2024 & 2032
- Figure 58: Asia Pacific Neurophotonics Industry Volume Share (%), by Application 2024 & 2032
- Figure 59: Asia Pacific Neurophotonics Industry Revenue (Million), by Country 2024 & 2032
- Figure 60: Asia Pacific Neurophotonics Industry Volume (K Unit), by Country 2024 & 2032
- Figure 61: Asia Pacific Neurophotonics Industry Revenue Share (%), by Country 2024 & 2032
- Figure 62: Asia Pacific Neurophotonics Industry Volume Share (%), by Country 2024 & 2032
- Figure 63: Rest of World Neurophotonics Industry Revenue (Million), by System Type 2024 & 2032
- Figure 64: Rest of World Neurophotonics Industry Volume (K Unit), by System Type 2024 & 2032
- Figure 65: Rest of World Neurophotonics Industry Revenue Share (%), by System Type 2024 & 2032
- Figure 66: Rest of World Neurophotonics Industry Volume Share (%), by System Type 2024 & 2032
- Figure 67: Rest of World Neurophotonics Industry Revenue (Million), by Application 2024 & 2032
- Figure 68: Rest of World Neurophotonics Industry Volume (K Unit), by Application 2024 & 2032
- Figure 69: Rest of World Neurophotonics Industry Revenue Share (%), by Application 2024 & 2032
- Figure 70: Rest of World Neurophotonics Industry Volume Share (%), by Application 2024 & 2032
- Figure 71: Rest of World Neurophotonics Industry Revenue (Million), by Country 2024 & 2032
- Figure 72: Rest of World Neurophotonics Industry Volume (K Unit), by Country 2024 & 2032
- Figure 73: Rest of World Neurophotonics Industry Revenue Share (%), by Country 2024 & 2032
- Figure 74: Rest of World Neurophotonics Industry Volume Share (%), by Country 2024 & 2032
List of Tables
- Table 1: Global Neurophotonics Industry Revenue Million Forecast, by Region 2019 & 2032
- Table 2: Global Neurophotonics Industry Volume K Unit Forecast, by Region 2019 & 2032
- Table 3: Global Neurophotonics Industry Revenue Million Forecast, by System Type 2019 & 2032
- Table 4: Global Neurophotonics Industry Volume K Unit Forecast, by System Type 2019 & 2032
- Table 5: Global Neurophotonics Industry Revenue Million Forecast, by Application 2019 & 2032
- Table 6: Global Neurophotonics Industry Volume K Unit Forecast, by Application 2019 & 2032
- Table 7: Global Neurophotonics Industry Revenue Million Forecast, by Region 2019 & 2032
- Table 8: Global Neurophotonics Industry Volume K Unit Forecast, by Region 2019 & 2032
- Table 9: Global Neurophotonics Industry Revenue Million Forecast, by Country 2019 & 2032
- Table 10: Global Neurophotonics Industry Volume K Unit Forecast, by Country 2019 & 2032
- Table 11: Global Neurophotonics Industry Revenue Million Forecast, by Country 2019 & 2032
- Table 12: Global Neurophotonics Industry Volume K Unit Forecast, by Country 2019 & 2032
- Table 13: Global Neurophotonics Industry Revenue Million Forecast, by Country 2019 & 2032
- Table 14: Global Neurophotonics Industry Volume K Unit Forecast, by Country 2019 & 2032
- Table 15: Global Neurophotonics Industry Revenue Million Forecast, by Country 2019 & 2032
- Table 16: Global Neurophotonics Industry Volume K Unit Forecast, by Country 2019 & 2032
- Table 17: Global Neurophotonics Industry Revenue Million Forecast, by Country 2019 & 2032
- Table 18: Global Neurophotonics Industry Volume K Unit Forecast, by Country 2019 & 2032
- Table 19: Global Neurophotonics Industry Revenue Million Forecast, by Country 2019 & 2032
- Table 20: Global Neurophotonics Industry Volume K Unit Forecast, by Country 2019 & 2032
- Table 21: Global Neurophotonics Industry Revenue Million Forecast, by System Type 2019 & 2032
- Table 22: Global Neurophotonics Industry Volume K Unit Forecast, by System Type 2019 & 2032
- Table 23: Global Neurophotonics Industry Revenue Million Forecast, by Application 2019 & 2032
- Table 24: Global Neurophotonics Industry Volume K Unit Forecast, by Application 2019 & 2032
- Table 25: Global Neurophotonics Industry Revenue Million Forecast, by Country 2019 & 2032
- Table 26: Global Neurophotonics Industry Volume K Unit Forecast, by Country 2019 & 2032
- Table 27: Global Neurophotonics Industry Revenue Million Forecast, by System Type 2019 & 2032
- Table 28: Global Neurophotonics Industry Volume K Unit Forecast, by System Type 2019 & 2032
- Table 29: Global Neurophotonics Industry Revenue Million Forecast, by Application 2019 & 2032
- Table 30: Global Neurophotonics Industry Volume K Unit Forecast, by Application 2019 & 2032
- Table 31: Global Neurophotonics Industry Revenue Million Forecast, by Country 2019 & 2032
- Table 32: Global Neurophotonics Industry Volume K Unit Forecast, by Country 2019 & 2032
- Table 33: Global Neurophotonics Industry Revenue Million Forecast, by System Type 2019 & 2032
- Table 34: Global Neurophotonics Industry Volume K Unit Forecast, by System Type 2019 & 2032
- Table 35: Global Neurophotonics Industry Revenue Million Forecast, by Application 2019 & 2032
- Table 36: Global Neurophotonics Industry Volume K Unit Forecast, by Application 2019 & 2032
- Table 37: Global Neurophotonics Industry Revenue Million Forecast, by Country 2019 & 2032
- Table 38: Global Neurophotonics Industry Volume K Unit Forecast, by Country 2019 & 2032
- Table 39: Global Neurophotonics Industry Revenue Million Forecast, by System Type 2019 & 2032
- Table 40: Global Neurophotonics Industry Volume K Unit Forecast, by System Type 2019 & 2032
- Table 41: Global Neurophotonics Industry Revenue Million Forecast, by Application 2019 & 2032
- Table 42: Global Neurophotonics Industry Volume K Unit Forecast, by Application 2019 & 2032
- Table 43: Global Neurophotonics Industry Revenue Million Forecast, by Country 2019 & 2032
- Table 44: Global Neurophotonics Industry Volume K Unit Forecast, by Country 2019 & 2032
Frequently Asked Questions
1. What is the projected Compound Annual Growth Rate (CAGR) of the Neurophotonics Industry?
The projected CAGR is approximately 11.00%.
2. Which companies are prominent players in the Neurophotonics Industry?
Key companies in the market include Intelligent Imaging Innovations, Horiba Ltd, Artinis Medical Systems, fNIR Devices LLC, Femtonics Ltd, Cairn Research, Hitachi Ltd , Carl Zeiss AG, Leica Microsystems, HemoPhotonics.
3. What are the main segments of the Neurophotonics Industry?
The market segments include System Type, Application.
4. Can you provide details about the market size?
The market size is estimated to be USD XX Million as of 2022.
5. What are some drivers contributing to market growth?
; Increasing Government Initiative for Research and Development; Technological Advancement in Pain Detection Technology.
6. What are the notable trends driving market growth?
Increasing Research Activities Offers Potential Growth.
7. Are there any restraints impacting market growth?
; Accessing the Human Brain in Live Individuals is Difficult.
8. Can you provide examples of recent developments in the market?
N/A
9. What pricing options are available for accessing the report?
Pricing options include single-user, multi-user, and enterprise licenses priced at USD 4750, USD 5250, and USD 8750 respectively.
10. Is the market size provided in terms of value or volume?
The market size is provided in terms of value, measured in Million and volume, measured in K Unit.
11. Are there any specific market keywords associated with the report?
Yes, the market keyword associated with the report is "Neurophotonics Industry," which aids in identifying and referencing the specific market segment covered.
12. How do I determine which pricing option suits my needs best?
The pricing options vary based on user requirements and access needs. Individual users may opt for single-user licenses, while businesses requiring broader access may choose multi-user or enterprise licenses for cost-effective access to the report.
13. Are there any additional resources or data provided in the Neurophotonics Industry report?
While the report offers comprehensive insights, it's advisable to review the specific contents or supplementary materials provided to ascertain if additional resources or data are available.
14. How can I stay updated on further developments or reports in the Neurophotonics Industry?
To stay informed about further developments, trends, and reports in the Neurophotonics Industry, consider subscribing to industry newsletters, following relevant companies and organizations, or regularly checking reputable industry news sources and publications.
Methodology
Step 1 - Identification of Relevant Samples Size from Population Database


Step 2 - Approaches for Defining Global Market Size (Value, Volume* & Price*)

Note*: In applicable scenarios
Step 3 - Data Sources
Primary Research
- Web Analytics
- Survey Reports
- Research Institute
- Latest Research Reports
- Opinion Leaders
Secondary Research
- Annual Reports
- White Paper
- Latest Press Release
- Industry Association
- Paid Database
- Investor Presentations

Step 4 - Data Triangulation
Involves using different sources of information in order to increase the validity of a study
These sources are likely to be stakeholders in a program - participants, other researchers, program staff, other community members, and so on.
Then we put all data in single framework & apply various statistical tools to find out the dynamic on the market.
During the analysis stage, feedback from the stakeholder groups would be compared to determine areas of agreement as well as areas of divergence
