

Key Insights
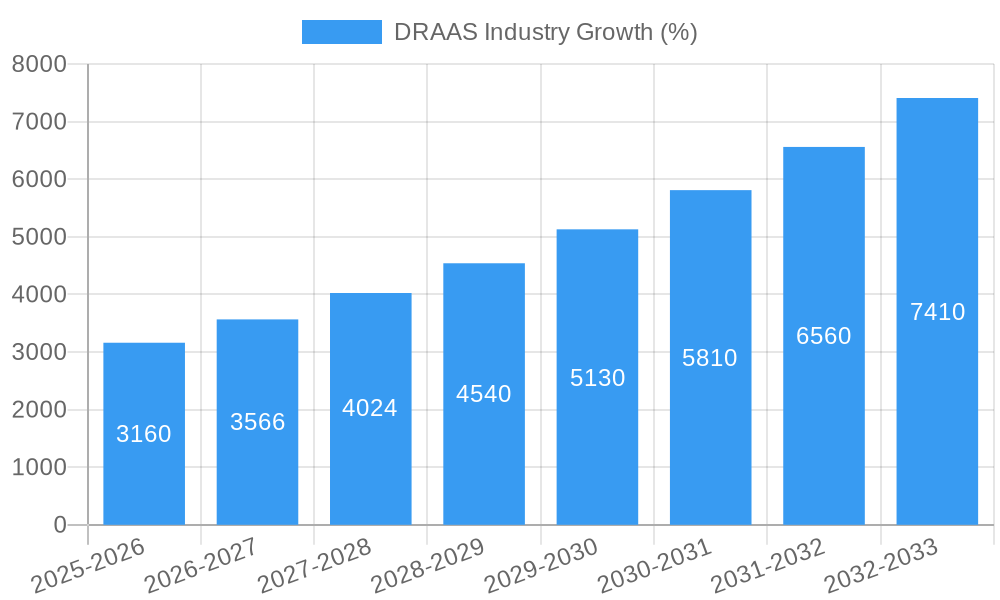
The Disaster Recovery as a Service (DRaaS) market is experiencing robust growth, driven by increasing reliance on cloud computing, stringent data protection regulations, and the rising frequency of cyberattacks and natural disasters. The market's Compound Annual Growth Rate (CAGR) of 12.32% from 2019-2024 indicates a significant upward trajectory, projected to continue into the forecast period (2025-2033). Key drivers include the need for business continuity and disaster recovery planning among organizations across various sectors, particularly in BFSI (Banking, Financial Services, and Insurance), IT, Government, and Healthcare. These sectors are heavily reliant on data integrity and operational uptime, making DRaaS a critical investment. The adoption of hybrid and multi-cloud strategies further fuels demand for DRaaS solutions that offer seamless integration and management across diverse cloud environments. Increased awareness of ransomware attacks and the inadequacy of traditional on-premise disaster recovery methods also contribute to the market's expansion. While some restraints may exist, such as initial implementation costs and the need for skilled personnel, the overall market outlook remains highly positive, fueled by technological advancements, evolving security threats, and increasing regulatory pressure.
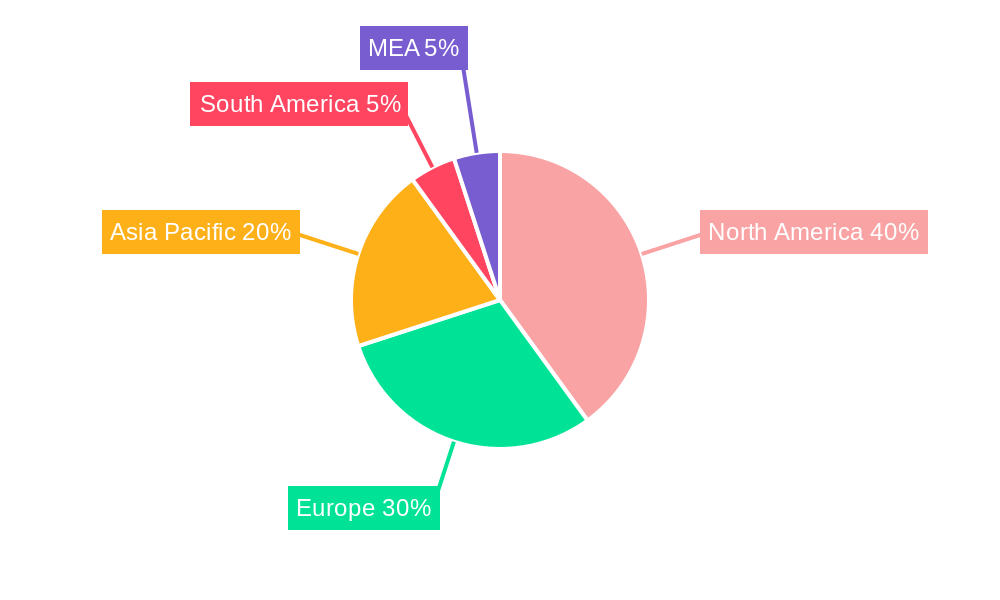
The regional distribution of the DRaaS market reflects the global digital transformation trends. North America, with its established technological infrastructure and high adoption rates of cloud services, currently holds a significant market share. However, Asia-Pacific is expected to experience the fastest growth due to rapid digitalization and increasing investments in IT infrastructure across countries like India, China, and Japan. Europe continues to be a substantial market, driven by strong regulatory frameworks and high adoption among large enterprises. The competitive landscape is characterized by a mix of established players like IBM and Microsoft, alongside specialized DRaaS providers and regional players. This competition fosters innovation, drives down prices, and offers a wider array of solutions catering to diverse organizational needs. The long-term outlook suggests continued market consolidation and increased focus on automated, AI-powered DRaaS solutions.
DRAAS Industry Market Report: 2019-2033
This comprehensive report provides a detailed analysis of the Disaster Recovery as a Service (DRaaS) industry, projecting a market value exceeding $XX Million by 2033. The study covers the period from 2019 to 2033, with a base year of 2025 and a forecast period from 2025 to 2033. It offers invaluable insights into market structure, competitive dynamics, key players, technological advancements, and future growth prospects. This report is essential for businesses, investors, and stakeholders seeking to understand and navigate the rapidly evolving DRaaS landscape.
DRAAS Industry Market Structure & Competitive Landscape
The DRaaS market exhibits a moderately concentrated structure, with a few major players commanding significant market share. The Herfindahl-Hirschman Index (HHI) is estimated at xx, indicating a relatively competitive yet consolidated market. Innovation is a key driver, with continuous advancements in cloud technologies, automation, and data security enhancing DRaaS capabilities. Regulatory compliance, particularly regarding data privacy and security (e.g., GDPR, CCPA), significantly impacts market dynamics. Product substitutes, such as on-premise disaster recovery solutions, face increasing competition due to DRaaS’s scalability and cost-effectiveness.
The market is segmented by end-user verticals, including BFSI (Banking, Financial Services, and Insurance), IT, Government, Healthcare, and other sectors. Mergers and acquisitions (M&A) are prevalent, with an estimated xx Million in M&A volume observed between 2019 and 2024. This activity reflects consolidation and the pursuit of enhanced capabilities and market reach.
- Market Concentration: Moderately concentrated, HHI estimated at xx.
- Innovation Drivers: Cloud technologies, automation, enhanced data security.
- Regulatory Impacts: GDPR, CCPA, and other data privacy regulations.
- Product Substitutes: On-premise disaster recovery solutions.
- End-user Segmentation: BFSI, IT, Government, Healthcare, Other.
- M&A Trends: Significant activity, estimated xx Million in volume (2019-2024).
DRAAS Industry Market Trends & Opportunities
The global DRaaS market is experiencing robust growth, projected to achieve a Compound Annual Growth Rate (CAGR) of xx% during the forecast period (2025-2033). This expansion is fueled by several factors. The increasing adoption of cloud computing increases reliance on robust DRaaS solutions. Furthermore, stringent data protection regulations necessitate reliable disaster recovery strategies. Businesses are increasingly prioritizing business continuity, and DRaaS provides a cost-effective and scalable solution. Technological advancements, such as AI-powered automation and improved data security measures, further enhance the appeal of DRaaS.
The market penetration rate is expected to rise significantly from xx% in 2025 to xx% by 2033, driven by heightened awareness of the risks associated with data loss and business disruption. Competitive dynamics are characterized by innovation, strategic partnerships, and M&A activity, resulting in a dynamic and evolving landscape.
Dominant Markets & Segments in DRAAS Industry
The North American market currently holds the dominant position in the DRaaS industry, driven by factors like robust IT infrastructure, early adoption of cloud technologies, and a high concentration of large enterprises. However, the Asia-Pacific region is expected to witness rapid growth in the coming years due to increasing digitalization and rising government investments in cybersecurity infrastructure.
Key Growth Drivers (North America):
- Advanced IT infrastructure
- High cloud adoption rates
- Stringent data security regulations
- Presence of major DRaaS providers
Key Growth Drivers (Asia-Pacific):
- Rapid digital transformation
- Government initiatives to enhance cybersecurity
- Increasing awareness of DRaaS benefits
While all end-user segments are contributing to growth, the BFSI sector stands out due to the critical need for high availability and data protection. The IT sector also shows significant potential, driven by the increasing adoption of cloud-based services. Government and healthcare sectors demonstrate robust growth as well due to increasing regulatory compliance requirements and sensitivity to data breaches.
DRAAS Industry Product Analysis
DRaaS solutions are evolving rapidly, incorporating advanced technologies like AI-powered automation, orchestration, and enhanced security features. These advancements lead to improved recovery times, reduced operational costs, and increased efficiency. Products offer varying levels of service, from basic backup and recovery to comprehensive, fully managed solutions catering to diverse customer needs and technological landscapes. The competitive landscape emphasizes the provision of tailored solutions that integrate seamlessly with existing IT infrastructure and address specific business requirements.
Key Drivers, Barriers & Challenges in DRAAS Industry
Key Drivers:
- Increasing adoption of cloud computing and hybrid cloud environments.
- Rising concerns regarding data security and compliance.
- Growing demand for business continuity and resilience.
- Advancements in automation and AI-powered solutions.
Challenges and Restraints:
- Complex Regulatory Landscape: Compliance with varying data privacy regulations across different jurisdictions poses a significant challenge.
- Supply Chain Disruptions: Potential delays in procuring necessary hardware and software can affect service delivery.
- Competitive Pressures: The market's competitiveness necessitates continuous innovation and efficient cost management. This results in price pressure and reduced margins in some segments. The estimated impact on revenue is xx Million annually.
Growth Drivers in the DRAAS Industry Market
The DRaaS market is propelled by increasing cloud adoption, stringent data protection regulations, growing business continuity concerns, and advancements in automation technologies like AI and machine learning. The rising frequency and severity of cyberattacks also contribute to the market's expansion. Furthermore, government initiatives promoting digital transformation and cybersecurity are key drivers of growth.
Challenges Impacting DRAAS Industry Growth
Key challenges include navigating a complex regulatory landscape, mitigating supply chain vulnerabilities, and managing intense competition. These factors can hinder market expansion and impact revenue streams. Regulatory complexities increase compliance costs, while supply chain issues create uncertainties in service delivery.
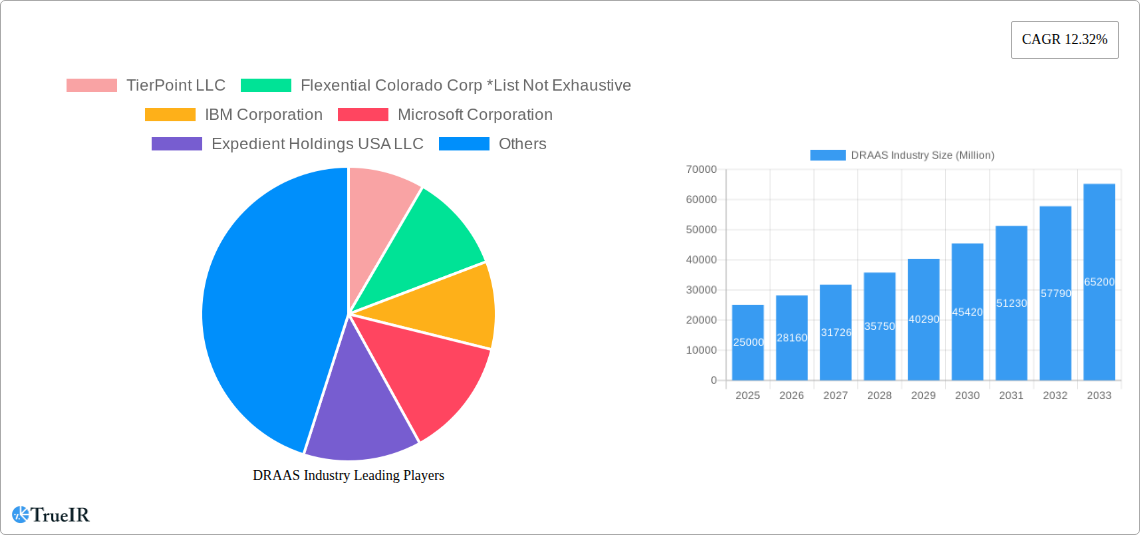
Key Players Shaping the DRAAS Industry Market
- TierPoint LLC
- Flexential Colorado Corp
- IBM Corporation
- Microsoft Corporation
- Expedient Holdings USA LLC
- Cloudhpt
- Recovery Point Systems Inc
- Phoenixnap LLC
- C and W Business Ltd
- Intervision Systems LLC
- Evolve IP LLC
- iLand Internet Solutions Corporation
- Sungard Availability Services LP
Significant DRAAS Industry Milestones
- February 2022: Global Data Vault's acquisition by Dataprise broadened the integrated data protection and cybersecurity solutions available.
- February 2022: Otava's VMware-validated cloud-based Disaster Recovery solution enhanced its DRaaS offerings.
- November 2022: CyberFortress launched 24/7 live support for its managed DRaaS and backup solutions.
Future Outlook for DRAAS Industry Market
The DRaaS market is poised for continued growth, driven by ongoing digital transformation, increasing cybersecurity threats, and the evolving regulatory landscape. Strategic partnerships, technological advancements, and expanding into new geographical markets present significant opportunities for growth. The market's potential is substantial, with significant opportunities for both established players and new entrants.
DRAAS Industry Segmentation
-
1. End-user Vertical
- 1.1. BFSI
- 1.2. IT
- 1.3. Government
- 1.4. Healthcare
- 1.5. Other End-user Verticals
DRAAS Industry Segmentation By Geography
- 1. North America
- 2. Europe
- 3. Asia Pacific
- 4. Rest of the World
DRAAS Industry REPORT HIGHLIGHTS
| Aspects | Details |
|---|---|
| Study Period | 2019-2033 |
| Base Year | 2024 |
| Estimated Year | 2025 |
| Forecast Period | 2025-2033 |
| Historical Period | 2019-2024 |
| Growth Rate | CAGR of 12.32% from 2019-2033 |
| Segmentation |
|
Table of Contents
- 1. Introduction
- 1.1. Research Scope
- 1.2. Market Segmentation
- 1.3. Research Methodology
- 1.4. Definitions and Assumptions
- 2. Executive Summary
- 2.1. Introduction
- 3. Market Dynamics
- 3.1. Introduction
- 3.2. Market Drivers
- 3.2.1. Increasing Data Breach and Ransomware Attacks Creating a Need For Robust Data Protection Solutions; Reducing Operational Cost of DRaaS Solutions Compared to Traditional Solutions
- 3.3. Market Restrains
- 3.3.1. Complexity of Deployment and Setting Terms
- 3.4. Market Trends
- 3.4.1. The BFSI Sector is Driving the Market
- 4. Market Factor Analysis
- 4.1. Porters Five Forces
- 4.2. Supply/Value Chain
- 4.3. PESTEL analysis
- 4.4. Market Entropy
- 4.5. Patent/Trademark Analysis
- 5. Global DRAAS Industry Analysis, Insights and Forecast, 2019-2031
- 5.1. Market Analysis, Insights and Forecast - by End-user Vertical
- 5.1.1. BFSI
- 5.1.2. IT
- 5.1.3. Government
- 5.1.4. Healthcare
- 5.1.5. Other End-user Verticals
- 5.2. Market Analysis, Insights and Forecast - by Region
- 5.2.1. North America
- 5.2.2. Europe
- 5.2.3. Asia Pacific
- 5.2.4. Rest of the World
- 5.1. Market Analysis, Insights and Forecast - by End-user Vertical
- 6. North America DRAAS Industry Analysis, Insights and Forecast, 2019-2031
- 6.1. Market Analysis, Insights and Forecast - by End-user Vertical
- 6.1.1. BFSI
- 6.1.2. IT
- 6.1.3. Government
- 6.1.4. Healthcare
- 6.1.5. Other End-user Verticals
- 6.1. Market Analysis, Insights and Forecast - by End-user Vertical
- 7. Europe DRAAS Industry Analysis, Insights and Forecast, 2019-2031
- 7.1. Market Analysis, Insights and Forecast - by End-user Vertical
- 7.1.1. BFSI
- 7.1.2. IT
- 7.1.3. Government
- 7.1.4. Healthcare
- 7.1.5. Other End-user Verticals
- 7.1. Market Analysis, Insights and Forecast - by End-user Vertical
- 8. Asia Pacific DRAAS Industry Analysis, Insights and Forecast, 2019-2031
- 8.1. Market Analysis, Insights and Forecast - by End-user Vertical
- 8.1.1. BFSI
- 8.1.2. IT
- 8.1.3. Government
- 8.1.4. Healthcare
- 8.1.5. Other End-user Verticals
- 8.1. Market Analysis, Insights and Forecast - by End-user Vertical
- 9. Rest of the World DRAAS Industry Analysis, Insights and Forecast, 2019-2031
- 9.1. Market Analysis, Insights and Forecast - by End-user Vertical
- 9.1.1. BFSI
- 9.1.2. IT
- 9.1.3. Government
- 9.1.4. Healthcare
- 9.1.5. Other End-user Verticals
- 9.1. Market Analysis, Insights and Forecast - by End-user Vertical
- 10. North America DRAAS Industry Analysis, Insights and Forecast, 2019-2031
- 10.1. Market Analysis, Insights and Forecast - By Country/Sub-region
- 10.1.1 United States
- 10.1.2 Canada
- 10.1.3 Mexico
- 11. Europe DRAAS Industry Analysis, Insights and Forecast, 2019-2031
- 11.1. Market Analysis, Insights and Forecast - By Country/Sub-region
- 11.1.1 Germany
- 11.1.2 United Kingdom
- 11.1.3 France
- 11.1.4 Spain
- 11.1.5 Italy
- 11.1.6 Spain
- 11.1.7 Belgium
- 11.1.8 Netherland
- 11.1.9 Nordics
- 11.1.10 Rest of Europe
- 12. Asia Pacific DRAAS Industry Analysis, Insights and Forecast, 2019-2031
- 12.1. Market Analysis, Insights and Forecast - By Country/Sub-region
- 12.1.1 China
- 12.1.2 Japan
- 12.1.3 India
- 12.1.4 South Korea
- 12.1.5 Southeast Asia
- 12.1.6 Australia
- 12.1.7 Indonesia
- 12.1.8 Phillipes
- 12.1.9 Singapore
- 12.1.10 Thailandc
- 12.1.11 Rest of Asia Pacific
- 13. South America DRAAS Industry Analysis, Insights and Forecast, 2019-2031
- 13.1. Market Analysis, Insights and Forecast - By Country/Sub-region
- 13.1.1 Brazil
- 13.1.2 Argentina
- 13.1.3 Peru
- 13.1.4 Chile
- 13.1.5 Colombia
- 13.1.6 Ecuador
- 13.1.7 Venezuela
- 13.1.8 Rest of South America
- 14. North America DRAAS Industry Analysis, Insights and Forecast, 2019-2031
- 14.1. Market Analysis, Insights and Forecast - By Country/Sub-region
- 14.1.1 United States
- 14.1.2 Canada
- 14.1.3 Mexico
- 15. MEA DRAAS Industry Analysis, Insights and Forecast, 2019-2031
- 15.1. Market Analysis, Insights and Forecast - By Country/Sub-region
- 15.1.1 United Arab Emirates
- 15.1.2 Saudi Arabia
- 15.1.3 South Africa
- 15.1.4 Rest of Middle East and Africa
- 16. Competitive Analysis
- 16.1. Global Market Share Analysis 2024
- 16.2. Company Profiles
- 16.2.1 TierPoint LLC
- 16.2.1.1. Overview
- 16.2.1.2. Products
- 16.2.1.3. SWOT Analysis
- 16.2.1.4. Recent Developments
- 16.2.1.5. Financials (Based on Availability)
- 16.2.2 Flexential Colorado Corp *List Not Exhaustive
- 16.2.2.1. Overview
- 16.2.2.2. Products
- 16.2.2.3. SWOT Analysis
- 16.2.2.4. Recent Developments
- 16.2.2.5. Financials (Based on Availability)
- 16.2.3 IBM Corporation
- 16.2.3.1. Overview
- 16.2.3.2. Products
- 16.2.3.3. SWOT Analysis
- 16.2.3.4. Recent Developments
- 16.2.3.5. Financials (Based on Availability)
- 16.2.4 Microsoft Corporation
- 16.2.4.1. Overview
- 16.2.4.2. Products
- 16.2.4.3. SWOT Analysis
- 16.2.4.4. Recent Developments
- 16.2.4.5. Financials (Based on Availability)
- 16.2.5 Expedient Holdings USA LLC
- 16.2.5.1. Overview
- 16.2.5.2. Products
- 16.2.5.3. SWOT Analysis
- 16.2.5.4. Recent Developments
- 16.2.5.5. Financials (Based on Availability)
- 16.2.6 Cloudhpt
- 16.2.6.1. Overview
- 16.2.6.2. Products
- 16.2.6.3. SWOT Analysis
- 16.2.6.4. Recent Developments
- 16.2.6.5. Financials (Based on Availability)
- 16.2.7 Recovery Point Systems Inc
- 16.2.7.1. Overview
- 16.2.7.2. Products
- 16.2.7.3. SWOT Analysis
- 16.2.7.4. Recent Developments
- 16.2.7.5. Financials (Based on Availability)
- 16.2.8 Phoenixnap LLC
- 16.2.8.1. Overview
- 16.2.8.2. Products
- 16.2.8.3. SWOT Analysis
- 16.2.8.4. Recent Developments
- 16.2.8.5. Financials (Based on Availability)
- 16.2.9 C and W Business Ltd
- 16.2.9.1. Overview
- 16.2.9.2. Products
- 16.2.9.3. SWOT Analysis
- 16.2.9.4. Recent Developments
- 16.2.9.5. Financials (Based on Availability)
- 16.2.10 Intervision Systems LLC
- 16.2.10.1. Overview
- 16.2.10.2. Products
- 16.2.10.3. SWOT Analysis
- 16.2.10.4. Recent Developments
- 16.2.10.5. Financials (Based on Availability)
- 16.2.11 Evolve IP LLC
- 16.2.11.1. Overview
- 16.2.11.2. Products
- 16.2.11.3. SWOT Analysis
- 16.2.11.4. Recent Developments
- 16.2.11.5. Financials (Based on Availability)
- 16.2.12 iLand Internet Solutions Corporation
- 16.2.12.1. Overview
- 16.2.12.2. Products
- 16.2.12.3. SWOT Analysis
- 16.2.12.4. Recent Developments
- 16.2.12.5. Financials (Based on Availability)
- 16.2.13 Sungard Availability Services LP
- 16.2.13.1. Overview
- 16.2.13.2. Products
- 16.2.13.3. SWOT Analysis
- 16.2.13.4. Recent Developments
- 16.2.13.5. Financials (Based on Availability)
- 16.2.1 TierPoint LLC
List of Figures
- Figure 1: Global DRAAS Industry Revenue Breakdown (Million, %) by Region 2024 & 2032
- Figure 2: North America DRAAS Industry Revenue (Million), by Country 2024 & 2032
- Figure 3: North America DRAAS Industry Revenue Share (%), by Country 2024 & 2032
- Figure 4: Europe DRAAS Industry Revenue (Million), by Country 2024 & 2032
- Figure 5: Europe DRAAS Industry Revenue Share (%), by Country 2024 & 2032
- Figure 6: Asia Pacific DRAAS Industry Revenue (Million), by Country 2024 & 2032
- Figure 7: Asia Pacific DRAAS Industry Revenue Share (%), by Country 2024 & 2032
- Figure 8: South America DRAAS Industry Revenue (Million), by Country 2024 & 2032
- Figure 9: South America DRAAS Industry Revenue Share (%), by Country 2024 & 2032
- Figure 10: North America DRAAS Industry Revenue (Million), by Country 2024 & 2032
- Figure 11: North America DRAAS Industry Revenue Share (%), by Country 2024 & 2032
- Figure 12: MEA DRAAS Industry Revenue (Million), by Country 2024 & 2032
- Figure 13: MEA DRAAS Industry Revenue Share (%), by Country 2024 & 2032
- Figure 14: North America DRAAS Industry Revenue (Million), by End-user Vertical 2024 & 2032
- Figure 15: North America DRAAS Industry Revenue Share (%), by End-user Vertical 2024 & 2032
- Figure 16: North America DRAAS Industry Revenue (Million), by Country 2024 & 2032
- Figure 17: North America DRAAS Industry Revenue Share (%), by Country 2024 & 2032
- Figure 18: Europe DRAAS Industry Revenue (Million), by End-user Vertical 2024 & 2032
- Figure 19: Europe DRAAS Industry Revenue Share (%), by End-user Vertical 2024 & 2032
- Figure 20: Europe DRAAS Industry Revenue (Million), by Country 2024 & 2032
- Figure 21: Europe DRAAS Industry Revenue Share (%), by Country 2024 & 2032
- Figure 22: Asia Pacific DRAAS Industry Revenue (Million), by End-user Vertical 2024 & 2032
- Figure 23: Asia Pacific DRAAS Industry Revenue Share (%), by End-user Vertical 2024 & 2032
- Figure 24: Asia Pacific DRAAS Industry Revenue (Million), by Country 2024 & 2032
- Figure 25: Asia Pacific DRAAS Industry Revenue Share (%), by Country 2024 & 2032
- Figure 26: Rest of the World DRAAS Industry Revenue (Million), by End-user Vertical 2024 & 2032
- Figure 27: Rest of the World DRAAS Industry Revenue Share (%), by End-user Vertical 2024 & 2032
- Figure 28: Rest of the World DRAAS Industry Revenue (Million), by Country 2024 & 2032
- Figure 29: Rest of the World DRAAS Industry Revenue Share (%), by Country 2024 & 2032
List of Tables
- Table 1: Global DRAAS Industry Revenue Million Forecast, by Region 2019 & 2032
- Table 2: Global DRAAS Industry Revenue Million Forecast, by End-user Vertical 2019 & 2032
- Table 3: Global DRAAS Industry Revenue Million Forecast, by Region 2019 & 2032
- Table 4: Global DRAAS Industry Revenue Million Forecast, by Country 2019 & 2032
- Table 5: United States DRAAS Industry Revenue (Million) Forecast, by Application 2019 & 2032
- Table 6: Canada DRAAS Industry Revenue (Million) Forecast, by Application 2019 & 2032
- Table 7: Mexico DRAAS Industry Revenue (Million) Forecast, by Application 2019 & 2032
- Table 8: Global DRAAS Industry Revenue Million Forecast, by Country 2019 & 2032
- Table 9: Germany DRAAS Industry Revenue (Million) Forecast, by Application 2019 & 2032
- Table 10: United Kingdom DRAAS Industry Revenue (Million) Forecast, by Application 2019 & 2032
- Table 11: France DRAAS Industry Revenue (Million) Forecast, by Application 2019 & 2032
- Table 12: Spain DRAAS Industry Revenue (Million) Forecast, by Application 2019 & 2032
- Table 13: Italy DRAAS Industry Revenue (Million) Forecast, by Application 2019 & 2032
- Table 14: Spain DRAAS Industry Revenue (Million) Forecast, by Application 2019 & 2032
- Table 15: Belgium DRAAS Industry Revenue (Million) Forecast, by Application 2019 & 2032
- Table 16: Netherland DRAAS Industry Revenue (Million) Forecast, by Application 2019 & 2032
- Table 17: Nordics DRAAS Industry Revenue (Million) Forecast, by Application 2019 & 2032
- Table 18: Rest of Europe DRAAS Industry Revenue (Million) Forecast, by Application 2019 & 2032
- Table 19: Global DRAAS Industry Revenue Million Forecast, by Country 2019 & 2032
- Table 20: China DRAAS Industry Revenue (Million) Forecast, by Application 2019 & 2032
- Table 21: Japan DRAAS Industry Revenue (Million) Forecast, by Application 2019 & 2032
- Table 22: India DRAAS Industry Revenue (Million) Forecast, by Application 2019 & 2032
- Table 23: South Korea DRAAS Industry Revenue (Million) Forecast, by Application 2019 & 2032
- Table 24: Southeast Asia DRAAS Industry Revenue (Million) Forecast, by Application 2019 & 2032
- Table 25: Australia DRAAS Industry Revenue (Million) Forecast, by Application 2019 & 2032
- Table 26: Indonesia DRAAS Industry Revenue (Million) Forecast, by Application 2019 & 2032
- Table 27: Phillipes DRAAS Industry Revenue (Million) Forecast, by Application 2019 & 2032
- Table 28: Singapore DRAAS Industry Revenue (Million) Forecast, by Application 2019 & 2032
- Table 29: Thailandc DRAAS Industry Revenue (Million) Forecast, by Application 2019 & 2032
- Table 30: Rest of Asia Pacific DRAAS Industry Revenue (Million) Forecast, by Application 2019 & 2032
- Table 31: Global DRAAS Industry Revenue Million Forecast, by Country 2019 & 2032
- Table 32: Brazil DRAAS Industry Revenue (Million) Forecast, by Application 2019 & 2032
- Table 33: Argentina DRAAS Industry Revenue (Million) Forecast, by Application 2019 & 2032
- Table 34: Peru DRAAS Industry Revenue (Million) Forecast, by Application 2019 & 2032
- Table 35: Chile DRAAS Industry Revenue (Million) Forecast, by Application 2019 & 2032
- Table 36: Colombia DRAAS Industry Revenue (Million) Forecast, by Application 2019 & 2032
- Table 37: Ecuador DRAAS Industry Revenue (Million) Forecast, by Application 2019 & 2032
- Table 38: Venezuela DRAAS Industry Revenue (Million) Forecast, by Application 2019 & 2032
- Table 39: Rest of South America DRAAS Industry Revenue (Million) Forecast, by Application 2019 & 2032
- Table 40: Global DRAAS Industry Revenue Million Forecast, by Country 2019 & 2032
- Table 41: United States DRAAS Industry Revenue (Million) Forecast, by Application 2019 & 2032
- Table 42: Canada DRAAS Industry Revenue (Million) Forecast, by Application 2019 & 2032
- Table 43: Mexico DRAAS Industry Revenue (Million) Forecast, by Application 2019 & 2032
- Table 44: Global DRAAS Industry Revenue Million Forecast, by Country 2019 & 2032
- Table 45: United Arab Emirates DRAAS Industry Revenue (Million) Forecast, by Application 2019 & 2032
- Table 46: Saudi Arabia DRAAS Industry Revenue (Million) Forecast, by Application 2019 & 2032
- Table 47: South Africa DRAAS Industry Revenue (Million) Forecast, by Application 2019 & 2032
- Table 48: Rest of Middle East and Africa DRAAS Industry Revenue (Million) Forecast, by Application 2019 & 2032
- Table 49: Global DRAAS Industry Revenue Million Forecast, by End-user Vertical 2019 & 2032
- Table 50: Global DRAAS Industry Revenue Million Forecast, by Country 2019 & 2032
- Table 51: Global DRAAS Industry Revenue Million Forecast, by End-user Vertical 2019 & 2032
- Table 52: Global DRAAS Industry Revenue Million Forecast, by Country 2019 & 2032
- Table 53: Global DRAAS Industry Revenue Million Forecast, by End-user Vertical 2019 & 2032
- Table 54: Global DRAAS Industry Revenue Million Forecast, by Country 2019 & 2032
- Table 55: Global DRAAS Industry Revenue Million Forecast, by End-user Vertical 2019 & 2032
- Table 56: Global DRAAS Industry Revenue Million Forecast, by Country 2019 & 2032
Frequently Asked Questions
1. What is the projected Compound Annual Growth Rate (CAGR) of the DRAAS Industry?
The projected CAGR is approximately 12.32%.
2. Which companies are prominent players in the DRAAS Industry?
Key companies in the market include TierPoint LLC, Flexential Colorado Corp *List Not Exhaustive, IBM Corporation, Microsoft Corporation, Expedient Holdings USA LLC, Cloudhpt, Recovery Point Systems Inc, Phoenixnap LLC, C and W Business Ltd, Intervision Systems LLC, Evolve IP LLC, iLand Internet Solutions Corporation, Sungard Availability Services LP.
3. What are the main segments of the DRAAS Industry?
The market segments include End-user Vertical.
4. Can you provide details about the market size?
The market size is estimated to be USD XX Million as of 2022.
5. What are some drivers contributing to market growth?
Increasing Data Breach and Ransomware Attacks Creating a Need For Robust Data Protection Solutions; Reducing Operational Cost of DRaaS Solutions Compared to Traditional Solutions.
6. What are the notable trends driving market growth?
The BFSI Sector is Driving the Market.
7. Are there any restraints impacting market growth?
Complexity of Deployment and Setting Terms.
8. Can you provide examples of recent developments in the market?
November 2022: CyberFortress, a managed data backup built to prevent business disruption through a rapid recovery provider, announced the launch of the company's 247 live support for all backup and recovery products and services. The company provides a complete suite of solutions and services, including Managed DRaaS powered by Veeam.
9. What pricing options are available for accessing the report?
Pricing options include single-user, multi-user, and enterprise licenses priced at USD 4750, USD 5250, and USD 8750 respectively.
10. Is the market size provided in terms of value or volume?
The market size is provided in terms of value, measured in Million.
11. Are there any specific market keywords associated with the report?
Yes, the market keyword associated with the report is "DRAAS Industry," which aids in identifying and referencing the specific market segment covered.
12. How do I determine which pricing option suits my needs best?
The pricing options vary based on user requirements and access needs. Individual users may opt for single-user licenses, while businesses requiring broader access may choose multi-user or enterprise licenses for cost-effective access to the report.
13. Are there any additional resources or data provided in the DRAAS Industry report?
While the report offers comprehensive insights, it's advisable to review the specific contents or supplementary materials provided to ascertain if additional resources or data are available.
14. How can I stay updated on further developments or reports in the DRAAS Industry?
To stay informed about further developments, trends, and reports in the DRAAS Industry, consider subscribing to industry newsletters, following relevant companies and organizations, or regularly checking reputable industry news sources and publications.
Methodology
Step 1 - Identification of Relevant Samples Size from Population Database


Step 2 - Approaches for Defining Global Market Size (Value, Volume* & Price*)

Note*: In applicable scenarios
Step 3 - Data Sources
Primary Research
- Web Analytics
- Survey Reports
- Research Institute
- Latest Research Reports
- Opinion Leaders
Secondary Research
- Annual Reports
- White Paper
- Latest Press Release
- Industry Association
- Paid Database
- Investor Presentations

Step 4 - Data Triangulation
Involves using different sources of information in order to increase the validity of a study
These sources are likely to be stakeholders in a program - participants, other researchers, program staff, other community members, and so on.
Then we put all data in single framework & apply various statistical tools to find out the dynamic on the market.
During the analysis stage, feedback from the stakeholder groups would be compared to determine areas of agreement as well as areas of divergence
