

Key Insights
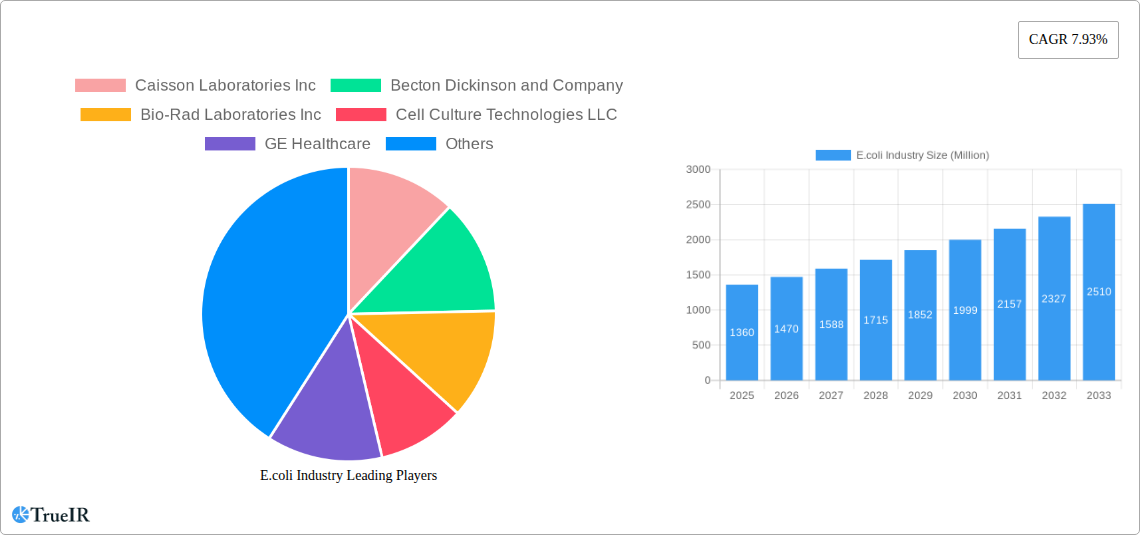
The E.coli testing market, valued at $1.36 billion in 2025, is projected to experience robust growth, driven by increasing incidences of E.coli infections globally, stringent regulatory frameworks mandating robust food safety and water quality testing, and the rising adoption of advanced testing technologies. The market's Compound Annual Growth Rate (CAGR) of 7.93% from 2025 to 2033 signifies a significant expansion opportunity. Key drivers include the escalating demand for rapid and accurate E.coli detection methods in clinical settings, environmental monitoring, and the food and beverage industry. Technological advancements, such as the development of more sensitive and rapid diagnostic tools like enzyme immunoassays, are fueling market growth. However, the high cost associated with advanced testing technologies and the need for skilled personnel to operate sophisticated equipment could pose challenges. Furthermore, variations in regulatory requirements across different regions might impact market penetration. Segmentation reveals a strong demand for both clinical and environmental testing, with clinical testing likely holding a larger market share due to the higher prevalence of E.coli related illnesses. Major players like Becton Dickinson, Bio-Rad Laboratories, and Merck & Co. are heavily invested in R&D and strategic partnerships to enhance their market positions, further stimulating innovation and competition within the sector. The geographically diverse market sees North America currently dominating due to advanced healthcare infrastructure and high awareness. However, Asia-Pacific is expected to witness significant growth over the forecast period driven by increasing population, industrialization, and improved healthcare infrastructure.
The market's growth trajectory is largely dependent on the effectiveness of public health initiatives aimed at preventing E.coli outbreaks, investments in research and development of newer and more efficient testing methods, and the expanding adoption of these advanced technologies across diverse geographical regions. The rise of outsourcing of testing services to specialized laboratories is also contributing to the growth of the overall market. The competition among established players and the emergence of new entrants focused on innovative technologies will continue to shape the E.coli testing market landscape. Long-term success for companies will hinge on their capacity to adapt to evolving regulatory landscapes, invest in research and development, and effectively meet the diverse testing needs of different market segments. Furthermore, effective marketing and strategic partnerships will play a vital role in expanding market reach and capturing significant market share in this rapidly growing sector.
E.coli Industry Market Report: 2019-2033
This comprehensive report provides a detailed analysis of the E.coli industry, encompassing market size, growth projections, competitive landscape, and future trends. With a study period spanning 2019-2033, a base year of 2025, and a forecast period of 2025-2033, this report offers invaluable insights for businesses, investors, and researchers seeking to understand this dynamic market. The global E.coli industry is projected to reach xx Million by 2033, exhibiting a substantial CAGR of xx% during the forecast period.
E.coli Industry Market Structure & Competitive Landscape
The E.coli industry exhibits a moderately concentrated market structure, with several major players holding significant market share. The Herfindahl-Hirschman Index (HHI) is estimated at xx, indicating a moderately competitive landscape. Innovation is a key driver, with companies continuously developing new testing methods and diagnostic tools. Regulatory frameworks, particularly concerning food safety and environmental regulations, significantly impact industry operations. Product substitutes are limited, as accurate and rapid detection of E.coli is crucial across various sectors. The end-user segment is diverse, including clinical laboratories, environmental agencies, research institutions, and food processing companies. M&A activity has been moderate in recent years, with an estimated xx Million in deal value between 2019 and 2024.
- Market Concentration: Moderately concentrated, HHI estimated at xx.
- Innovation Drivers: Development of rapid and sensitive detection methods, automation of testing processes.
- Regulatory Impacts: Stringent regulations related to food safety and water quality.
- Product Substitutes: Limited substitutes due to the specificity of E.coli detection requirements.
- End-User Segmentation: Clinical testing, environmental testing, research, food processing.
- M&A Trends: Moderate activity with an estimated xx Million in deal value (2019-2024).
E.coli Industry Market Trends & Opportunities
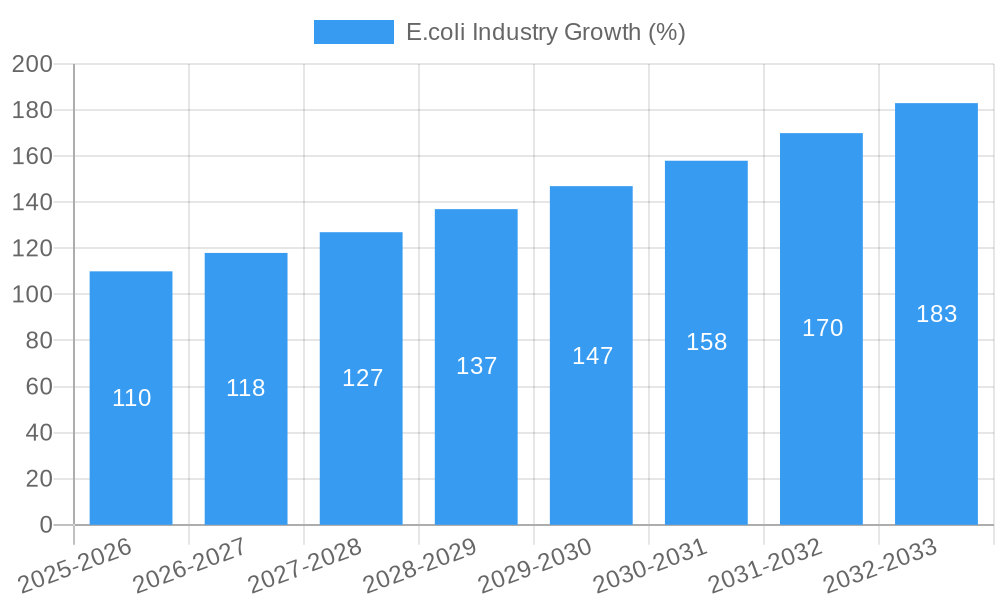
The E.coli industry is experiencing significant growth driven by rising concerns over foodborne illnesses, increasing demand for accurate and rapid diagnostic tools, and stringent government regulations. Technological advancements, including the development of rapid diagnostic tests and advanced molecular techniques, are driving market expansion. The market size is projected to reach xx Million in 2025, expanding to xx Million by 2033. The increasing prevalence of E.coli outbreaks and the consequent need for improved surveillance and control measures is a major opportunity for market growth. Consumer preferences are shifting towards more convenient and rapid testing methods. Competitive dynamics are shaped by technological innovation, pricing strategies, and the development of new diagnostic platforms.
Dominant Markets & Segments in E.coli Industry
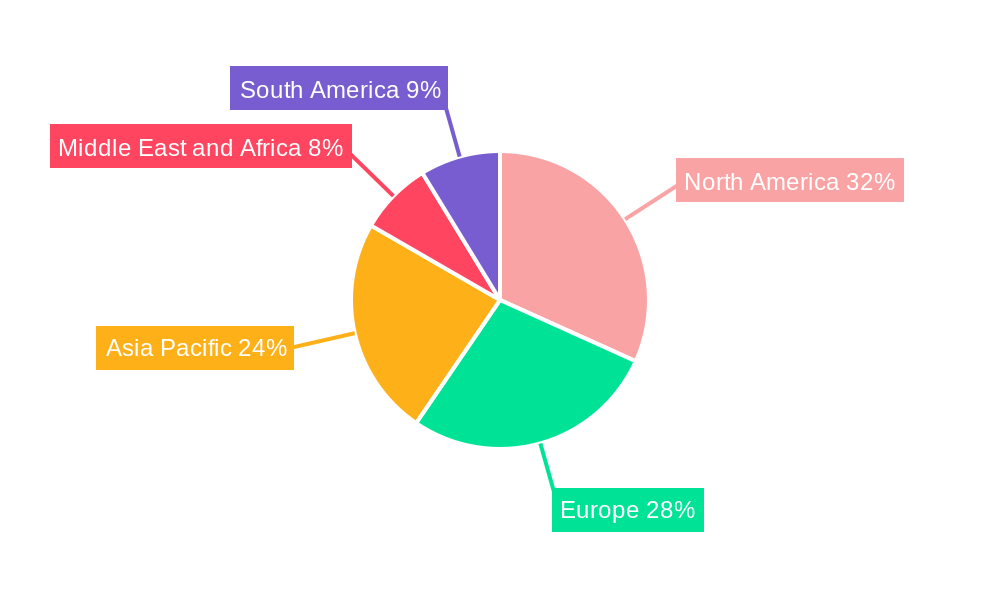
The clinical testing segment holds the largest market share, driven by the rising incidence of E.coli infections and the need for accurate diagnosis. North America and Europe represent the dominant regions, fueled by advanced healthcare infrastructure and robust regulatory frameworks. The environmental testing segment is experiencing strong growth due to increasing environmental concerns and stricter regulations on water quality.
- Clinical Testing Segment Growth Drivers: Rising incidence of E.coli infections, improved healthcare infrastructure, increased diagnostic testing.
- Environmental Testing Segment Growth Drivers: Stringent water quality regulations, increasing awareness of environmental pollution, improved detection technologies.
- Dominant Regions: North America and Europe.
E.coli Industry Product Analysis
Technological advancements have led to the development of highly sensitive and rapid E.coli detection methods, such as ELISA, PCR, and next-generation sequencing. These technologies offer improved accuracy and speed, enhancing diagnostic capabilities and enabling timely intervention. The market fit for these advanced technologies is strong, driven by the increasing demand for rapid and reliable E.coli detection in various applications, including clinical diagnostics, environmental monitoring, and food safety.
Key Drivers, Barriers & Challenges in E.coli Industry
Key Drivers: Increasing prevalence of E.coli infections, stringent regulations, advancements in diagnostic technologies, rising consumer awareness.
Challenges: High cost of advanced diagnostic technologies, complex regulatory landscape, potential supply chain disruptions, intense competition among manufacturers. The impact of these challenges is estimated to reduce market growth by approximately xx% in the forecast period.
Growth Drivers in the E.coli Industry Market
Growth in the E.coli industry is fueled by technological advancements in diagnostic techniques, rising healthcare expenditure globally, and increasing awareness of food safety and hygiene. Stringent regulatory frameworks also drive demand for reliable E.coli detection systems.
Challenges Impacting E.coli Industry Growth
Challenges include the high cost of advanced testing technologies, stringent regulatory approvals, and the complexities of global supply chains. Competitive pressures from numerous players further constrain market growth.
Key Players Shaping the E.coli Industry Market
- Caisson Laboratories Inc
- Becton Dickinson and Company
- Bio-Rad Laboratories Inc
- Cell Culture Technologies LLC
- GE Healthcare
- Lonza Group Ltd
- HiMedia Laboratories Pvt Ltd
- Merck & Co Inc
- Corning Incorporated
- Fujifilm Holdings Corporation
Significant E.coli Industry Milestones
- June 2022: Researchers from IIT Kanpur developed a highly sensitive E.coli water testing kit.
- June 2022: Researchers at Michigan State University conducted an experiment on E.coli evolution. These advancements highlight the ongoing innovation within the industry and their impact on detection capabilities and understanding of E.coli.
Future Outlook for E.coli Industry Market
The E.coli industry is poised for continued growth, driven by technological innovation, increasing regulatory scrutiny, and growing awareness of foodborne illnesses. Strategic opportunities lie in developing cost-effective, rapid, and user-friendly diagnostic tools, particularly for point-of-care applications. The market holds substantial potential for expansion, especially in emerging economies with improving healthcare infrastructure.
E.coli Industry Segmentation
-
1. Test
-
1.1. Clinical Testing
- 1.1.1. Polymerase Chain Reaction
- 1.1.2. Enzyme Immunoassays
-
1.2. Environmental Testing
- 1.2.1. Membrane Filtration
- 1.2.2. Multiple Tube Fermentation
- 1.2.3. Enzyme Substrate Method
-
1.1. Clinical Testing
E.coli Industry Segmentation By Geography
-
1. North America
- 1.1. United States
- 1.2. Canada
- 1.3. Mexico
-
2. Europe
- 2.1. Germany
- 2.2. United Kingdom
- 2.3. France
- 2.4. Italy
- 2.5. Spain
- 2.6. Rest of Europe
-
3. Asia Pacific
- 3.1. China
- 3.2. Japan
- 3.3. India
- 3.4. Australia
- 3.5. South Korea
- 3.6. Rest of Asia Pacific
-
4. Middle East and Africa
- 4.1. GCC
- 4.2. South Africa
- 4.3. Rest of Middle East and Africa
-
5. South America
- 5.1. Brazil
- 5.2. Argentina
- 5.3. Rest of South America
E.coli Industry REPORT HIGHLIGHTS
| Aspects | Details |
|---|---|
| Study Period | 2019-2033 |
| Base Year | 2024 |
| Estimated Year | 2025 |
| Forecast Period | 2025-2033 |
| Historical Period | 2019-2024 |
| Growth Rate | CAGR of 7.93% from 2019-2033 |
| Segmentation |
|
Table of Contents
- 1. Introduction
- 1.1. Research Scope
- 1.2. Market Segmentation
- 1.3. Research Methodology
- 1.4. Definitions and Assumptions
- 2. Executive Summary
- 2.1. Introduction
- 3. Market Dynamics
- 3.1. Introduction
- 3.2. Market Drivers
- 3.2.1. Increasing Prevalence of Diarrhoea; New Technological Advancements
- 3.3. Market Restrains
- 3.3.1. High Cost of E. coli Treatment
- 3.4. Market Trends
- 3.4.1. Polymerase Chain Reaction Segment is Expected to be Major Segment in the Escherichia coli Testing Market
- 4. Market Factor Analysis
- 4.1. Porters Five Forces
- 4.2. Supply/Value Chain
- 4.3. PESTEL analysis
- 4.4. Market Entropy
- 4.5. Patent/Trademark Analysis
- 5. Global E.coli Industry Analysis, Insights and Forecast, 2019-2031
- 5.1. Market Analysis, Insights and Forecast - by Test
- 5.1.1. Clinical Testing
- 5.1.1.1. Polymerase Chain Reaction
- 5.1.1.2. Enzyme Immunoassays
- 5.1.2. Environmental Testing
- 5.1.2.1. Membrane Filtration
- 5.1.2.2. Multiple Tube Fermentation
- 5.1.2.3. Enzyme Substrate Method
- 5.1.1. Clinical Testing
- 5.2. Market Analysis, Insights and Forecast - by Region
- 5.2.1. North America
- 5.2.2. Europe
- 5.2.3. Asia Pacific
- 5.2.4. Middle East and Africa
- 5.2.5. South America
- 5.1. Market Analysis, Insights and Forecast - by Test
- 6. North America E.coli Industry Analysis, Insights and Forecast, 2019-2031
- 6.1. Market Analysis, Insights and Forecast - by Test
- 6.1.1. Clinical Testing
- 6.1.1.1. Polymerase Chain Reaction
- 6.1.1.2. Enzyme Immunoassays
- 6.1.2. Environmental Testing
- 6.1.2.1. Membrane Filtration
- 6.1.2.2. Multiple Tube Fermentation
- 6.1.2.3. Enzyme Substrate Method
- 6.1.1. Clinical Testing
- 6.1. Market Analysis, Insights and Forecast - by Test
- 7. Europe E.coli Industry Analysis, Insights and Forecast, 2019-2031
- 7.1. Market Analysis, Insights and Forecast - by Test
- 7.1.1. Clinical Testing
- 7.1.1.1. Polymerase Chain Reaction
- 7.1.1.2. Enzyme Immunoassays
- 7.1.2. Environmental Testing
- 7.1.2.1. Membrane Filtration
- 7.1.2.2. Multiple Tube Fermentation
- 7.1.2.3. Enzyme Substrate Method
- 7.1.1. Clinical Testing
- 7.1. Market Analysis, Insights and Forecast - by Test
- 8. Asia Pacific E.coli Industry Analysis, Insights and Forecast, 2019-2031
- 8.1. Market Analysis, Insights and Forecast - by Test
- 8.1.1. Clinical Testing
- 8.1.1.1. Polymerase Chain Reaction
- 8.1.1.2. Enzyme Immunoassays
- 8.1.2. Environmental Testing
- 8.1.2.1. Membrane Filtration
- 8.1.2.2. Multiple Tube Fermentation
- 8.1.2.3. Enzyme Substrate Method
- 8.1.1. Clinical Testing
- 8.1. Market Analysis, Insights and Forecast - by Test
- 9. Middle East and Africa E.coli Industry Analysis, Insights and Forecast, 2019-2031
- 9.1. Market Analysis, Insights and Forecast - by Test
- 9.1.1. Clinical Testing
- 9.1.1.1. Polymerase Chain Reaction
- 9.1.1.2. Enzyme Immunoassays
- 9.1.2. Environmental Testing
- 9.1.2.1. Membrane Filtration
- 9.1.2.2. Multiple Tube Fermentation
- 9.1.2.3. Enzyme Substrate Method
- 9.1.1. Clinical Testing
- 9.1. Market Analysis, Insights and Forecast - by Test
- 10. South America E.coli Industry Analysis, Insights and Forecast, 2019-2031
- 10.1. Market Analysis, Insights and Forecast - by Test
- 10.1.1. Clinical Testing
- 10.1.1.1. Polymerase Chain Reaction
- 10.1.1.2. Enzyme Immunoassays
- 10.1.2. Environmental Testing
- 10.1.2.1. Membrane Filtration
- 10.1.2.2. Multiple Tube Fermentation
- 10.1.2.3. Enzyme Substrate Method
- 10.1.1. Clinical Testing
- 10.1. Market Analysis, Insights and Forecast - by Test
- 11. North America E.coli Industry Analysis, Insights and Forecast, 2019-2031
- 11.1. Market Analysis, Insights and Forecast - By Country/Sub-region
- 11.1.1 United States
- 11.1.2 Canada
- 11.1.3 Mexico
- 12. Europe E.coli Industry Analysis, Insights and Forecast, 2019-2031
- 12.1. Market Analysis, Insights and Forecast - By Country/Sub-region
- 12.1.1 Germany
- 12.1.2 United Kingdom
- 12.1.3 France
- 12.1.4 Italy
- 12.1.5 Spain
- 12.1.6 Rest of Europe
- 13. Asia Pacific E.coli Industry Analysis, Insights and Forecast, 2019-2031
- 13.1. Market Analysis, Insights and Forecast - By Country/Sub-region
- 13.1.1 China
- 13.1.2 Japan
- 13.1.3 India
- 13.1.4 Australia
- 13.1.5 South Korea
- 13.1.6 Rest of Asia Pacific
- 14. Middle East and Africa E.coli Industry Analysis, Insights and Forecast, 2019-2031
- 14.1. Market Analysis, Insights and Forecast - By Country/Sub-region
- 14.1.1 GCC
- 14.1.2 South Africa
- 14.1.3 Rest of Middle East and Africa
- 15. South America E.coli Industry Analysis, Insights and Forecast, 2019-2031
- 15.1. Market Analysis, Insights and Forecast - By Country/Sub-region
- 15.1.1 Brazil
- 15.1.2 Argentina
- 15.1.3 Rest of South America
- 16. Competitive Analysis
- 16.1. Global Market Share Analysis 2024
- 16.2. Company Profiles
- 16.2.1 Caisson Laboratories Inc
- 16.2.1.1. Overview
- 16.2.1.2. Products
- 16.2.1.3. SWOT Analysis
- 16.2.1.4. Recent Developments
- 16.2.1.5. Financials (Based on Availability)
- 16.2.2 Becton Dickinson and Company
- 16.2.2.1. Overview
- 16.2.2.2. Products
- 16.2.2.3. SWOT Analysis
- 16.2.2.4. Recent Developments
- 16.2.2.5. Financials (Based on Availability)
- 16.2.3 Bio-Rad Laboratories Inc
- 16.2.3.1. Overview
- 16.2.3.2. Products
- 16.2.3.3. SWOT Analysis
- 16.2.3.4. Recent Developments
- 16.2.3.5. Financials (Based on Availability)
- 16.2.4 Cell Culture Technologies LLC
- 16.2.4.1. Overview
- 16.2.4.2. Products
- 16.2.4.3. SWOT Analysis
- 16.2.4.4. Recent Developments
- 16.2.4.5. Financials (Based on Availability)
- 16.2.5 GE Healthcare
- 16.2.5.1. Overview
- 16.2.5.2. Products
- 16.2.5.3. SWOT Analysis
- 16.2.5.4. Recent Developments
- 16.2.5.5. Financials (Based on Availability)
- 16.2.6 Lonza Group Ltd
- 16.2.6.1. Overview
- 16.2.6.2. Products
- 16.2.6.3. SWOT Analysis
- 16.2.6.4. Recent Developments
- 16.2.6.5. Financials (Based on Availability)
- 16.2.7 HiMedia Laboratories Pvt Ltd
- 16.2.7.1. Overview
- 16.2.7.2. Products
- 16.2.7.3. SWOT Analysis
- 16.2.7.4. Recent Developments
- 16.2.7.5. Financials (Based on Availability)
- 16.2.8 Merck & Co Inc*List Not Exhaustive
- 16.2.8.1. Overview
- 16.2.8.2. Products
- 16.2.8.3. SWOT Analysis
- 16.2.8.4. Recent Developments
- 16.2.8.5. Financials (Based on Availability)
- 16.2.9 Corning Incorporated
- 16.2.9.1. Overview
- 16.2.9.2. Products
- 16.2.9.3. SWOT Analysis
- 16.2.9.4. Recent Developments
- 16.2.9.5. Financials (Based on Availability)
- 16.2.10 Fujifilm Holdings Corporation
- 16.2.10.1. Overview
- 16.2.10.2. Products
- 16.2.10.3. SWOT Analysis
- 16.2.10.4. Recent Developments
- 16.2.10.5. Financials (Based on Availability)
- 16.2.1 Caisson Laboratories Inc
List of Figures
- Figure 1: Global E.coli Industry Revenue Breakdown (Million, %) by Region 2024 & 2032
- Figure 2: North America E.coli Industry Revenue (Million), by Country 2024 & 2032
- Figure 3: North America E.coli Industry Revenue Share (%), by Country 2024 & 2032
- Figure 4: Europe E.coli Industry Revenue (Million), by Country 2024 & 2032
- Figure 5: Europe E.coli Industry Revenue Share (%), by Country 2024 & 2032
- Figure 6: Asia Pacific E.coli Industry Revenue (Million), by Country 2024 & 2032
- Figure 7: Asia Pacific E.coli Industry Revenue Share (%), by Country 2024 & 2032
- Figure 8: Middle East and Africa E.coli Industry Revenue (Million), by Country 2024 & 2032
- Figure 9: Middle East and Africa E.coli Industry Revenue Share (%), by Country 2024 & 2032
- Figure 10: South America E.coli Industry Revenue (Million), by Country 2024 & 2032
- Figure 11: South America E.coli Industry Revenue Share (%), by Country 2024 & 2032
- Figure 12: North America E.coli Industry Revenue (Million), by Test 2024 & 2032
- Figure 13: North America E.coli Industry Revenue Share (%), by Test 2024 & 2032
- Figure 14: North America E.coli Industry Revenue (Million), by Country 2024 & 2032
- Figure 15: North America E.coli Industry Revenue Share (%), by Country 2024 & 2032
- Figure 16: Europe E.coli Industry Revenue (Million), by Test 2024 & 2032
- Figure 17: Europe E.coli Industry Revenue Share (%), by Test 2024 & 2032
- Figure 18: Europe E.coli Industry Revenue (Million), by Country 2024 & 2032
- Figure 19: Europe E.coli Industry Revenue Share (%), by Country 2024 & 2032
- Figure 20: Asia Pacific E.coli Industry Revenue (Million), by Test 2024 & 2032
- Figure 21: Asia Pacific E.coli Industry Revenue Share (%), by Test 2024 & 2032
- Figure 22: Asia Pacific E.coli Industry Revenue (Million), by Country 2024 & 2032
- Figure 23: Asia Pacific E.coli Industry Revenue Share (%), by Country 2024 & 2032
- Figure 24: Middle East and Africa E.coli Industry Revenue (Million), by Test 2024 & 2032
- Figure 25: Middle East and Africa E.coli Industry Revenue Share (%), by Test 2024 & 2032
- Figure 26: Middle East and Africa E.coli Industry Revenue (Million), by Country 2024 & 2032
- Figure 27: Middle East and Africa E.coli Industry Revenue Share (%), by Country 2024 & 2032
- Figure 28: South America E.coli Industry Revenue (Million), by Test 2024 & 2032
- Figure 29: South America E.coli Industry Revenue Share (%), by Test 2024 & 2032
- Figure 30: South America E.coli Industry Revenue (Million), by Country 2024 & 2032
- Figure 31: South America E.coli Industry Revenue Share (%), by Country 2024 & 2032
List of Tables
- Table 1: Global E.coli Industry Revenue Million Forecast, by Region 2019 & 2032
- Table 2: Global E.coli Industry Revenue Million Forecast, by Test 2019 & 2032
- Table 3: Global E.coli Industry Revenue Million Forecast, by Region 2019 & 2032
- Table 4: Global E.coli Industry Revenue Million Forecast, by Country 2019 & 2032
- Table 5: United States E.coli Industry Revenue (Million) Forecast, by Application 2019 & 2032
- Table 6: Canada E.coli Industry Revenue (Million) Forecast, by Application 2019 & 2032
- Table 7: Mexico E.coli Industry Revenue (Million) Forecast, by Application 2019 & 2032
- Table 8: Global E.coli Industry Revenue Million Forecast, by Country 2019 & 2032
- Table 9: Germany E.coli Industry Revenue (Million) Forecast, by Application 2019 & 2032
- Table 10: United Kingdom E.coli Industry Revenue (Million) Forecast, by Application 2019 & 2032
- Table 11: France E.coli Industry Revenue (Million) Forecast, by Application 2019 & 2032
- Table 12: Italy E.coli Industry Revenue (Million) Forecast, by Application 2019 & 2032
- Table 13: Spain E.coli Industry Revenue (Million) Forecast, by Application 2019 & 2032
- Table 14: Rest of Europe E.coli Industry Revenue (Million) Forecast, by Application 2019 & 2032
- Table 15: Global E.coli Industry Revenue Million Forecast, by Country 2019 & 2032
- Table 16: China E.coli Industry Revenue (Million) Forecast, by Application 2019 & 2032
- Table 17: Japan E.coli Industry Revenue (Million) Forecast, by Application 2019 & 2032
- Table 18: India E.coli Industry Revenue (Million) Forecast, by Application 2019 & 2032
- Table 19: Australia E.coli Industry Revenue (Million) Forecast, by Application 2019 & 2032
- Table 20: South Korea E.coli Industry Revenue (Million) Forecast, by Application 2019 & 2032
- Table 21: Rest of Asia Pacific E.coli Industry Revenue (Million) Forecast, by Application 2019 & 2032
- Table 22: Global E.coli Industry Revenue Million Forecast, by Country 2019 & 2032
- Table 23: GCC E.coli Industry Revenue (Million) Forecast, by Application 2019 & 2032
- Table 24: South Africa E.coli Industry Revenue (Million) Forecast, by Application 2019 & 2032
- Table 25: Rest of Middle East and Africa E.coli Industry Revenue (Million) Forecast, by Application 2019 & 2032
- Table 26: Global E.coli Industry Revenue Million Forecast, by Country 2019 & 2032
- Table 27: Brazil E.coli Industry Revenue (Million) Forecast, by Application 2019 & 2032
- Table 28: Argentina E.coli Industry Revenue (Million) Forecast, by Application 2019 & 2032
- Table 29: Rest of South America E.coli Industry Revenue (Million) Forecast, by Application 2019 & 2032
- Table 30: Global E.coli Industry Revenue Million Forecast, by Test 2019 & 2032
- Table 31: Global E.coli Industry Revenue Million Forecast, by Country 2019 & 2032
- Table 32: United States E.coli Industry Revenue (Million) Forecast, by Application 2019 & 2032
- Table 33: Canada E.coli Industry Revenue (Million) Forecast, by Application 2019 & 2032
- Table 34: Mexico E.coli Industry Revenue (Million) Forecast, by Application 2019 & 2032
- Table 35: Global E.coli Industry Revenue Million Forecast, by Test 2019 & 2032
- Table 36: Global E.coli Industry Revenue Million Forecast, by Country 2019 & 2032
- Table 37: Germany E.coli Industry Revenue (Million) Forecast, by Application 2019 & 2032
- Table 38: United Kingdom E.coli Industry Revenue (Million) Forecast, by Application 2019 & 2032
- Table 39: France E.coli Industry Revenue (Million) Forecast, by Application 2019 & 2032
- Table 40: Italy E.coli Industry Revenue (Million) Forecast, by Application 2019 & 2032
- Table 41: Spain E.coli Industry Revenue (Million) Forecast, by Application 2019 & 2032
- Table 42: Rest of Europe E.coli Industry Revenue (Million) Forecast, by Application 2019 & 2032
- Table 43: Global E.coli Industry Revenue Million Forecast, by Test 2019 & 2032
- Table 44: Global E.coli Industry Revenue Million Forecast, by Country 2019 & 2032
- Table 45: China E.coli Industry Revenue (Million) Forecast, by Application 2019 & 2032
- Table 46: Japan E.coli Industry Revenue (Million) Forecast, by Application 2019 & 2032
- Table 47: India E.coli Industry Revenue (Million) Forecast, by Application 2019 & 2032
- Table 48: Australia E.coli Industry Revenue (Million) Forecast, by Application 2019 & 2032
- Table 49: South Korea E.coli Industry Revenue (Million) Forecast, by Application 2019 & 2032
- Table 50: Rest of Asia Pacific E.coli Industry Revenue (Million) Forecast, by Application 2019 & 2032
- Table 51: Global E.coli Industry Revenue Million Forecast, by Test 2019 & 2032
- Table 52: Global E.coli Industry Revenue Million Forecast, by Country 2019 & 2032
- Table 53: GCC E.coli Industry Revenue (Million) Forecast, by Application 2019 & 2032
- Table 54: South Africa E.coli Industry Revenue (Million) Forecast, by Application 2019 & 2032
- Table 55: Rest of Middle East and Africa E.coli Industry Revenue (Million) Forecast, by Application 2019 & 2032
- Table 56: Global E.coli Industry Revenue Million Forecast, by Test 2019 & 2032
- Table 57: Global E.coli Industry Revenue Million Forecast, by Country 2019 & 2032
- Table 58: Brazil E.coli Industry Revenue (Million) Forecast, by Application 2019 & 2032
- Table 59: Argentina E.coli Industry Revenue (Million) Forecast, by Application 2019 & 2032
- Table 60: Rest of South America E.coli Industry Revenue (Million) Forecast, by Application 2019 & 2032
Frequently Asked Questions
1. What is the projected Compound Annual Growth Rate (CAGR) of the E.coli Industry?
The projected CAGR is approximately 7.93%.
2. Which companies are prominent players in the E.coli Industry?
Key companies in the market include Caisson Laboratories Inc, Becton Dickinson and Company, Bio-Rad Laboratories Inc, Cell Culture Technologies LLC, GE Healthcare, Lonza Group Ltd, HiMedia Laboratories Pvt Ltd, Merck & Co Inc*List Not Exhaustive, Corning Incorporated, Fujifilm Holdings Corporation.
3. What are the main segments of the E.coli Industry?
The market segments include Test.
4. Can you provide details about the market size?
The market size is estimated to be USD 1.36 Million as of 2022.
5. What are some drivers contributing to market growth?
Increasing Prevalence of Diarrhoea; New Technological Advancements.
6. What are the notable trends driving market growth?
Polymerase Chain Reaction Segment is Expected to be Major Segment in the Escherichia coli Testing Market.
7. Are there any restraints impacting market growth?
High Cost of E. coli Treatment.
8. Can you provide examples of recent developments in the market?
In June 2022, Researchers from the Indian Institute of Technology (IIT) Kanpur developed an enzyme-substrate medium-based E.coli. water testing kit that is highly sensitive and can detect the presence or absence of a single E.coli. in drinking water.
9. What pricing options are available for accessing the report?
Pricing options include single-user, multi-user, and enterprise licenses priced at USD 4750, USD 5250, and USD 8750 respectively.
10. Is the market size provided in terms of value or volume?
The market size is provided in terms of value, measured in Million.
11. Are there any specific market keywords associated with the report?
Yes, the market keyword associated with the report is "E.coli Industry," which aids in identifying and referencing the specific market segment covered.
12. How do I determine which pricing option suits my needs best?
The pricing options vary based on user requirements and access needs. Individual users may opt for single-user licenses, while businesses requiring broader access may choose multi-user or enterprise licenses for cost-effective access to the report.
13. Are there any additional resources or data provided in the E.coli Industry report?
While the report offers comprehensive insights, it's advisable to review the specific contents or supplementary materials provided to ascertain if additional resources or data are available.
14. How can I stay updated on further developments or reports in the E.coli Industry?
To stay informed about further developments, trends, and reports in the E.coli Industry, consider subscribing to industry newsletters, following relevant companies and organizations, or regularly checking reputable industry news sources and publications.
Methodology
Step 1 - Identification of Relevant Samples Size from Population Database


Step 2 - Approaches for Defining Global Market Size (Value, Volume* & Price*)

Note*: In applicable scenarios
Step 3 - Data Sources
Primary Research
- Web Analytics
- Survey Reports
- Research Institute
- Latest Research Reports
- Opinion Leaders
Secondary Research
- Annual Reports
- White Paper
- Latest Press Release
- Industry Association
- Paid Database
- Investor Presentations

Step 4 - Data Triangulation
Involves using different sources of information in order to increase the validity of a study
These sources are likely to be stakeholders in a program - participants, other researchers, program staff, other community members, and so on.
Then we put all data in single framework & apply various statistical tools to find out the dynamic on the market.
During the analysis stage, feedback from the stakeholder groups would be compared to determine areas of agreement as well as areas of divergence
