

Key Insights
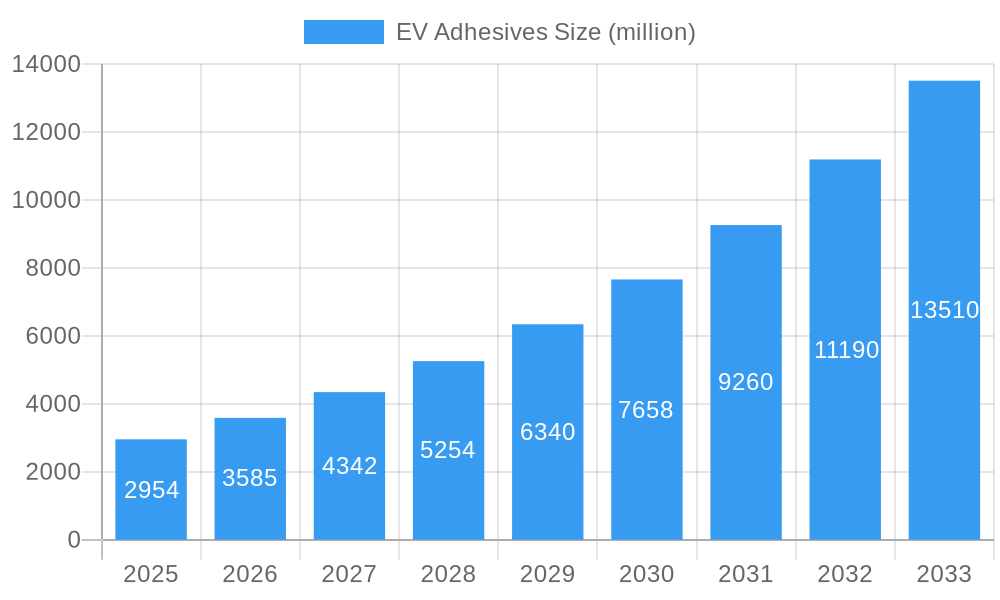
The global Electric Vehicle (EV) adhesives market, valued at $2.954 billion in 2025, is poised for substantial growth, exhibiting a robust Compound Annual Growth Rate (CAGR) of 21.1% from 2025 to 2033. This rapid expansion is driven by the burgeoning EV industry itself, fueled by increasing environmental concerns and government incentives promoting electric mobility. Key drivers include the rising demand for lightweight and high-performance vehicles, necessitating advanced adhesive solutions for battery packs, structural bonding, and interior components. Furthermore, continuous innovations in adhesive technology, leading to stronger, lighter, and more environmentally friendly options, are further propelling market growth. The market is segmented by adhesive type (e.g., epoxy, polyurethane, acrylic), application (e.g., battery packs, body panels, interiors), and vehicle type (e.g., passenger cars, commercial vehicles). Major players like Dow, Henkel, Sika, 3M, and others are investing heavily in research and development to cater to the evolving needs of the EV sector.
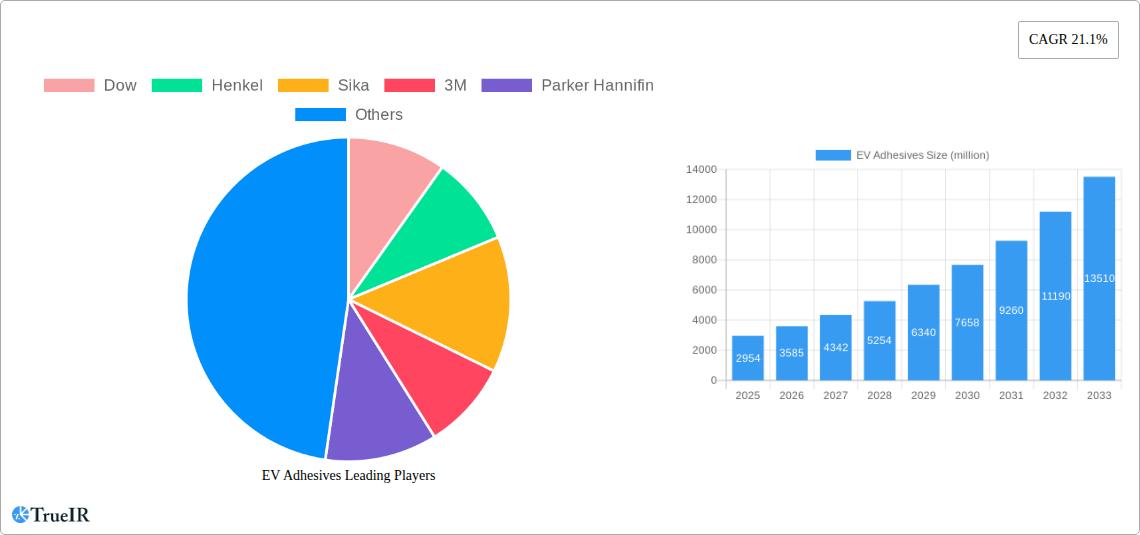
EV Adhesives Market Size (In Billion)
The market's strong growth trajectory is expected to continue throughout the forecast period, with significant regional variations. While North America and Europe currently hold substantial market share, the Asia-Pacific region is anticipated to experience the fastest growth due to the rapid expansion of the EV manufacturing base in countries like China and India. However, challenges remain, such as the high cost of some specialized EV adhesives and the need for robust quality control and testing procedures to ensure the long-term reliability of bonded components in demanding automotive applications. Nonetheless, the overall outlook for the EV adhesives market remains extremely positive, driven by the unrelenting global shift towards electric vehicles and the crucial role adhesives play in their efficient and safe operation.
EV Adhesives Company Market Share
Dynamic Report: EV Adhesives Market Analysis & Forecast (2019-2033)
This comprehensive report provides a deep dive into the burgeoning Electric Vehicle (EV) Adhesives market, projecting a multi-million dollar valuation by 2033. We analyze market dynamics, competitive landscapes, and future growth trajectories, offering invaluable insights for industry stakeholders, investors, and strategic decision-makers. The report covers the historical period (2019-2024), the base year (2025), and forecasts from 2025-2033.
EV Adhesives Market Structure & Competitive Landscape
The EV adhesives market is characterized by a moderately concentrated landscape with key players vying for market share. The top 10 companies – Dow, Henkel, Sika, 3M, Parker Hannifin, Huntsman, DuPont, PPG, H.B. Fuller, and Arkema – collectively hold an estimated xx% market share in 2025. This concentration is driven by significant investments in R&D, leading to continuous product innovation and differentiation. The market exhibits strong M&A activity, with an estimated xx million USD worth of deals recorded between 2019 and 2024. This highlights the consolidation trend and strategic acquisitions aimed at expanding product portfolios and gaining access to new technologies.
- High Barriers to Entry: Significant capital investment in R&D and manufacturing facilities poses a significant barrier for new entrants.
- Regulatory Scrutiny: Stringent environmental regulations concerning VOC emissions and adhesive composition impact product formulation and manufacturing processes.
- Product Substitutes: While adhesives remain dominant, the emergence of alternative joining techniques such as welding and mechanical fasteners presents a degree of substitution.
- End-User Segmentation: The market is primarily driven by automotive manufacturers, with increasing demand from battery manufacturers and other EV components suppliers.
- Innovation Drivers: The push for lightweighting in EVs, advancements in material science, and the demand for higher performance adhesives fuel continuous innovation.
EV Adhesives Market Trends & Opportunities
The global EV adhesives market is poised for exponential growth, driven by the surging adoption of electric vehicles. The market size is projected to reach xx million USD by 2033, exhibiting a Compound Annual Growth Rate (CAGR) of xx% during the forecast period (2025-2033). This growth is fueled by multiple factors: increasing demand for high-performance, lightweight vehicles, stringent fuel efficiency regulations globally, and the rising consumer preference for environmentally friendly transportation options. Technological advancements in adhesive formulations, enabling improved bonding strength, durability, and thermal stability, further propel market expansion. Market penetration rates are expected to increase significantly, especially in emerging economies witnessing rapid EV adoption. The competitive landscape is becoming increasingly dynamic, with companies focusing on strategic partnerships, collaborations, and product diversification to gain a competitive edge.
Dominant Markets & Segments in EV Adhesives
The Asia-Pacific region is projected to dominate the EV adhesives market throughout the forecast period, driven by massive EV production in China and other rapidly developing economies. China, in particular, is expected to remain the largest national market, accounting for approximately xx million USD in revenue by 2033.
- Key Growth Drivers in Asia-Pacific:
- Rapid expansion of EV manufacturing facilities.
- Supportive government policies promoting EV adoption.
- Increasing investments in charging infrastructure.
- Growing consumer awareness and preference for EVs.
- Market Dominance Analysis: China's dominance is primarily attributed to its significant manufacturing capacity, supportive government policies, and the large domestic EV market. Other key regions, including Europe and North America, are also witnessing substantial growth but at a comparatively slower pace.
EV Adhesives Product Analysis
The EV adhesives market showcases a diverse range of products, tailored to specific applications within electric vehicles. These include structural adhesives for bonding battery packs, body panels, and other critical components; encapsulants for protecting electronic modules; and sealants for ensuring water and dust resistance. Technological advancements focus on developing high-strength, lightweight, and environmentally friendly adhesives that meet the stringent performance requirements of electric vehicles. The market is witnessing the growing adoption of bio-based adhesives and those with enhanced thermal stability, improving the overall performance and longevity of EVs.
Key Drivers, Barriers & Challenges in EV Adhesives
Growth Drivers: The primary drivers are the rapid expansion of the EV industry, stringent emission regulations, and the continuous development of advanced adhesive technologies offering superior performance and cost-effectiveness. Government incentives and subsidies for EV adoption further stimulate market growth.
Challenges: Key challenges include the complexities of supply chain management, especially for specialized raw materials; increasing raw material prices; and the stringent regulatory landscape concerning VOC emissions and adhesive composition. Competitive pressures from substitute materials and the need for continuous innovation to meet evolving EV design requirements also pose significant hurdles. The impact of these challenges is estimated to reduce the market growth by approximately xx% by 2033.
Growth Drivers in the EV Adhesives Market
The EV adhesives market's robust growth is primarily propelled by the escalating demand for electric vehicles globally. Stringent emission regulations and government incentives are driving the transition to EVs, thereby increasing demand for high-performance adhesives. Technological advancements in adhesive formulations, including the development of lightweight, high-strength, and environmentally friendly options, further enhance market expansion.
Challenges Impacting EV Adhesives Growth
Significant challenges include the volatility of raw material prices, potential supply chain disruptions, and the stringent regulatory requirements governing adhesive composition and VOC emissions. These factors contribute to increased production costs and potentially restrict market growth. The intensifying competition among established players further poses a challenge for smaller participants in the market.
Key Players Shaping the EV Adhesives Market
- Dow
- Henkel
- Sika
- 3M
- Parker Hannifin
- Huntsman
- DuPont
- PPG
- H.B. Fuller
- Arkema
- Wacker Chemie
- Hubei Huitian New Materials
Significant EV Adhesives Industry Milestones
- 2020: Dow introduces a new range of bio-based adhesives for EV battery packs.
- 2021: Henkel announces a strategic partnership with a major EV manufacturer for the supply of structural adhesives.
- 2022: 3M launches a high-performance adhesive with enhanced thermal stability for electric motor applications.
- 2023: Sika acquires a smaller specialty adhesive manufacturer, expanding its product portfolio in the EV sector.
- 2024: Significant investment in R&D across the industry focused on improving sustainability of EV adhesives
Future Outlook for EV Adhesives Market
The future of the EV adhesives market appears exceptionally bright, driven by the continued growth of the EV industry and ongoing technological advancements. Strategic partnerships, expansion into new geographic markets, and diversification of product portfolios will be critical for companies to maintain a competitive edge. The focus on sustainability and the development of environmentally friendly adhesives will also play a crucial role in shaping the future landscape of this dynamic sector. The market is projected to maintain a strong growth trajectory, with further consolidation and innovation expected in the coming years.
EV Adhesives Segmentation
-
1. Application
- 1.1. EV Body Structure
- 1.2. EV Battery System
-
2. Types
- 2.1. Polyurethane Adhesive
- 2.2. Epoxy Adhesive
- 2.3. Silicone Adhesive
- 2.4. Other
EV Adhesives Segmentation By Geography
-
1. North America
- 1.1. United States
- 1.2. Canada
- 1.3. Mexico
-
2. South America
- 2.1. Brazil
- 2.2. Argentina
- 2.3. Rest of South America
-
3. Europe
- 3.1. United Kingdom
- 3.2. Germany
- 3.3. France
- 3.4. Italy
- 3.5. Spain
- 3.6. Russia
- 3.7. Benelux
- 3.8. Nordics
- 3.9. Rest of Europe
-
4. Middle East & Africa
- 4.1. Turkey
- 4.2. Israel
- 4.3. GCC
- 4.4. North Africa
- 4.5. South Africa
- 4.6. Rest of Middle East & Africa
-
5. Asia Pacific
- 5.1. China
- 5.2. India
- 5.3. Japan
- 5.4. South Korea
- 5.5. ASEAN
- 5.6. Oceania
- 5.7. Rest of Asia Pacific

EV Adhesives Regional Market Share
Geographic Coverage of EV Adhesives
EV Adhesives REPORT HIGHLIGHTS
| Aspects | Details |
|---|---|
| Study Period | 2020-2034 |
| Base Year | 2025 |
| Estimated Year | 2026 |
| Forecast Period | 2026-2034 |
| Historical Period | 2020-2025 |
| Growth Rate | CAGR of 5.8% from 2020-2034 |
| Segmentation |
|
Table of Contents
- 1. Introduction
- 1.1. Research Scope
- 1.2. Market Segmentation
- 1.3. Research Objective
- 1.4. Definitions and Assumptions
- 2. Executive Summary
- 2.1. Market Snapshot
- 3. Market Dynamics
- 3.1. Market Drivers
- 3.2. Market Restrains
- 3.3. Market Trends
- 3.4. Market Opportunities
- 4. Market Factor Analysis
- 4.1. Porters Five Forces
- 4.1.1. Bargaining Power of Suppliers
- 4.1.2. Bargaining Power of Buyers
- 4.1.3. Threat of New Entrants
- 4.1.4. Threat of Substitutes
- 4.1.5. Competitive Rivalry
- 4.2. PESTEL analysis
- 4.3. BCG Analysis
- 4.3.1. Stars (High Growth, High Market Share)
- 4.3.2. Cash Cows (Low Growth, High Market Share)
- 4.3.3. Question Mark (High Growth, Low Market Share)
- 4.3.4. Dogs (Low Growth, Low Market Share)
- 4.4. Ansoff Matrix Analysis
- 4.5. Supply Chain Analysis
- 4.6. Regulatory Landscape
- 4.7. Current Market Potential and Opportunity Assessment (TAM–SAM–SOM Framework)
- 4.8. TIR Analyst Note
- 4.1. Porters Five Forces
- 5. Market Analysis, Insights and Forecast 2021-2033
- 5.1. Market Analysis, Insights and Forecast - by Application
- 5.1.1. EV Body Structure
- 5.1.2. EV Battery System
- 5.2. Market Analysis, Insights and Forecast - by Types
- 5.2.1. Polyurethane Adhesive
- 5.2.2. Epoxy Adhesive
- 5.2.3. Silicone Adhesive
- 5.2.4. Other
- 5.3. Market Analysis, Insights and Forecast - by Region
- 5.3.1. North America
- 5.3.2. South America
- 5.3.3. Europe
- 5.3.4. Middle East & Africa
- 5.3.5. Asia Pacific
- 5.1. Market Analysis, Insights and Forecast - by Application
- 6. Global EV Adhesives Analysis, Insights and Forecast, 2021-2033
- 6.1. Market Analysis, Insights and Forecast - by Application
- 6.1.1. EV Body Structure
- 6.1.2. EV Battery System
- 6.2. Market Analysis, Insights and Forecast - by Types
- 6.2.1. Polyurethane Adhesive
- 6.2.2. Epoxy Adhesive
- 6.2.3. Silicone Adhesive
- 6.2.4. Other
- 6.1. Market Analysis, Insights and Forecast - by Application
- 7. North America EV Adhesives Analysis, Insights and Forecast, 2020-2032
- 7.1. Market Analysis, Insights and Forecast - by Application
- 7.1.1. EV Body Structure
- 7.1.2. EV Battery System
- 7.2. Market Analysis, Insights and Forecast - by Types
- 7.2.1. Polyurethane Adhesive
- 7.2.2. Epoxy Adhesive
- 7.2.3. Silicone Adhesive
- 7.2.4. Other
- 7.1. Market Analysis, Insights and Forecast - by Application
- 8. South America EV Adhesives Analysis, Insights and Forecast, 2020-2032
- 8.1. Market Analysis, Insights and Forecast - by Application
- 8.1.1. EV Body Structure
- 8.1.2. EV Battery System
- 8.2. Market Analysis, Insights and Forecast - by Types
- 8.2.1. Polyurethane Adhesive
- 8.2.2. Epoxy Adhesive
- 8.2.3. Silicone Adhesive
- 8.2.4. Other
- 8.1. Market Analysis, Insights and Forecast - by Application
- 9. Europe EV Adhesives Analysis, Insights and Forecast, 2020-2032
- 9.1. Market Analysis, Insights and Forecast - by Application
- 9.1.1. EV Body Structure
- 9.1.2. EV Battery System
- 9.2. Market Analysis, Insights and Forecast - by Types
- 9.2.1. Polyurethane Adhesive
- 9.2.2. Epoxy Adhesive
- 9.2.3. Silicone Adhesive
- 9.2.4. Other
- 9.1. Market Analysis, Insights and Forecast - by Application
- 10. Middle East & Africa EV Adhesives Analysis, Insights and Forecast, 2020-2032
- 10.1. Market Analysis, Insights and Forecast - by Application
- 10.1.1. EV Body Structure
- 10.1.2. EV Battery System
- 10.2. Market Analysis, Insights and Forecast - by Types
- 10.2.1. Polyurethane Adhesive
- 10.2.2. Epoxy Adhesive
- 10.2.3. Silicone Adhesive
- 10.2.4. Other
- 10.1. Market Analysis, Insights and Forecast - by Application
- 11. Asia Pacific EV Adhesives Analysis, Insights and Forecast, 2020-2032
- 11.1. Market Analysis, Insights and Forecast - by Application
- 11.1.1. EV Body Structure
- 11.1.2. EV Battery System
- 11.2. Market Analysis, Insights and Forecast - by Types
- 11.2.1. Polyurethane Adhesive
- 11.2.2. Epoxy Adhesive
- 11.2.3. Silicone Adhesive
- 11.2.4. Other
- 11.1. Market Analysis, Insights and Forecast - by Application
- 12. Competitive Analysis
- 12.1. Company Profiles
- 12.1.1 Dow
- 12.1.1.1. Company Overview
- 12.1.1.2. Products
- 12.1.1.3. Company Financials
- 12.1.1.4. SWOT Analysis
- 12.1.2 Henkel
- 12.1.2.1. Company Overview
- 12.1.2.2. Products
- 12.1.2.3. Company Financials
- 12.1.2.4. SWOT Analysis
- 12.1.3 Sika
- 12.1.3.1. Company Overview
- 12.1.3.2. Products
- 12.1.3.3. Company Financials
- 12.1.3.4. SWOT Analysis
- 12.1.4 3M
- 12.1.4.1. Company Overview
- 12.1.4.2. Products
- 12.1.4.3. Company Financials
- 12.1.4.4. SWOT Analysis
- 12.1.5 Parker Hannifin
- 12.1.5.1. Company Overview
- 12.1.5.2. Products
- 12.1.5.3. Company Financials
- 12.1.5.4. SWOT Analysis
- 12.1.6 Huntsman
- 12.1.6.1. Company Overview
- 12.1.6.2. Products
- 12.1.6.3. Company Financials
- 12.1.6.4. SWOT Analysis
- 12.1.7 DuPont
- 12.1.7.1. Company Overview
- 12.1.7.2. Products
- 12.1.7.3. Company Financials
- 12.1.7.4. SWOT Analysis
- 12.1.8 PPG
- 12.1.8.1. Company Overview
- 12.1.8.2. Products
- 12.1.8.3. Company Financials
- 12.1.8.4. SWOT Analysis
- 12.1.9 H.B. Fuller
- 12.1.9.1. Company Overview
- 12.1.9.2. Products
- 12.1.9.3. Company Financials
- 12.1.9.4. SWOT Analysis
- 12.1.10 Arkema
- 12.1.10.1. Company Overview
- 12.1.10.2. Products
- 12.1.10.3. Company Financials
- 12.1.10.4. SWOT Analysis
- 12.1.11 Wacker Chemie
- 12.1.11.1. Company Overview
- 12.1.11.2. Products
- 12.1.11.3. Company Financials
- 12.1.11.4. SWOT Analysis
- 12.1.12 Hubei Huitian New Materials
- 12.1.12.1. Company Overview
- 12.1.12.2. Products
- 12.1.12.3. Company Financials
- 12.1.12.4. SWOT Analysis
- 12.1.1 Dow
- 12.2. Market Entropy
- 12.2.1 Company's Key Areas Served
- 12.2.2 Recent Developments
- 12.3. Company Market Share Analysis 2025
- 12.3.1 Top 5 Companies Market Share Analysis
- 12.3.2 Top 3 Companies Market Share Analysis
- 12.4. List of Potential Customers
- 13. Research Methodology
List of Figures
- Figure 1: Global EV Adhesives Revenue Breakdown (billion, %) by Region 2025 & 2033
- Figure 2: Global EV Adhesives Volume Breakdown (K, %) by Region 2025 & 2033
- Figure 3: North America EV Adhesives Revenue (billion), by Application 2025 & 2033
- Figure 4: North America EV Adhesives Volume (K), by Application 2025 & 2033
- Figure 5: North America EV Adhesives Revenue Share (%), by Application 2025 & 2033
- Figure 6: North America EV Adhesives Volume Share (%), by Application 2025 & 2033
- Figure 7: North America EV Adhesives Revenue (billion), by Types 2025 & 2033
- Figure 8: North America EV Adhesives Volume (K), by Types 2025 & 2033
- Figure 9: North America EV Adhesives Revenue Share (%), by Types 2025 & 2033
- Figure 10: North America EV Adhesives Volume Share (%), by Types 2025 & 2033
- Figure 11: North America EV Adhesives Revenue (billion), by Country 2025 & 2033
- Figure 12: North America EV Adhesives Volume (K), by Country 2025 & 2033
- Figure 13: North America EV Adhesives Revenue Share (%), by Country 2025 & 2033
- Figure 14: North America EV Adhesives Volume Share (%), by Country 2025 & 2033
- Figure 15: South America EV Adhesives Revenue (billion), by Application 2025 & 2033
- Figure 16: South America EV Adhesives Volume (K), by Application 2025 & 2033
- Figure 17: South America EV Adhesives Revenue Share (%), by Application 2025 & 2033
- Figure 18: South America EV Adhesives Volume Share (%), by Application 2025 & 2033
- Figure 19: South America EV Adhesives Revenue (billion), by Types 2025 & 2033
- Figure 20: South America EV Adhesives Volume (K), by Types 2025 & 2033
- Figure 21: South America EV Adhesives Revenue Share (%), by Types 2025 & 2033
- Figure 22: South America EV Adhesives Volume Share (%), by Types 2025 & 2033
- Figure 23: South America EV Adhesives Revenue (billion), by Country 2025 & 2033
- Figure 24: South America EV Adhesives Volume (K), by Country 2025 & 2033
- Figure 25: South America EV Adhesives Revenue Share (%), by Country 2025 & 2033
- Figure 26: South America EV Adhesives Volume Share (%), by Country 2025 & 2033
- Figure 27: Europe EV Adhesives Revenue (billion), by Application 2025 & 2033
- Figure 28: Europe EV Adhesives Volume (K), by Application 2025 & 2033
- Figure 29: Europe EV Adhesives Revenue Share (%), by Application 2025 & 2033
- Figure 30: Europe EV Adhesives Volume Share (%), by Application 2025 & 2033
- Figure 31: Europe EV Adhesives Revenue (billion), by Types 2025 & 2033
- Figure 32: Europe EV Adhesives Volume (K), by Types 2025 & 2033
- Figure 33: Europe EV Adhesives Revenue Share (%), by Types 2025 & 2033
- Figure 34: Europe EV Adhesives Volume Share (%), by Types 2025 & 2033
- Figure 35: Europe EV Adhesives Revenue (billion), by Country 2025 & 2033
- Figure 36: Europe EV Adhesives Volume (K), by Country 2025 & 2033
- Figure 37: Europe EV Adhesives Revenue Share (%), by Country 2025 & 2033
- Figure 38: Europe EV Adhesives Volume Share (%), by Country 2025 & 2033
- Figure 39: Middle East & Africa EV Adhesives Revenue (billion), by Application 2025 & 2033
- Figure 40: Middle East & Africa EV Adhesives Volume (K), by Application 2025 & 2033
- Figure 41: Middle East & Africa EV Adhesives Revenue Share (%), by Application 2025 & 2033
- Figure 42: Middle East & Africa EV Adhesives Volume Share (%), by Application 2025 & 2033
- Figure 43: Middle East & Africa EV Adhesives Revenue (billion), by Types 2025 & 2033
- Figure 44: Middle East & Africa EV Adhesives Volume (K), by Types 2025 & 2033
- Figure 45: Middle East & Africa EV Adhesives Revenue Share (%), by Types 2025 & 2033
- Figure 46: Middle East & Africa EV Adhesives Volume Share (%), by Types 2025 & 2033
- Figure 47: Middle East & Africa EV Adhesives Revenue (billion), by Country 2025 & 2033
- Figure 48: Middle East & Africa EV Adhesives Volume (K), by Country 2025 & 2033
- Figure 49: Middle East & Africa EV Adhesives Revenue Share (%), by Country 2025 & 2033
- Figure 50: Middle East & Africa EV Adhesives Volume Share (%), by Country 2025 & 2033
- Figure 51: Asia Pacific EV Adhesives Revenue (billion), by Application 2025 & 2033
- Figure 52: Asia Pacific EV Adhesives Volume (K), by Application 2025 & 2033
- Figure 53: Asia Pacific EV Adhesives Revenue Share (%), by Application 2025 & 2033
- Figure 54: Asia Pacific EV Adhesives Volume Share (%), by Application 2025 & 2033
- Figure 55: Asia Pacific EV Adhesives Revenue (billion), by Types 2025 & 2033
- Figure 56: Asia Pacific EV Adhesives Volume (K), by Types 2025 & 2033
- Figure 57: Asia Pacific EV Adhesives Revenue Share (%), by Types 2025 & 2033
- Figure 58: Asia Pacific EV Adhesives Volume Share (%), by Types 2025 & 2033
- Figure 59: Asia Pacific EV Adhesives Revenue (billion), by Country 2025 & 2033
- Figure 60: Asia Pacific EV Adhesives Volume (K), by Country 2025 & 2033
- Figure 61: Asia Pacific EV Adhesives Revenue Share (%), by Country 2025 & 2033
- Figure 62: Asia Pacific EV Adhesives Volume Share (%), by Country 2025 & 2033
List of Tables
- Table 1: Global EV Adhesives Revenue billion Forecast, by Application 2020 & 2033
- Table 2: Global EV Adhesives Volume K Forecast, by Application 2020 & 2033
- Table 3: Global EV Adhesives Revenue billion Forecast, by Types 2020 & 2033
- Table 4: Global EV Adhesives Volume K Forecast, by Types 2020 & 2033
- Table 5: Global EV Adhesives Revenue billion Forecast, by Region 2020 & 2033
- Table 6: Global EV Adhesives Volume K Forecast, by Region 2020 & 2033
- Table 7: Global EV Adhesives Revenue billion Forecast, by Application 2020 & 2033
- Table 8: Global EV Adhesives Volume K Forecast, by Application 2020 & 2033
- Table 9: Global EV Adhesives Revenue billion Forecast, by Types 2020 & 2033
- Table 10: Global EV Adhesives Volume K Forecast, by Types 2020 & 2033
- Table 11: Global EV Adhesives Revenue billion Forecast, by Country 2020 & 2033
- Table 12: Global EV Adhesives Volume K Forecast, by Country 2020 & 2033
- Table 13: United States EV Adhesives Revenue (billion) Forecast, by Application 2020 & 2033
- Table 14: United States EV Adhesives Volume (K) Forecast, by Application 2020 & 2033
- Table 15: Canada EV Adhesives Revenue (billion) Forecast, by Application 2020 & 2033
- Table 16: Canada EV Adhesives Volume (K) Forecast, by Application 2020 & 2033
- Table 17: Mexico EV Adhesives Revenue (billion) Forecast, by Application 2020 & 2033
- Table 18: Mexico EV Adhesives Volume (K) Forecast, by Application 2020 & 2033
- Table 19: Global EV Adhesives Revenue billion Forecast, by Application 2020 & 2033
- Table 20: Global EV Adhesives Volume K Forecast, by Application 2020 & 2033
- Table 21: Global EV Adhesives Revenue billion Forecast, by Types 2020 & 2033
- Table 22: Global EV Adhesives Volume K Forecast, by Types 2020 & 2033
- Table 23: Global EV Adhesives Revenue billion Forecast, by Country 2020 & 2033
- Table 24: Global EV Adhesives Volume K Forecast, by Country 2020 & 2033
- Table 25: Brazil EV Adhesives Revenue (billion) Forecast, by Application 2020 & 2033
- Table 26: Brazil EV Adhesives Volume (K) Forecast, by Application 2020 & 2033
- Table 27: Argentina EV Adhesives Revenue (billion) Forecast, by Application 2020 & 2033
- Table 28: Argentina EV Adhesives Volume (K) Forecast, by Application 2020 & 2033
- Table 29: Rest of South America EV Adhesives Revenue (billion) Forecast, by Application 2020 & 2033
- Table 30: Rest of South America EV Adhesives Volume (K) Forecast, by Application 2020 & 2033
- Table 31: Global EV Adhesives Revenue billion Forecast, by Application 2020 & 2033
- Table 32: Global EV Adhesives Volume K Forecast, by Application 2020 & 2033
- Table 33: Global EV Adhesives Revenue billion Forecast, by Types 2020 & 2033
- Table 34: Global EV Adhesives Volume K Forecast, by Types 2020 & 2033
- Table 35: Global EV Adhesives Revenue billion Forecast, by Country 2020 & 2033
- Table 36: Global EV Adhesives Volume K Forecast, by Country 2020 & 2033
- Table 37: United Kingdom EV Adhesives Revenue (billion) Forecast, by Application 2020 & 2033
- Table 38: United Kingdom EV Adhesives Volume (K) Forecast, by Application 2020 & 2033
- Table 39: Germany EV Adhesives Revenue (billion) Forecast, by Application 2020 & 2033
- Table 40: Germany EV Adhesives Volume (K) Forecast, by Application 2020 & 2033
- Table 41: France EV Adhesives Revenue (billion) Forecast, by Application 2020 & 2033
- Table 42: France EV Adhesives Volume (K) Forecast, by Application 2020 & 2033
- Table 43: Italy EV Adhesives Revenue (billion) Forecast, by Application 2020 & 2033
- Table 44: Italy EV Adhesives Volume (K) Forecast, by Application 2020 & 2033
- Table 45: Spain EV Adhesives Revenue (billion) Forecast, by Application 2020 & 2033
- Table 46: Spain EV Adhesives Volume (K) Forecast, by Application 2020 & 2033
- Table 47: Russia EV Adhesives Revenue (billion) Forecast, by Application 2020 & 2033
- Table 48: Russia EV Adhesives Volume (K) Forecast, by Application 2020 & 2033
- Table 49: Benelux EV Adhesives Revenue (billion) Forecast, by Application 2020 & 2033
- Table 50: Benelux EV Adhesives Volume (K) Forecast, by Application 2020 & 2033
- Table 51: Nordics EV Adhesives Revenue (billion) Forecast, by Application 2020 & 2033
- Table 52: Nordics EV Adhesives Volume (K) Forecast, by Application 2020 & 2033
- Table 53: Rest of Europe EV Adhesives Revenue (billion) Forecast, by Application 2020 & 2033
- Table 54: Rest of Europe EV Adhesives Volume (K) Forecast, by Application 2020 & 2033
- Table 55: Global EV Adhesives Revenue billion Forecast, by Application 2020 & 2033
- Table 56: Global EV Adhesives Volume K Forecast, by Application 2020 & 2033
- Table 57: Global EV Adhesives Revenue billion Forecast, by Types 2020 & 2033
- Table 58: Global EV Adhesives Volume K Forecast, by Types 2020 & 2033
- Table 59: Global EV Adhesives Revenue billion Forecast, by Country 2020 & 2033
- Table 60: Global EV Adhesives Volume K Forecast, by Country 2020 & 2033
- Table 61: Turkey EV Adhesives Revenue (billion) Forecast, by Application 2020 & 2033
- Table 62: Turkey EV Adhesives Volume (K) Forecast, by Application 2020 & 2033
- Table 63: Israel EV Adhesives Revenue (billion) Forecast, by Application 2020 & 2033
- Table 64: Israel EV Adhesives Volume (K) Forecast, by Application 2020 & 2033
- Table 65: GCC EV Adhesives Revenue (billion) Forecast, by Application 2020 & 2033
- Table 66: GCC EV Adhesives Volume (K) Forecast, by Application 2020 & 2033
- Table 67: North Africa EV Adhesives Revenue (billion) Forecast, by Application 2020 & 2033
- Table 68: North Africa EV Adhesives Volume (K) Forecast, by Application 2020 & 2033
- Table 69: South Africa EV Adhesives Revenue (billion) Forecast, by Application 2020 & 2033
- Table 70: South Africa EV Adhesives Volume (K) Forecast, by Application 2020 & 2033
- Table 71: Rest of Middle East & Africa EV Adhesives Revenue (billion) Forecast, by Application 2020 & 2033
- Table 72: Rest of Middle East & Africa EV Adhesives Volume (K) Forecast, by Application 2020 & 2033
- Table 73: Global EV Adhesives Revenue billion Forecast, by Application 2020 & 2033
- Table 74: Global EV Adhesives Volume K Forecast, by Application 2020 & 2033
- Table 75: Global EV Adhesives Revenue billion Forecast, by Types 2020 & 2033
- Table 76: Global EV Adhesives Volume K Forecast, by Types 2020 & 2033
- Table 77: Global EV Adhesives Revenue billion Forecast, by Country 2020 & 2033
- Table 78: Global EV Adhesives Volume K Forecast, by Country 2020 & 2033
- Table 79: China EV Adhesives Revenue (billion) Forecast, by Application 2020 & 2033
- Table 80: China EV Adhesives Volume (K) Forecast, by Application 2020 & 2033
- Table 81: India EV Adhesives Revenue (billion) Forecast, by Application 2020 & 2033
- Table 82: India EV Adhesives Volume (K) Forecast, by Application 2020 & 2033
- Table 83: Japan EV Adhesives Revenue (billion) Forecast, by Application 2020 & 2033
- Table 84: Japan EV Adhesives Volume (K) Forecast, by Application 2020 & 2033
- Table 85: South Korea EV Adhesives Revenue (billion) Forecast, by Application 2020 & 2033
- Table 86: South Korea EV Adhesives Volume (K) Forecast, by Application 2020 & 2033
- Table 87: ASEAN EV Adhesives Revenue (billion) Forecast, by Application 2020 & 2033
- Table 88: ASEAN EV Adhesives Volume (K) Forecast, by Application 2020 & 2033
- Table 89: Oceania EV Adhesives Revenue (billion) Forecast, by Application 2020 & 2033
- Table 90: Oceania EV Adhesives Volume (K) Forecast, by Application 2020 & 2033
- Table 91: Rest of Asia Pacific EV Adhesives Revenue (billion) Forecast, by Application 2020 & 2033
- Table 92: Rest of Asia Pacific EV Adhesives Volume (K) Forecast, by Application 2020 & 2033
Frequently Asked Questions
1. What is the projected Compound Annual Growth Rate (CAGR) of the EV Adhesives?
The projected CAGR is approximately 5.8%.
2. Which companies are prominent players in the EV Adhesives?
Key companies in the market include Dow, Henkel, Sika, 3M, Parker Hannifin, Huntsman, DuPont, PPG, H.B. Fuller, Arkema, Wacker Chemie, Hubei Huitian New Materials.
3. What are the main segments of the EV Adhesives?
The market segments include Application, Types.
4. Can you provide details about the market size?
The market size is estimated to be USD 4.8 billion as of 2022.
5. What are some drivers contributing to market growth?
N/A
6. What are the notable trends driving market growth?
N/A
7. Are there any restraints impacting market growth?
N/A
8. Can you provide examples of recent developments in the market?
N/A
9. What pricing options are available for accessing the report?
Pricing options include single-user, multi-user, and enterprise licenses priced at USD 4350.00, USD 6525.00, and USD 8700.00 respectively.
10. Is the market size provided in terms of value or volume?
The market size is provided in terms of value, measured in billion and volume, measured in K.
11. Are there any specific market keywords associated with the report?
Yes, the market keyword associated with the report is "EV Adhesives," which aids in identifying and referencing the specific market segment covered.
12. How do I determine which pricing option suits my needs best?
The pricing options vary based on user requirements and access needs. Individual users may opt for single-user licenses, while businesses requiring broader access may choose multi-user or enterprise licenses for cost-effective access to the report.
13. Are there any additional resources or data provided in the EV Adhesives report?
While the report offers comprehensive insights, it's advisable to review the specific contents or supplementary materials provided to ascertain if additional resources or data are available.
14. How can I stay updated on further developments or reports in the EV Adhesives?
To stay informed about further developments, trends, and reports in the EV Adhesives, consider subscribing to industry newsletters, following relevant companies and organizations, or regularly checking reputable industry news sources and publications.
Methodology
Step 1 - Identification of Relevant Samples Size from Population Database


Step 2 - Approaches for Defining Global Market Size (Value, Volume* & Price*)

Note*: In applicable scenarios
Step 3 - Data Sources
Primary Research
- Web Analytics
- Survey Reports
- Research Institute
- Latest Research Reports
- Opinion Leaders
Secondary Research
- Annual Reports
- White Paper
- Latest Press Release
- Industry Association
- Paid Database
- Investor Presentations

Step 4 - Data Triangulation
Involves using different sources of information in order to increase the validity of a study
These sources are likely to be stakeholders in a program - participants, other researchers, program staff, other community members, and so on.
Then we put all data in single framework & apply various statistical tools to find out the dynamic on the market.
During the analysis stage, feedback from the stakeholder groups would be compared to determine areas of agreement as well as areas of divergence