

Key Insights
The global float glass market, valued at $42.7 billion in 2025, is projected for substantial expansion with a Compound Annual Growth Rate (CAGR) of 4.53% from 2025 to 2033. Key growth drivers include the rapidly expanding global construction sector, particularly in urbanizing developing economies. Increasing demand for energy-efficient buildings is accelerating the adoption of specialized energy-saving glass. Technological advancements in self-cleaning, tinted, and patterned glass are meeting diverse architectural and aesthetic needs. The automotive industry's rising vehicle production and integration of advanced safety features also contribute to market growth. The burgeoning solar energy sector, with growing demand for solar glass panels, presents a significant emerging opportunity. Challenges include volatile raw material prices and stringent environmental regulations.
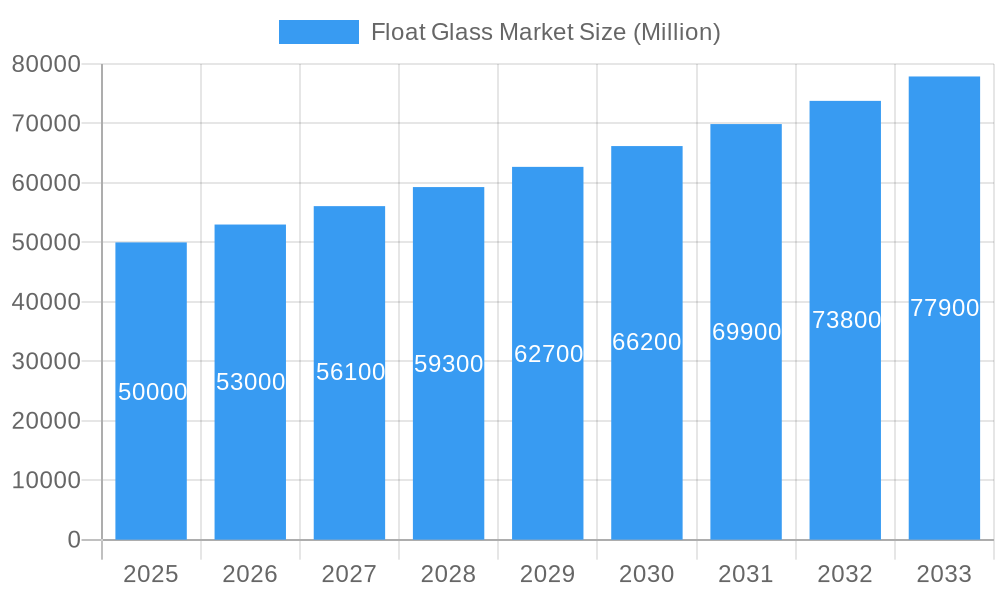
Float Glass Market Market Size (In Billion)
The building and construction segment leads market applications, followed by the automotive sector. Sand and soda ash are dominant raw materials. Clear float glass holds the largest market share by type, though demand for specialized variants like tinted and patterned glass is rising. Geographically, the Asia-Pacific region, led by China and India, is expected to experience the most rapid growth due to extensive infrastructure development. North America and Europe offer stable growth and maintain significant market share through established construction industries and technological innovation. The competitive landscape features a mix of multinational corporations and regional players, fostering innovation and price competition. Sustained growth in key applications and ongoing technological advancements will drive future market expansion. Effective raw material cost management and environmental compliance are crucial for sustainable growth.
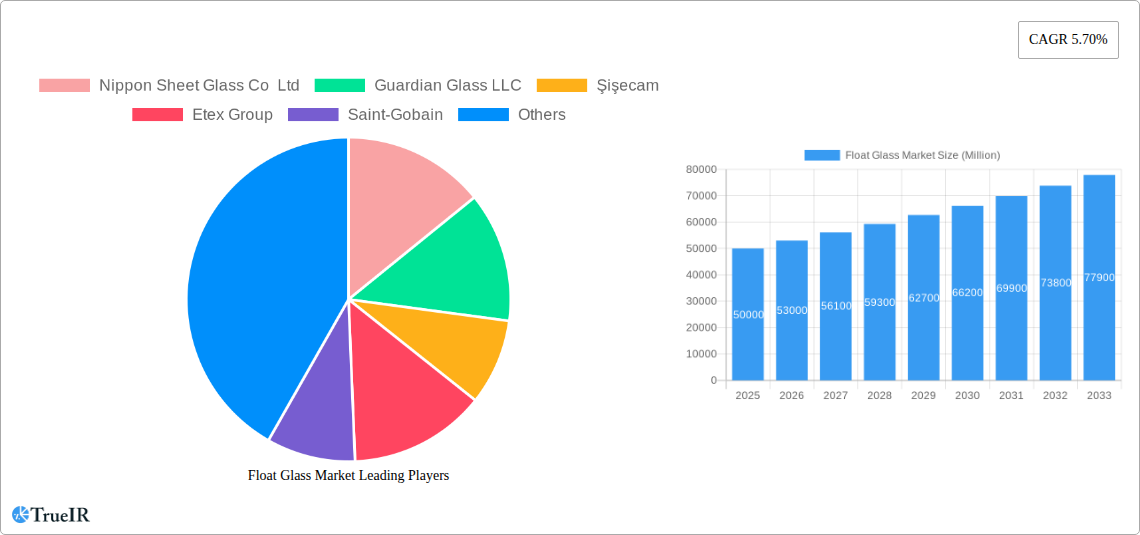
Float Glass Market Company Market Share
This comprehensive report analyzes the global float glass market, covering market size, trends, competitive dynamics, and future projections from 2019 to 2033. Utilizing extensive research and data, it provides actionable insights for industry professionals, investors, and decision-makers. The study period covers 2019-2033, with 2025 as the base year. The forecast period is 2025-2033, with historical data from 2019-2024.
Float Glass Market Structure & Competitive Landscape
The float glass market exhibits a moderately concentrated structure, with several key players commanding significant market share. The Herfindahl-Hirschman Index (HHI) for the market is estimated at xx, indicating a moderately consolidated landscape. This concentration is influenced by high capital expenditures required for float glass manufacturing facilities and the existence of significant barriers to entry.
Key factors shaping the competitive landscape include:
- Innovation drivers: Continuous advancements in glass technology, such as the development of energy-efficient and self-cleaning glass, are driving competition and shaping product differentiation.
- Regulatory impacts: Stringent environmental regulations impacting raw material sourcing and manufacturing processes influence operational costs and sustainability initiatives across the industry.
- Product substitutes: Materials like plastics and other advanced materials pose a competitive threat, particularly in niche applications.
- End-user segmentation: The market is segmented across several key applications (building and construction, automotive, solar energy, etc.) with varying growth rates and competitive dynamics. The building and construction segment is the largest, accounting for approximately xx Million in revenue in 2024.
- M&A Trends: The float glass industry has witnessed significant merger and acquisition (M&A) activity in recent years. The total value of M&A transactions in the period 2019-2024 is estimated to be xx Million, driven by strategic consolidation and expansion efforts by major players. Examples include CNG's acquisition of the Orda facility in Kazakhstan.
Float Glass Market Trends & Opportunities
The global float glass market is projected to experience robust growth during the forecast period (2025-2033), driven by several key factors. The market size is estimated to reach xx Million by 2033, exhibiting a Compound Annual Growth Rate (CAGR) of xx%. This growth is fueled by the burgeoning construction industry, particularly in developing economies, coupled with increasing demand for energy-efficient and technologically advanced glass products in the automotive and solar energy sectors. Market penetration rates for specific glass types, such as energy-efficient glass, are steadily increasing, reflecting a shift towards sustainable building practices and higher consumer demand. Technological advancements, like the development of self-cleaning and anti-reflective glass, are opening new market avenues. The increasing adoption of smart buildings and growing awareness of the importance of sustainable building materials are further propelling growth. However, competitive intensity remains a key factor, with established players and new entrants vying for market share. Price fluctuations in raw materials represent a potential challenge, alongside the need for continued innovation to meet evolving consumer expectations.
Dominant Markets & Segments in Float Glass Market
The Asia-Pacific region dominates the global float glass market, accounting for approximately xx% of total revenue in 2024, followed by North America and Europe. Within this, China remains the largest national market, driven by robust infrastructure development and rapid urbanization.
Key growth drivers in dominant segments:
- Raw Materials: Sand remains the primary raw material, with demand largely driven by the overall float glass production volume. Limestone and soda ash are also crucial, with their availability and pricing impacting overall market dynamics.
- Type: Clear float glass maintains its dominance across all applications. However, segments like tinted, patterned, and energy-efficient glass are experiencing faster growth rates due to specific aesthetic and functional requirements.
- Application: The building and construction sector is the leading application segment, owing to significant growth in infrastructure projects globally. The automotive and solar energy sectors are also emerging as key drivers, driven by increasing vehicle production and renewable energy initiatives respectively.
Growth Drivers by Region:
- Asia-Pacific: Rapid urbanization, infrastructure development, and rising disposable incomes are significantly boosting demand in this region.
- North America: Ongoing residential and commercial construction activities, coupled with government initiatives promoting energy efficiency, are fuelling growth.
- Europe: While mature, the market witnesses steady growth, driven by renovation projects and focus on sustainable building practices.
Float Glass Market Product Analysis
Float glass product innovation focuses on enhanced functionality and improved energy efficiency. Advancements in coatings, such as self-cleaning and low-emissivity coatings, are enhancing product value and expanding applications. This includes the development of specialized glass for automotive applications, offering better sound insulation and thermal control, and high-performance glass for solar panels. These innovations provide clear competitive advantages, particularly in terms of cost-effectiveness and operational efficiency.
Key Drivers, Barriers & Challenges in Float Glass Market
Key Drivers:
- Technological advancements in glass production and coating technologies.
- Increased demand from construction and automotive industries.
- Growing adoption of renewable energy technologies (solar).
- Government policies promoting energy efficiency and sustainable building practices.
Key Challenges and Restraints:
- Fluctuations in raw material prices (sand, soda ash, etc.).
- Stringent environmental regulations impacting manufacturing processes and waste management.
- Intense competition from established players and new market entrants.
- Supply chain disruptions impacting raw material availability and logistics. These disruptions have led to an estimated xx% increase in production costs in 2022.
Growth Drivers in the Float Glass Market
Technological advancements in glass production, especially in energy efficiency and enhanced features like self-cleaning capabilities, represent a significant driver. The rise of the construction industry, especially in emerging economies, coupled with government initiatives promoting sustainable building practices, fuels market expansion.
Challenges Impacting Float Glass Market Growth
Raw material price volatility poses a significant challenge. Stringent environmental regulations necessitate investment in cleaner production technologies, increasing operational costs. Intense competition from both established players and emerging competitors creates pressure on pricing and profitability.
Key Players Shaping the Float Glass Market Market
- Nippon Sheet Glass Co Ltd
- Guardian Glass LLC
- Şişecam
- Etex Group
- Saint-Gobain
- Cardinal Glass Industries Inc
- Xinyi Glass Holdings Limited
- PT Mulia Industrindo Tbk
- China Luoyang Float Glass Group Co Ltd
- Kibing Group
- China Glass Holdings Limited
- Taiwan Glass Ind Corp
- AGC Inc
- BG
- Press Glass Holding SA
- SCHOTT AG
Significant Float Glass Market Industry Milestones
- January 2022: China Glass Holdings Limited (CNG) acquired the Orda float glass manufacturing facility in Kazakhstan, aiming to create a state-of-the-art facility.
- April 2022: AGC Glass Europe partnered with E.ON for a joint project on waste heat recovery and green power production at its Seingbouse plant, enhancing sustainability.
- September 2022: SCHOTT partnered with Emirates Glass LLC to enhance Middle Eastern architecture through advanced glass solutions.
Future Outlook for Float Glass Market Market
The float glass market is poised for continued growth, driven by ongoing urbanization, infrastructure development, and the increasing adoption of sustainable building practices. Strategic opportunities exist in developing innovative glass solutions for specialized applications, such as advanced automotive glass and high-performance solar glass. The market's future success hinges on continued technological innovation, efficient resource management, and adaptation to evolving regulatory landscapes.
Float Glass Market Segmentation
-
1. Type
- 1.1. Clear
- 1.2. Tinted
- 1.3. Patterned
- 1.4. Wired
- 1.5. Extra Clear/Low Ferrous Floated Glass
-
2. Application
- 2.1. Building and Construction
- 2.2. Automotive
- 2.3. Solar Glass
- 2.4. Other Applications
Float Glass Market Segmentation By Geography
-
1. Asia Pacific
- 1.1. China
- 1.2. India
- 1.3. Japan
- 1.4. South Korea
- 1.5. Vietnam
- 1.6. Thailand
- 1.7. Indonesia
- 1.8. Malaysia
- 1.9. Rest of Asia Pacific
-
2. North America
- 2.1. United States
- 2.2. Canada
- 2.3. Mexico
-
3. Europe
- 3.1. Germany
- 3.2. United Kingdom
- 3.3. France
- 3.4. Italy
- 3.5. Russia
- 3.6. NORDIC
- 3.7. Turkey
- 3.8. Spain
- 3.9. Rest of Europe
-
4. South America
- 4.1. Brazil
- 4.2. Colombia
- 4.3. Argentina
- 4.4. Rest of South America
-
5. Middle East and Africa
- 5.1. Saudi Arabia
- 5.2. Nigeria
- 5.3. Qatar
- 5.4. United Arab Emirates
- 5.5. Egypt
- 5.6. South Africa
- 5.7. Rest of Middle East and Africa
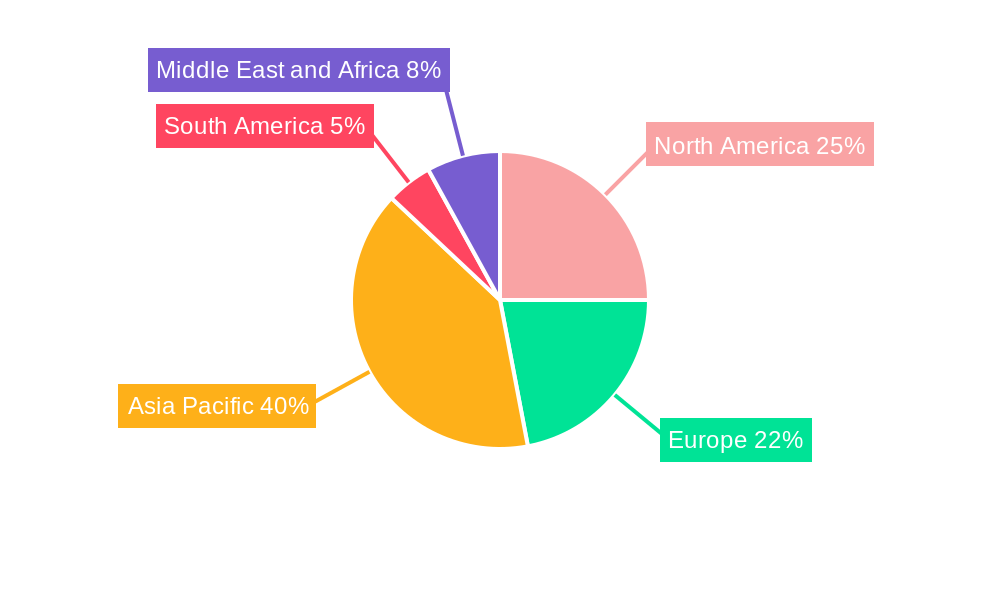
Float Glass Market Regional Market Share
Geographic Coverage of Float Glass Market
Float Glass Market REPORT HIGHLIGHTS
| Aspects | Details |
|---|---|
| Study Period | 2020-2034 |
| Base Year | 2025 |
| Estimated Year | 2026 |
| Forecast Period | 2026-2034 |
| Historical Period | 2020-2025 |
| Growth Rate | CAGR of 4.53% from 2020-2034 |
| Segmentation |
|
Table of Contents
- 1. Introduction
- 1.1. Research Scope
- 1.2. Market Segmentation
- 1.3. Research Objective
- 1.4. Definitions and Assumptions
- 2. Executive Summary
- 2.1. Market Snapshot
- 3. Market Dynamics
- 3.1. Market Drivers
- 3.2. Market Restrains
- 3.3. Market Trends
- 3.4. Market Opportunities
- 4. Market Factor Analysis
- 4.1. Porters Five Forces
- 4.1.1. Bargaining Power of Suppliers
- 4.1.2. Bargaining Power of Buyers
- 4.1.3. Threat of New Entrants
- 4.1.4. Threat of Substitutes
- 4.1.5. Competitive Rivalry
- 4.2. PESTEL analysis
- 4.3. BCG Analysis
- 4.3.1. Stars (High Growth, High Market Share)
- 4.3.2. Cash Cows (Low Growth, High Market Share)
- 4.3.3. Question Mark (High Growth, Low Market Share)
- 4.3.4. Dogs (Low Growth, Low Market Share)
- 4.4. Ansoff Matrix Analysis
- 4.5. Supply Chain Analysis
- 4.6. Regulatory Landscape
- 4.7. Current Market Potential and Opportunity Assessment (TAM–SAM–SOM Framework)
- 4.8. TIR Analyst Note
- 4.1. Porters Five Forces
- 5. Market Analysis, Insights and Forecast 2021-2033
- 5.1. Market Analysis, Insights and Forecast - by Type
- 5.1.1. Clear
- 5.1.2. Tinted
- 5.1.3. Patterned
- 5.1.4. Wired
- 5.1.5. Extra Clear/Low Ferrous Floated Glass
- 5.2. Market Analysis, Insights and Forecast - by Application
- 5.2.1. Building and Construction
- 5.2.2. Automotive
- 5.2.3. Solar Glass
- 5.2.4. Other Applications
- 5.3. Market Analysis, Insights and Forecast - by Region
- 5.3.1. Asia Pacific
- 5.3.2. North America
- 5.3.3. Europe
- 5.3.4. South America
- 5.3.5. Middle East and Africa
- 5.1. Market Analysis, Insights and Forecast - by Type
- 6. Global Float Glass Market Analysis, Insights and Forecast, 2021-2033
- 6.1. Market Analysis, Insights and Forecast - by Type
- 6.1.1. Clear
- 6.1.2. Tinted
- 6.1.3. Patterned
- 6.1.4. Wired
- 6.1.5. Extra Clear/Low Ferrous Floated Glass
- 6.2. Market Analysis, Insights and Forecast - by Application
- 6.2.1. Building and Construction
- 6.2.2. Automotive
- 6.2.3. Solar Glass
- 6.2.4. Other Applications
- 6.1. Market Analysis, Insights and Forecast - by Type
- 7. Asia Pacific Float Glass Market Analysis, Insights and Forecast, 2020-2032
- 7.1. Market Analysis, Insights and Forecast - by Type
- 7.1.1. Clear
- 7.1.2. Tinted
- 7.1.3. Patterned
- 7.1.4. Wired
- 7.1.5. Extra Clear/Low Ferrous Floated Glass
- 7.2. Market Analysis, Insights and Forecast - by Application
- 7.2.1. Building and Construction
- 7.2.2. Automotive
- 7.2.3. Solar Glass
- 7.2.4. Other Applications
- 7.1. Market Analysis, Insights and Forecast - by Type
- 8. North America Float Glass Market Analysis, Insights and Forecast, 2020-2032
- 8.1. Market Analysis, Insights and Forecast - by Type
- 8.1.1. Clear
- 8.1.2. Tinted
- 8.1.3. Patterned
- 8.1.4. Wired
- 8.1.5. Extra Clear/Low Ferrous Floated Glass
- 8.2. Market Analysis, Insights and Forecast - by Application
- 8.2.1. Building and Construction
- 8.2.2. Automotive
- 8.2.3. Solar Glass
- 8.2.4. Other Applications
- 8.1. Market Analysis, Insights and Forecast - by Type
- 9. Europe Float Glass Market Analysis, Insights and Forecast, 2020-2032
- 9.1. Market Analysis, Insights and Forecast - by Type
- 9.1.1. Clear
- 9.1.2. Tinted
- 9.1.3. Patterned
- 9.1.4. Wired
- 9.1.5. Extra Clear/Low Ferrous Floated Glass
- 9.2. Market Analysis, Insights and Forecast - by Application
- 9.2.1. Building and Construction
- 9.2.2. Automotive
- 9.2.3. Solar Glass
- 9.2.4. Other Applications
- 9.1. Market Analysis, Insights and Forecast - by Type
- 10. South America Float Glass Market Analysis, Insights and Forecast, 2020-2032
- 10.1. Market Analysis, Insights and Forecast - by Type
- 10.1.1. Clear
- 10.1.2. Tinted
- 10.1.3. Patterned
- 10.1.4. Wired
- 10.1.5. Extra Clear/Low Ferrous Floated Glass
- 10.2. Market Analysis, Insights and Forecast - by Application
- 10.2.1. Building and Construction
- 10.2.2. Automotive
- 10.2.3. Solar Glass
- 10.2.4. Other Applications
- 10.1. Market Analysis, Insights and Forecast - by Type
- 11. Middle East and Africa Float Glass Market Analysis, Insights and Forecast, 2020-2032
- 11.1. Market Analysis, Insights and Forecast - by Type
- 11.1.1. Clear
- 11.1.2. Tinted
- 11.1.3. Patterned
- 11.1.4. Wired
- 11.1.5. Extra Clear/Low Ferrous Floated Glass
- 11.2. Market Analysis, Insights and Forecast - by Application
- 11.2.1. Building and Construction
- 11.2.2. Automotive
- 11.2.3. Solar Glass
- 11.2.4. Other Applications
- 11.1. Market Analysis, Insights and Forecast - by Type
- 12. Competitive Analysis
- 12.1. Company Profiles
- 12.1.1 Nippon Sheet Glass Co Ltd
- 12.1.1.1. Company Overview
- 12.1.1.2. Products
- 12.1.1.3. Company Financials
- 12.1.1.4. SWOT Analysis
- 12.1.2 Guardian Glass LLC
- 12.1.2.1. Company Overview
- 12.1.2.2. Products
- 12.1.2.3. Company Financials
- 12.1.2.4. SWOT Analysis
- 12.1.3 Şişecam
- 12.1.3.1. Company Overview
- 12.1.3.2. Products
- 12.1.3.3. Company Financials
- 12.1.3.4. SWOT Analysis
- 12.1.4 Etex Group
- 12.1.4.1. Company Overview
- 12.1.4.2. Products
- 12.1.4.3. Company Financials
- 12.1.4.4. SWOT Analysis
- 12.1.5 Saint-Gobain
- 12.1.5.1. Company Overview
- 12.1.5.2. Products
- 12.1.5.3. Company Financials
- 12.1.5.4. SWOT Analysis
- 12.1.6 Cardinal Glass Industries Inc
- 12.1.6.1. Company Overview
- 12.1.6.2. Products
- 12.1.6.3. Company Financials
- 12.1.6.4. SWOT Analysis
- 12.1.7 Xinyi Glass Holdings Limited*List Not Exhaustive
- 12.1.7.1. Company Overview
- 12.1.7.2. Products
- 12.1.7.3. Company Financials
- 12.1.7.4. SWOT Analysis
- 12.1.8 PT Mulia Industrindo Tbk
- 12.1.8.1. Company Overview
- 12.1.8.2. Products
- 12.1.8.3. Company Financials
- 12.1.8.4. SWOT Analysis
- 12.1.9 China Luoyang Float Glass Group Co Ltd
- 12.1.9.1. Company Overview
- 12.1.9.2. Products
- 12.1.9.3. Company Financials
- 12.1.9.4. SWOT Analysis
- 12.1.10 Kibing Group
- 12.1.10.1. Company Overview
- 12.1.10.2. Products
- 12.1.10.3. Company Financials
- 12.1.10.4. SWOT Analysis
- 12.1.11 China Glass Holdings Limited
- 12.1.11.1. Company Overview
- 12.1.11.2. Products
- 12.1.11.3. Company Financials
- 12.1.11.4. SWOT Analysis
- 12.1.12 Taiwan Glass Ind Corp
- 12.1.12.1. Company Overview
- 12.1.12.2. Products
- 12.1.12.3. Company Financials
- 12.1.12.4. SWOT Analysis
- 12.1.13 AGC Inc
- 12.1.13.1. Company Overview
- 12.1.13.2. Products
- 12.1.13.3. Company Financials
- 12.1.13.4. SWOT Analysis
- 12.1.14 BG
- 12.1.14.1. Company Overview
- 12.1.14.2. Products
- 12.1.14.3. Company Financials
- 12.1.14.4. SWOT Analysis
- 12.1.15 Press Glass Holding SA
- 12.1.15.1. Company Overview
- 12.1.15.2. Products
- 12.1.15.3. Company Financials
- 12.1.15.4. SWOT Analysis
- 12.1.16 SCHOTT AG
- 12.1.16.1. Company Overview
- 12.1.16.2. Products
- 12.1.16.3. Company Financials
- 12.1.16.4. SWOT Analysis
- 12.1.1 Nippon Sheet Glass Co Ltd
- 12.2. Market Entropy
- 12.2.1 Company's Key Areas Served
- 12.2.2 Recent Developments
- 12.3. Company Market Share Analysis 2025
- 12.3.1 Top 5 Companies Market Share Analysis
- 12.3.2 Top 3 Companies Market Share Analysis
- 12.4. List of Potential Customers
- 13. Research Methodology
List of Figures
- Figure 1: Global Float Glass Market Revenue Breakdown (billion, %) by Region 2025 & 2033
- Figure 2: Global Float Glass Market Volume Breakdown (Million, %) by Region 2025 & 2033
- Figure 3: Asia Pacific Float Glass Market Revenue (billion), by Type 2025 & 2033
- Figure 4: Asia Pacific Float Glass Market Volume (Million), by Type 2025 & 2033
- Figure 5: Asia Pacific Float Glass Market Revenue Share (%), by Type 2025 & 2033
- Figure 6: Asia Pacific Float Glass Market Volume Share (%), by Type 2025 & 2033
- Figure 7: Asia Pacific Float Glass Market Revenue (billion), by Application 2025 & 2033
- Figure 8: Asia Pacific Float Glass Market Volume (Million), by Application 2025 & 2033
- Figure 9: Asia Pacific Float Glass Market Revenue Share (%), by Application 2025 & 2033
- Figure 10: Asia Pacific Float Glass Market Volume Share (%), by Application 2025 & 2033
- Figure 11: Asia Pacific Float Glass Market Revenue (billion), by Country 2025 & 2033
- Figure 12: Asia Pacific Float Glass Market Volume (Million), by Country 2025 & 2033
- Figure 13: Asia Pacific Float Glass Market Revenue Share (%), by Country 2025 & 2033
- Figure 14: Asia Pacific Float Glass Market Volume Share (%), by Country 2025 & 2033
- Figure 15: North America Float Glass Market Revenue (billion), by Type 2025 & 2033
- Figure 16: North America Float Glass Market Volume (Million), by Type 2025 & 2033
- Figure 17: North America Float Glass Market Revenue Share (%), by Type 2025 & 2033
- Figure 18: North America Float Glass Market Volume Share (%), by Type 2025 & 2033
- Figure 19: North America Float Glass Market Revenue (billion), by Application 2025 & 2033
- Figure 20: North America Float Glass Market Volume (Million), by Application 2025 & 2033
- Figure 21: North America Float Glass Market Revenue Share (%), by Application 2025 & 2033
- Figure 22: North America Float Glass Market Volume Share (%), by Application 2025 & 2033
- Figure 23: North America Float Glass Market Revenue (billion), by Country 2025 & 2033
- Figure 24: North America Float Glass Market Volume (Million), by Country 2025 & 2033
- Figure 25: North America Float Glass Market Revenue Share (%), by Country 2025 & 2033
- Figure 26: North America Float Glass Market Volume Share (%), by Country 2025 & 2033
- Figure 27: Europe Float Glass Market Revenue (billion), by Type 2025 & 2033
- Figure 28: Europe Float Glass Market Volume (Million), by Type 2025 & 2033
- Figure 29: Europe Float Glass Market Revenue Share (%), by Type 2025 & 2033
- Figure 30: Europe Float Glass Market Volume Share (%), by Type 2025 & 2033
- Figure 31: Europe Float Glass Market Revenue (billion), by Application 2025 & 2033
- Figure 32: Europe Float Glass Market Volume (Million), by Application 2025 & 2033
- Figure 33: Europe Float Glass Market Revenue Share (%), by Application 2025 & 2033
- Figure 34: Europe Float Glass Market Volume Share (%), by Application 2025 & 2033
- Figure 35: Europe Float Glass Market Revenue (billion), by Country 2025 & 2033
- Figure 36: Europe Float Glass Market Volume (Million), by Country 2025 & 2033
- Figure 37: Europe Float Glass Market Revenue Share (%), by Country 2025 & 2033
- Figure 38: Europe Float Glass Market Volume Share (%), by Country 2025 & 2033
- Figure 39: South America Float Glass Market Revenue (billion), by Type 2025 & 2033
- Figure 40: South America Float Glass Market Volume (Million), by Type 2025 & 2033
- Figure 41: South America Float Glass Market Revenue Share (%), by Type 2025 & 2033
- Figure 42: South America Float Glass Market Volume Share (%), by Type 2025 & 2033
- Figure 43: South America Float Glass Market Revenue (billion), by Application 2025 & 2033
- Figure 44: South America Float Glass Market Volume (Million), by Application 2025 & 2033
- Figure 45: South America Float Glass Market Revenue Share (%), by Application 2025 & 2033
- Figure 46: South America Float Glass Market Volume Share (%), by Application 2025 & 2033
- Figure 47: South America Float Glass Market Revenue (billion), by Country 2025 & 2033
- Figure 48: South America Float Glass Market Volume (Million), by Country 2025 & 2033
- Figure 49: South America Float Glass Market Revenue Share (%), by Country 2025 & 2033
- Figure 50: South America Float Glass Market Volume Share (%), by Country 2025 & 2033
- Figure 51: Middle East and Africa Float Glass Market Revenue (billion), by Type 2025 & 2033
- Figure 52: Middle East and Africa Float Glass Market Volume (Million), by Type 2025 & 2033
- Figure 53: Middle East and Africa Float Glass Market Revenue Share (%), by Type 2025 & 2033
- Figure 54: Middle East and Africa Float Glass Market Volume Share (%), by Type 2025 & 2033
- Figure 55: Middle East and Africa Float Glass Market Revenue (billion), by Application 2025 & 2033
- Figure 56: Middle East and Africa Float Glass Market Volume (Million), by Application 2025 & 2033
- Figure 57: Middle East and Africa Float Glass Market Revenue Share (%), by Application 2025 & 2033
- Figure 58: Middle East and Africa Float Glass Market Volume Share (%), by Application 2025 & 2033
- Figure 59: Middle East and Africa Float Glass Market Revenue (billion), by Country 2025 & 2033
- Figure 60: Middle East and Africa Float Glass Market Volume (Million), by Country 2025 & 2033
- Figure 61: Middle East and Africa Float Glass Market Revenue Share (%), by Country 2025 & 2033
- Figure 62: Middle East and Africa Float Glass Market Volume Share (%), by Country 2025 & 2033
List of Tables
- Table 1: Global Float Glass Market Revenue billion Forecast, by Type 2020 & 2033
- Table 2: Global Float Glass Market Volume Million Forecast, by Type 2020 & 2033
- Table 3: Global Float Glass Market Revenue billion Forecast, by Application 2020 & 2033
- Table 4: Global Float Glass Market Volume Million Forecast, by Application 2020 & 2033
- Table 5: Global Float Glass Market Revenue billion Forecast, by Region 2020 & 2033
- Table 6: Global Float Glass Market Volume Million Forecast, by Region 2020 & 2033
- Table 7: Global Float Glass Market Revenue billion Forecast, by Type 2020 & 2033
- Table 8: Global Float Glass Market Volume Million Forecast, by Type 2020 & 2033
- Table 9: Global Float Glass Market Revenue billion Forecast, by Application 2020 & 2033
- Table 10: Global Float Glass Market Volume Million Forecast, by Application 2020 & 2033
- Table 11: Global Float Glass Market Revenue billion Forecast, by Country 2020 & 2033
- Table 12: Global Float Glass Market Volume Million Forecast, by Country 2020 & 2033
- Table 13: China Float Glass Market Revenue (billion) Forecast, by Application 2020 & 2033
- Table 14: China Float Glass Market Volume (Million) Forecast, by Application 2020 & 2033
- Table 15: India Float Glass Market Revenue (billion) Forecast, by Application 2020 & 2033
- Table 16: India Float Glass Market Volume (Million) Forecast, by Application 2020 & 2033
- Table 17: Japan Float Glass Market Revenue (billion) Forecast, by Application 2020 & 2033
- Table 18: Japan Float Glass Market Volume (Million) Forecast, by Application 2020 & 2033
- Table 19: South Korea Float Glass Market Revenue (billion) Forecast, by Application 2020 & 2033
- Table 20: South Korea Float Glass Market Volume (Million) Forecast, by Application 2020 & 2033
- Table 21: Vietnam Float Glass Market Revenue (billion) Forecast, by Application 2020 & 2033
- Table 22: Vietnam Float Glass Market Volume (Million) Forecast, by Application 2020 & 2033
- Table 23: Thailand Float Glass Market Revenue (billion) Forecast, by Application 2020 & 2033
- Table 24: Thailand Float Glass Market Volume (Million) Forecast, by Application 2020 & 2033
- Table 25: Indonesia Float Glass Market Revenue (billion) Forecast, by Application 2020 & 2033
- Table 26: Indonesia Float Glass Market Volume (Million) Forecast, by Application 2020 & 2033
- Table 27: Malaysia Float Glass Market Revenue (billion) Forecast, by Application 2020 & 2033
- Table 28: Malaysia Float Glass Market Volume (Million) Forecast, by Application 2020 & 2033
- Table 29: Rest of Asia Pacific Float Glass Market Revenue (billion) Forecast, by Application 2020 & 2033
- Table 30: Rest of Asia Pacific Float Glass Market Volume (Million) Forecast, by Application 2020 & 2033
- Table 31: Global Float Glass Market Revenue billion Forecast, by Type 2020 & 2033
- Table 32: Global Float Glass Market Volume Million Forecast, by Type 2020 & 2033
- Table 33: Global Float Glass Market Revenue billion Forecast, by Application 2020 & 2033
- Table 34: Global Float Glass Market Volume Million Forecast, by Application 2020 & 2033
- Table 35: Global Float Glass Market Revenue billion Forecast, by Country 2020 & 2033
- Table 36: Global Float Glass Market Volume Million Forecast, by Country 2020 & 2033
- Table 37: United States Float Glass Market Revenue (billion) Forecast, by Application 2020 & 2033
- Table 38: United States Float Glass Market Volume (Million) Forecast, by Application 2020 & 2033
- Table 39: Canada Float Glass Market Revenue (billion) Forecast, by Application 2020 & 2033
- Table 40: Canada Float Glass Market Volume (Million) Forecast, by Application 2020 & 2033
- Table 41: Mexico Float Glass Market Revenue (billion) Forecast, by Application 2020 & 2033
- Table 42: Mexico Float Glass Market Volume (Million) Forecast, by Application 2020 & 2033
- Table 43: Global Float Glass Market Revenue billion Forecast, by Type 2020 & 2033
- Table 44: Global Float Glass Market Volume Million Forecast, by Type 2020 & 2033
- Table 45: Global Float Glass Market Revenue billion Forecast, by Application 2020 & 2033
- Table 46: Global Float Glass Market Volume Million Forecast, by Application 2020 & 2033
- Table 47: Global Float Glass Market Revenue billion Forecast, by Country 2020 & 2033
- Table 48: Global Float Glass Market Volume Million Forecast, by Country 2020 & 2033
- Table 49: Germany Float Glass Market Revenue (billion) Forecast, by Application 2020 & 2033
- Table 50: Germany Float Glass Market Volume (Million) Forecast, by Application 2020 & 2033
- Table 51: United Kingdom Float Glass Market Revenue (billion) Forecast, by Application 2020 & 2033
- Table 52: United Kingdom Float Glass Market Volume (Million) Forecast, by Application 2020 & 2033
- Table 53: France Float Glass Market Revenue (billion) Forecast, by Application 2020 & 2033
- Table 54: France Float Glass Market Volume (Million) Forecast, by Application 2020 & 2033
- Table 55: Italy Float Glass Market Revenue (billion) Forecast, by Application 2020 & 2033
- Table 56: Italy Float Glass Market Volume (Million) Forecast, by Application 2020 & 2033
- Table 57: Russia Float Glass Market Revenue (billion) Forecast, by Application 2020 & 2033
- Table 58: Russia Float Glass Market Volume (Million) Forecast, by Application 2020 & 2033
- Table 59: NORDIC Float Glass Market Revenue (billion) Forecast, by Application 2020 & 2033
- Table 60: NORDIC Float Glass Market Volume (Million) Forecast, by Application 2020 & 2033
- Table 61: Turkey Float Glass Market Revenue (billion) Forecast, by Application 2020 & 2033
- Table 62: Turkey Float Glass Market Volume (Million) Forecast, by Application 2020 & 2033
- Table 63: Spain Float Glass Market Revenue (billion) Forecast, by Application 2020 & 2033
- Table 64: Spain Float Glass Market Volume (Million) Forecast, by Application 2020 & 2033
- Table 65: Rest of Europe Float Glass Market Revenue (billion) Forecast, by Application 2020 & 2033
- Table 66: Rest of Europe Float Glass Market Volume (Million) Forecast, by Application 2020 & 2033
- Table 67: Global Float Glass Market Revenue billion Forecast, by Type 2020 & 2033
- Table 68: Global Float Glass Market Volume Million Forecast, by Type 2020 & 2033
- Table 69: Global Float Glass Market Revenue billion Forecast, by Application 2020 & 2033
- Table 70: Global Float Glass Market Volume Million Forecast, by Application 2020 & 2033
- Table 71: Global Float Glass Market Revenue billion Forecast, by Country 2020 & 2033
- Table 72: Global Float Glass Market Volume Million Forecast, by Country 2020 & 2033
- Table 73: Brazil Float Glass Market Revenue (billion) Forecast, by Application 2020 & 2033
- Table 74: Brazil Float Glass Market Volume (Million) Forecast, by Application 2020 & 2033
- Table 75: Colombia Float Glass Market Revenue (billion) Forecast, by Application 2020 & 2033
- Table 76: Colombia Float Glass Market Volume (Million) Forecast, by Application 2020 & 2033
- Table 77: Argentina Float Glass Market Revenue (billion) Forecast, by Application 2020 & 2033
- Table 78: Argentina Float Glass Market Volume (Million) Forecast, by Application 2020 & 2033
- Table 79: Rest of South America Float Glass Market Revenue (billion) Forecast, by Application 2020 & 2033
- Table 80: Rest of South America Float Glass Market Volume (Million) Forecast, by Application 2020 & 2033
- Table 81: Global Float Glass Market Revenue billion Forecast, by Type 2020 & 2033
- Table 82: Global Float Glass Market Volume Million Forecast, by Type 2020 & 2033
- Table 83: Global Float Glass Market Revenue billion Forecast, by Application 2020 & 2033
- Table 84: Global Float Glass Market Volume Million Forecast, by Application 2020 & 2033
- Table 85: Global Float Glass Market Revenue billion Forecast, by Country 2020 & 2033
- Table 86: Global Float Glass Market Volume Million Forecast, by Country 2020 & 2033
- Table 87: Saudi Arabia Float Glass Market Revenue (billion) Forecast, by Application 2020 & 2033
- Table 88: Saudi Arabia Float Glass Market Volume (Million) Forecast, by Application 2020 & 2033
- Table 89: Nigeria Float Glass Market Revenue (billion) Forecast, by Application 2020 & 2033
- Table 90: Nigeria Float Glass Market Volume (Million) Forecast, by Application 2020 & 2033
- Table 91: Qatar Float Glass Market Revenue (billion) Forecast, by Application 2020 & 2033
- Table 92: Qatar Float Glass Market Volume (Million) Forecast, by Application 2020 & 2033
- Table 93: United Arab Emirates Float Glass Market Revenue (billion) Forecast, by Application 2020 & 2033
- Table 94: United Arab Emirates Float Glass Market Volume (Million) Forecast, by Application 2020 & 2033
- Table 95: Egypt Float Glass Market Revenue (billion) Forecast, by Application 2020 & 2033
- Table 96: Egypt Float Glass Market Volume (Million) Forecast, by Application 2020 & 2033
- Table 97: South Africa Float Glass Market Revenue (billion) Forecast, by Application 2020 & 2033
- Table 98: South Africa Float Glass Market Volume (Million) Forecast, by Application 2020 & 2033
- Table 99: Rest of Middle East and Africa Float Glass Market Revenue (billion) Forecast, by Application 2020 & 2033
- Table 100: Rest of Middle East and Africa Float Glass Market Volume (Million) Forecast, by Application 2020 & 2033
Frequently Asked Questions
1. What is the projected Compound Annual Growth Rate (CAGR) of the Float Glass Market?
The projected CAGR is approximately 4.53%.
2. Which companies are prominent players in the Float Glass Market?
Key companies in the market include Nippon Sheet Glass Co Ltd, Guardian Glass LLC, Şişecam, Etex Group, Saint-Gobain, Cardinal Glass Industries Inc, Xinyi Glass Holdings Limited*List Not Exhaustive, PT Mulia Industrindo Tbk, China Luoyang Float Glass Group Co Ltd, Kibing Group, China Glass Holdings Limited, Taiwan Glass Ind Corp, AGC Inc, BG, Press Glass Holding SA, SCHOTT AG.
3. What are the main segments of the Float Glass Market?
The market segments include Type, Application.
4. Can you provide details about the market size?
The market size is estimated to be USD 42.7 billion as of 2022.
5. What are some drivers contributing to market growth?
Increasing Demand from the Construction Industry; Recovering Automotive Industry.
6. What are the notable trends driving market growth?
Increasing Demand from Building and Construction Segments.
7. Are there any restraints impacting market growth?
; Unfavorable Conditions Arising Due to COVID-19 Outbreak; High Manufacturing Costs.
8. Can you provide examples of recent developments in the market?
September 2022: SCHOTT partnered with Emirates Glass LLC, one of the leading processors of architectural flat glass in the Middle East, to lift up Middle Eastern architecture.
9. What pricing options are available for accessing the report?
Pricing options include single-user, multi-user, and enterprise licenses priced at USD 4750, USD 5250, and USD 8750 respectively.
10. Is the market size provided in terms of value or volume?
The market size is provided in terms of value, measured in billion and volume, measured in Million.
11. Are there any specific market keywords associated with the report?
Yes, the market keyword associated with the report is "Float Glass Market," which aids in identifying and referencing the specific market segment covered.
12. How do I determine which pricing option suits my needs best?
The pricing options vary based on user requirements and access needs. Individual users may opt for single-user licenses, while businesses requiring broader access may choose multi-user or enterprise licenses for cost-effective access to the report.
13. Are there any additional resources or data provided in the Float Glass Market report?
While the report offers comprehensive insights, it's advisable to review the specific contents or supplementary materials provided to ascertain if additional resources or data are available.
14. How can I stay updated on further developments or reports in the Float Glass Market?
To stay informed about further developments, trends, and reports in the Float Glass Market, consider subscribing to industry newsletters, following relevant companies and organizations, or regularly checking reputable industry news sources and publications.
Methodology
Step 1 - Identification of Relevant Samples Size from Population Database


Step 2 - Approaches for Defining Global Market Size (Value, Volume* & Price*)

Note*: In applicable scenarios
Step 3 - Data Sources
Primary Research
- Web Analytics
- Survey Reports
- Research Institute
- Latest Research Reports
- Opinion Leaders
Secondary Research
- Annual Reports
- White Paper
- Latest Press Release
- Industry Association
- Paid Database
- Investor Presentations

Step 4 - Data Triangulation
Involves using different sources of information in order to increase the validity of a study
These sources are likely to be stakeholders in a program - participants, other researchers, program staff, other community members, and so on.
Then we put all data in single framework & apply various statistical tools to find out the dynamic on the market.
During the analysis stage, feedback from the stakeholder groups would be compared to determine areas of agreement as well as areas of divergence