

Key Insights
The global Fluid Transfer Hose market is poised for significant expansion, projected to reach USD 30.9 billion in 2025, with a robust Compound Annual Growth Rate (CAGR) of 4.7% anticipated throughout the forecast period of 2025-2033. This growth trajectory is underpinned by a confluence of dynamic market drivers. The burgeoning automotive industry, with its increasing demand for efficient and reliable fluid transfer systems in both conventional and electric vehicles, is a primary contributor. Advancements in material science and engineering are leading to the development of hoses with enhanced durability, chemical resistance, and temperature tolerance, thereby expanding their applicability in diverse sectors like the chemical and medical industries. The food and beverage sector also presents substantial opportunities, driven by stringent hygiene standards and the need for safe and sterile fluid transfer solutions. Furthermore, the continuous innovation in hose manufacturing technologies, coupled with the development of specialized hoses for unique industrial applications, fuels this upward market trend.
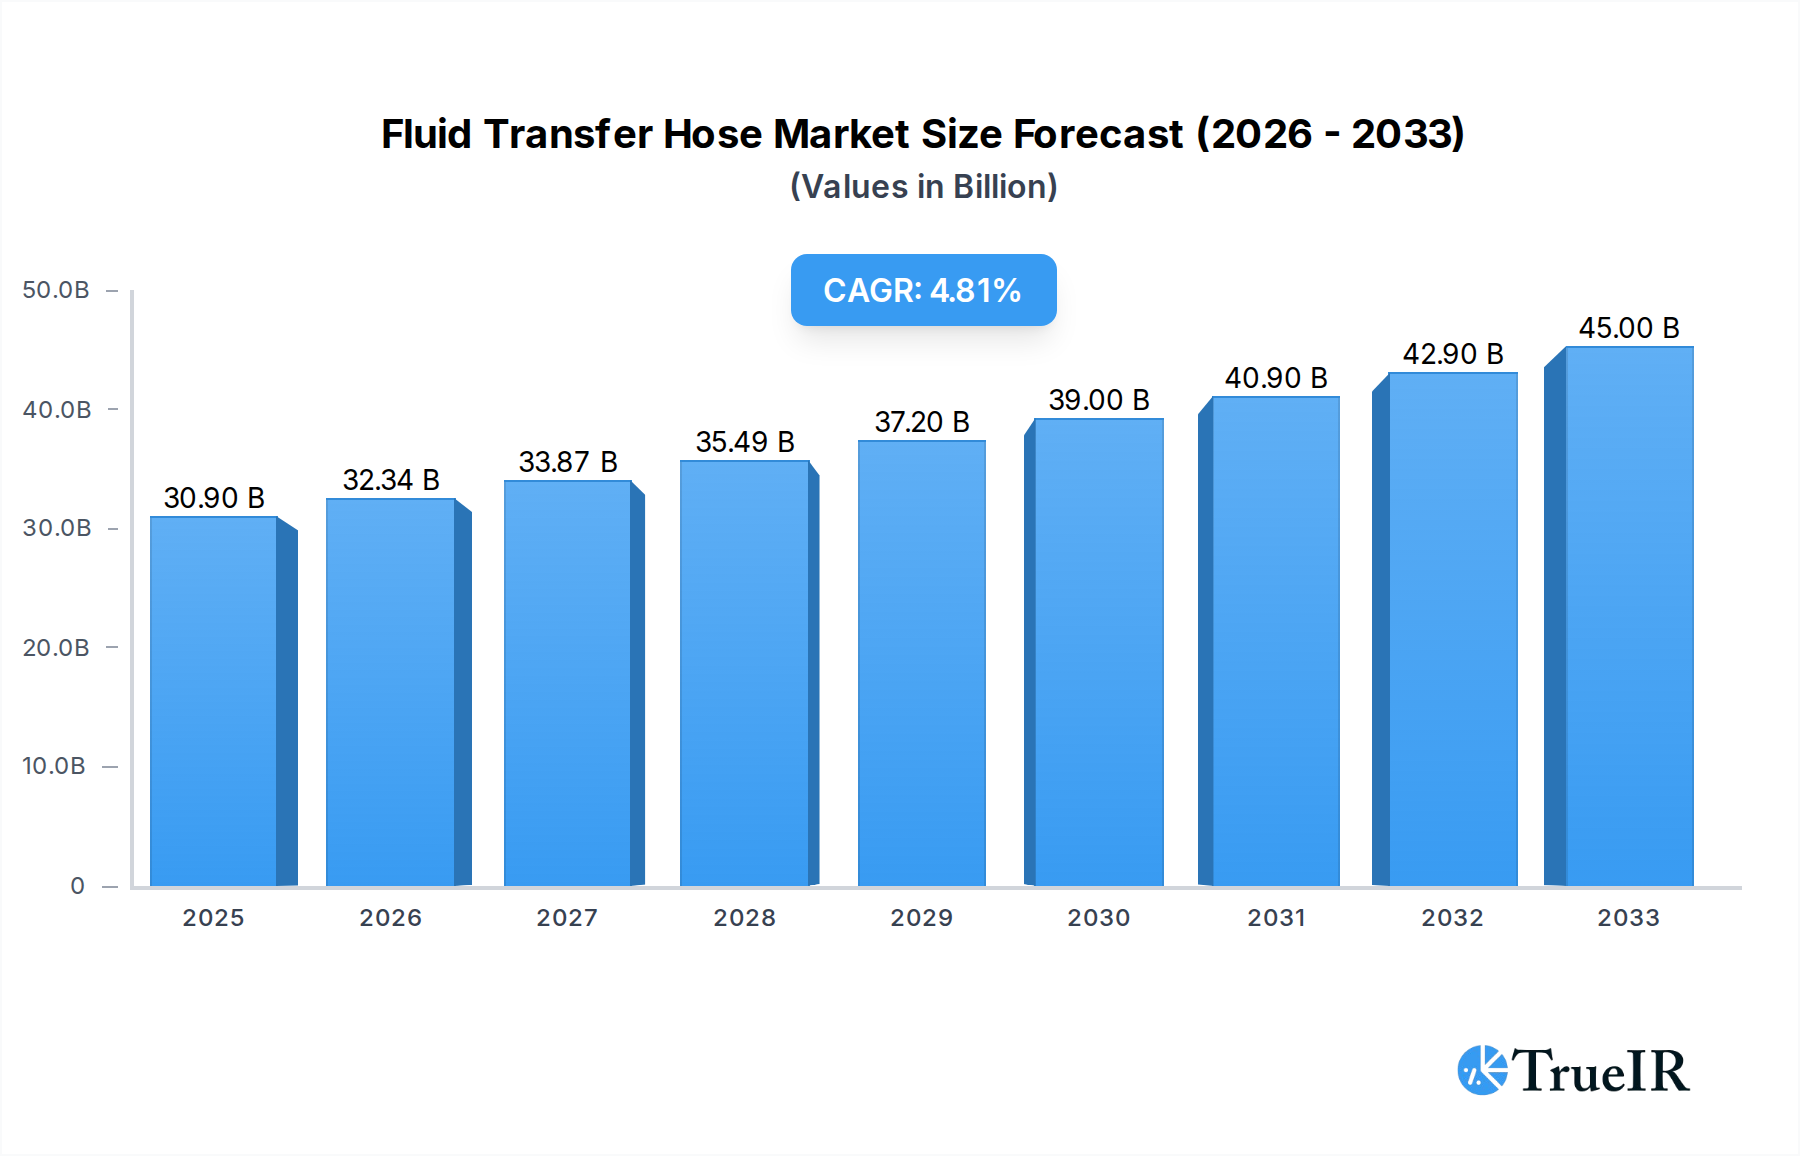
Fluid Transfer Hose Market Size (In Billion)
While the market exhibits strong growth potential, certain restraints warrant consideration. The fluctuating prices of raw materials, particularly polymers and specialized metals, can impact profit margins and influence pricing strategies for manufacturers. Intense competition among a fragmented market of global and regional players necessitates continuous innovation and cost optimization to maintain market share. Moreover, the increasing adoption of integrated fluid management systems and potential for direct fluid injection in certain applications could, in a limited capacity, pose a challenge to traditional hose solutions. However, these challenges are expected to be largely offset by the persistent demand for flexible, adaptable, and cost-effective fluid transfer solutions across a wide spectrum of industries, ensuring a positive outlook for the Fluid Transfer Hose market.

Fluid Transfer Hose Company Market Share
Fluid Transfer Hose Market Structure & Competitive Landscape
The global fluid transfer hose market exhibits a moderate to high level of fragmentation, with a mix of large multinational corporations and smaller, specialized manufacturers. Key innovation drivers include the demand for enhanced durability, chemical resistance, and improved flow efficiency across various industries. Regulatory impacts, such as stringent environmental standards for material composition and safety certifications, are shaping product development and market entry. The presence of readily available product substitutes, like rigid piping systems and specialized tubing, necessitates continuous innovation in hose technology to maintain market share. End-user segmentation is critical, with distinct requirements arising from the Automobile Industry, Chemical Industry, Food Industry, and Medical Industry. Merger and acquisition (M&A) activity is moderately active as larger players seek to expand their product portfolios, geographical reach, and technological capabilities. For instance, the market has witnessed an estimated 5 billion USD in M&A volumes over the historical period. Concentration ratios remain dynamic, with the top five players estimated to hold approximately 35% of the market share in the base year of 2025. This landscape underscores a competitive environment driven by technological advancement and strategic consolidation.
Fluid Transfer Hose Market Trends & Opportunities
The fluid transfer hose market is poised for substantial expansion, driven by a confluence of technological advancements, evolving industry demands, and burgeoning global infrastructure development. The projected market size is anticipated to reach an impressive 500 billion USD by 2033, showcasing a robust Compound Annual Growth Rate (CAGR) of approximately 6.2% from the base year of 2025. This sustained growth is largely attributable to the increasing industrialization across developing economies and the continuous innovation in material science and manufacturing processes that enhance hose performance and longevity. A significant trend is the growing demand for hoses capable of handling extreme temperatures, high pressures, and corrosive or abrasive fluids, particularly within the Chemical Industry and Oil & Gas sectors. Furthermore, the Automobile Industry's shift towards electrification and advanced engine technologies is creating new opportunities for specialized fluid transfer solutions for battery cooling, thermal management, and fuel systems. Consumer preferences are increasingly leaning towards lightweight, flexible, and environmentally friendly hose materials, prompting manufacturers to invest in research and development for sustainable alternatives. The Medical Industry presents a lucrative segment, with a rising need for high-purity, biocompatible hoses for drug delivery, dialysis, and laboratory applications. Technological shifts are evident in the adoption of advanced polymers, reinforced composites, and intelligent hose designs incorporating sensors for real-time monitoring of flow rate, pressure, and temperature. The competitive dynamics are characterized by intense R&D efforts, strategic partnerships, and a focus on providing customized solutions to meet specific application requirements. Market penetration rates are expected to rise as awareness of the benefits of advanced fluid transfer hoses increases across a wider range of industries. The forecast period from 2025 to 2033 is expected to be a period of significant innovation and market expansion, with opportunities arising from the development of smart hoses and the integration of IoT capabilities for predictive maintenance.
Dominant Markets & Segments in Fluid Transfer Hose
The Automobile Industry stands as a dominant market segment within the global fluid transfer hose landscape, driven by continuous innovation in vehicle design, powertrain evolution, and the burgeoning electric vehicle (EV) market. In the base year of 2025, this segment is projected to account for an estimated 120 billion USD in market value. Key growth drivers within the automotive sector include the increasing stringency of emission regulations, which necessitates more efficient and leak-proof fluid transfer systems for fuel, coolant, and exhaust gas recirculation. The rapid adoption of electric vehicles is also a significant catalyst, creating a demand for specialized hoses for battery thermal management, high-voltage cable insulation, and refrigerant circulation, representing a new frontier for innovation. The global automotive production volume, expected to reach 100 million units in 2025, directly correlates with the demand for fluid transfer hoses.
Within the Types of fluid transfer hoses, Non-metal Hose is anticipated to maintain its dominance, projected to capture an estimated 250 billion USD market share by 2033. This dominance is fueled by their inherent flexibility, lighter weight, and cost-effectiveness compared to metal alternatives. Advanced non-metal hoses, incorporating high-performance elastomers, thermoplastics, and reinforced fabrics, are increasingly being engineered to withstand extreme temperatures, aggressive chemicals, and high pressures, thereby expanding their applicability across diverse industrial sectors. The Chemical Industry, another major application segment, is projected to contribute significantly, with an estimated market value of 100 billion USD in 2025, due to the critical need for chemical-resistant and safe fluid conveyance solutions.
Conversely, Metal Hose continues to be a vital segment, particularly in high-temperature and high-pressure applications found in sectors like aerospace and heavy industrial machinery. However, its growth is more measured compared to non-metal hoses, with an estimated market size of 70 billion USD by 2033. The Food Industry represents a growing application segment, with an estimated market value of 50 billion USD in 2025, driven by increasing demand for hygienic, food-grade compliant hoses that ensure product safety and integrity. The Medical Industry, while smaller in absolute market size at an estimated 30 billion USD in 2025, exhibits high growth potential due to the stringent requirements for biocompatibility, sterility, and precision fluid handling in critical medical devices and procedures.
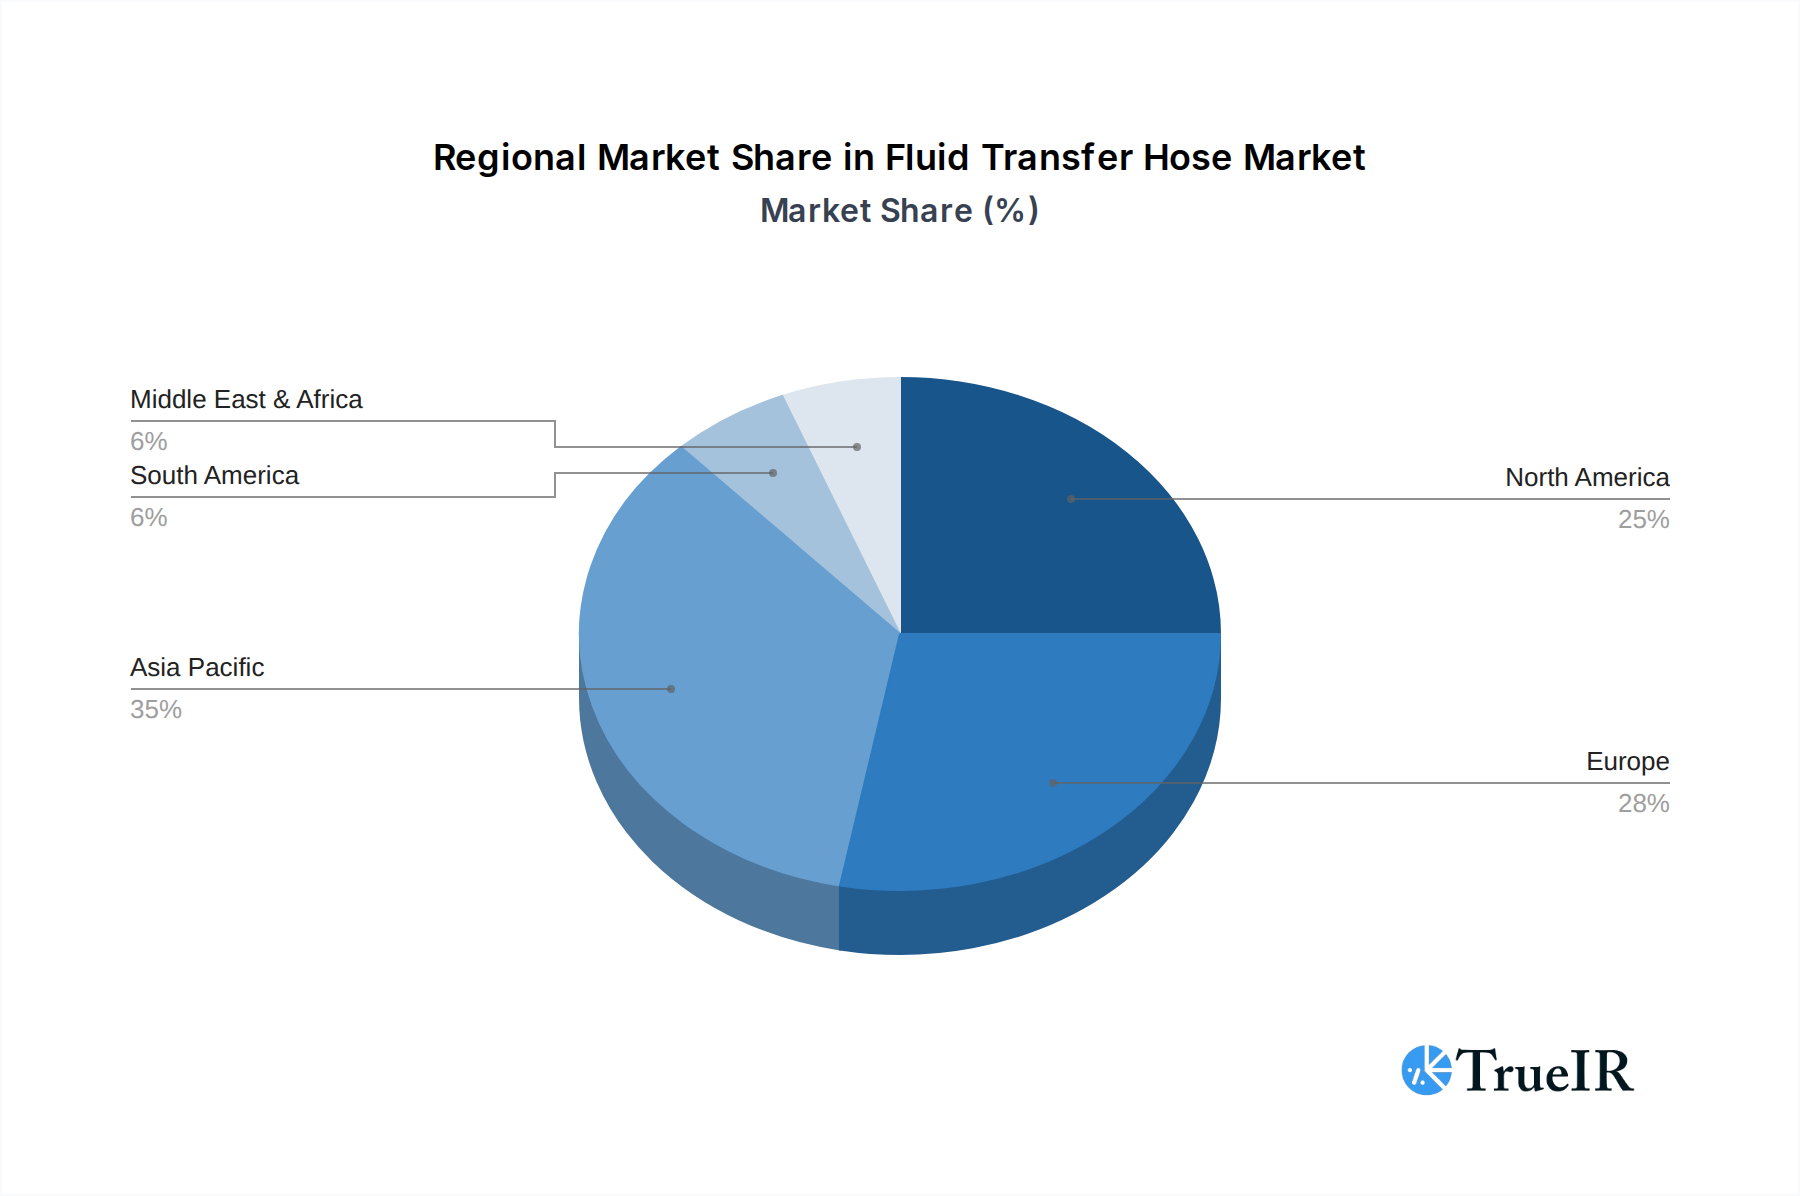
Geographically, North America and Europe currently lead in terms of market value due to established industrial bases and advanced technological adoption. However, the Asia-Pacific region is emerging as a significant growth engine, propelled by rapid industrialization, increasing automotive production, and expanding infrastructure projects.
Fluid Transfer Hose Product Analysis
The fluid transfer hose market is characterized by continuous product innovation, driven by the pursuit of enhanced performance, durability, and application-specific solutions. Key advancements include the development of multi-layer hoses with specialized inner linings for superior chemical resistance, such as PTFE and PFA, and outer covers for abrasion and environmental protection. Innovations in reinforcement materials, including high-strength aramid fibers and stainless-steel braiding, allow for increased pressure ratings and kink resistance. Furthermore, the integration of advanced polymers and elastomers enables hoses to operate across wider temperature ranges, from cryogenic to exceptionally high heat. These technological leaps are crucial for applications in the Automobile Industry's intricate engine and cooling systems, the Chemical Industry's hazardous material transport, the Food Industry's hygienic processing, and the Medical Industry's precision drug delivery. Competitive advantages are increasingly derived from factors such as customizability, ease of installation, and the development of smart hoses with integrated sensors for real-time monitoring and predictive maintenance, significantly improving operational efficiency and safety across all end-use sectors.
Key Drivers, Barriers & Challenges in Fluid Transfer Hose
Key Drivers: The fluid transfer hose market is propelled by several critical factors. Technological advancements in material science, leading to enhanced chemical resistance, higher temperature and pressure ratings, and improved flexibility, are paramount. The sustained growth of key end-user industries, including the Automobile Industry, Chemical Industry, and Medical Industry, directly fuels demand. Furthermore, increasing investments in infrastructure and industrial automation globally create a robust need for reliable fluid conveyance solutions. Stringent regulatory requirements for safety and environmental protection also drive the adoption of advanced, compliant hose technologies.
Barriers & Challenges: Despite the positive outlook, the market faces significant challenges. Supply chain disruptions, particularly concerning raw material availability and logistics, can lead to price volatility and production delays, impacting estimated market growth. Stringent and evolving regulatory landscapes across different regions present compliance hurdles and increased R&D costs. Intense competitive pressures from established players and emerging manufacturers can lead to price erosion and margin compression. The availability of cheaper, less sophisticated alternatives in certain applications also poses a restraint. Furthermore, the upfront cost of some high-performance hoses can be a barrier for smaller enterprises, limiting market penetration in price-sensitive segments.
Growth Drivers in the Fluid Transfer Hose Market
The fluid transfer hose market is experiencing robust growth driven by several interconnected factors. Technologically, the continuous innovation in polymer science and composite materials allows for the development of hoses with superior performance characteristics, including extreme temperature resistance, enhanced chemical inertness, and increased durability. Economically, the expanding industrial base in emerging economies, coupled with ongoing investments in infrastructure development across sectors like petrochemicals, pharmaceuticals, and automotive manufacturing, directly translates to a higher demand for fluid transfer solutions. Regulatory tailwinds, such as increasingly stringent safety and environmental standards, are compelling industries to upgrade to more advanced and reliable hose systems, further stimulating market expansion. The growing adoption of electric vehicles, for instance, is creating a substantial new demand for specialized cooling and power management hoses.
Challenges Impacting Fluid Transfer Hose Growth
Several challenges continue to impact the growth trajectory of the fluid transfer hose market. Regulatory complexities and varying compliance standards across different geographical regions can create significant hurdles for manufacturers seeking to expand globally, leading to increased costs and longer product development cycles. Supply chain vulnerabilities, including fluctuations in raw material prices and availability, particularly for specialized polymers and elastomers, can disrupt production and impact profitability. The highly competitive nature of the market, with numerous players vying for market share, often leads to price pressures and can limit investment in cutting-edge research and development for smaller enterprises. Additionally, the disposal of end-of-life hoses and the push towards more sustainable materials present ongoing environmental challenges and necessitate significant investment in recycling and biodegradable alternatives.
Key Players Shaping the Fluid Transfer Hose Market
- Delfingen
- Thermo Fisher Scientific
- Grayline Inc
- Junkosha
- Puresys
- Saint-Gobain
- Senior Flexonics
- RB Royal
- Orscheln
- Furukawa Electric
- Watson Marlow
- Ginho Group
- J.K. Organisation
- Cooper Standard
- SACRED
- Safran
Significant Fluid Transfer Hose Industry Milestones
- 2019: Increased adoption of advanced composite materials for high-pressure applications.
- 2020: Introduction of smart hoses with integrated sensors for real-time monitoring.
- 2021: Enhanced focus on sustainable and recyclable hose materials due to environmental regulations.
- 2022: Significant growth in demand for specialized hoses for electric vehicle thermal management systems.
- 2023: Major M&A activities aimed at expanding product portfolios and geographical reach.
- 2024: Advancements in antimicrobial hose technology for medical and food processing applications.
- 2025 (Base Year): Estimated market value of $XXX billion.
- 2026: Expected emergence of bio-based fluid transfer hoses.
- 2028: Widespread integration of IoT for predictive maintenance in industrial fluid transfer systems.
- 2030: Further specialization of hoses for extreme environments (e.g., deep-sea, space applications).
- 2033 (Forecast End Year): Projected market value of $500 billion.
Future Outlook for Fluid Transfer Hose Market
The future outlook for the fluid transfer hose market is exceptionally promising, fueled by ongoing technological innovation and expanding industrial applications. Strategic opportunities lie in the development of highly specialized hoses for niche sectors, such as renewable energy infrastructure and advanced aerospace components. The increasing demand for smart, connected hoses integrated with IoT capabilities for predictive maintenance and operational efficiency will be a key growth catalyst. Furthermore, the global push towards sustainability will drive the adoption of eco-friendly and recyclable hose materials, presenting significant avenues for market differentiation and growth. The burgeoning electric vehicle market and the continuous evolution of the medical and pharmaceutical industries will continue to be strong demand generators, ensuring a dynamic and expanding market in the years to come.
Fluid Transfer Hose Segmentation
-
1. Application
- 1.1. Automobile Industry
- 1.2. Chemical Industry
- 1.3. Food Industry
- 1.4. Medical Industry
-
2. Types
- 2.1. Metal Hose
- 2.2. Non-metal Hose
Fluid Transfer Hose Segmentation By Geography
-
1. North America
- 1.1. United States
- 1.2. Canada
- 1.3. Mexico
-
2. South America
- 2.1. Brazil
- 2.2. Argentina
- 2.3. Rest of South America
-
3. Europe
- 3.1. United Kingdom
- 3.2. Germany
- 3.3. France
- 3.4. Italy
- 3.5. Spain
- 3.6. Russia
- 3.7. Benelux
- 3.8. Nordics
- 3.9. Rest of Europe
-
4. Middle East & Africa
- 4.1. Turkey
- 4.2. Israel
- 4.3. GCC
- 4.4. North Africa
- 4.5. South Africa
- 4.6. Rest of Middle East & Africa
-
5. Asia Pacific
- 5.1. China
- 5.2. India
- 5.3. Japan
- 5.4. South Korea
- 5.5. ASEAN
- 5.6. Oceania
- 5.7. Rest of Asia Pacific
Fluid Transfer Hose Regional Market Share
Geographic Coverage of Fluid Transfer Hose
Fluid Transfer Hose REPORT HIGHLIGHTS
| Aspects | Details |
|---|---|
| Study Period | 2020-2034 |
| Base Year | 2025 |
| Estimated Year | 2026 |
| Forecast Period | 2026-2034 |
| Historical Period | 2020-2025 |
| Growth Rate | CAGR of 4.7% from 2020-2034 |
| Segmentation |
|
Table of Contents
- 1. Introduction
- 1.1. Research Scope
- 1.2. Market Segmentation
- 1.3. Research Methodology
- 1.4. Definitions and Assumptions
- 2. Executive Summary
- 2.1. Introduction
- 3. Market Dynamics
- 3.1. Introduction
- 3.2. Market Drivers
- 3.3. Market Restrains
- 3.4. Market Trends
- 4. Market Factor Analysis
- 4.1. Porters Five Forces
- 4.2. Supply/Value Chain
- 4.3. PESTEL analysis
- 4.4. Market Entropy
- 4.5. Patent/Trademark Analysis
- 5. Global Fluid Transfer Hose Analysis, Insights and Forecast, 2020-2032
- 5.1. Market Analysis, Insights and Forecast - by Application
- 5.1.1. Automobile Industry
- 5.1.2. Chemical Industry
- 5.1.3. Food Industry
- 5.1.4. Medical Industry
- 5.2. Market Analysis, Insights and Forecast - by Types
- 5.2.1. Metal Hose
- 5.2.2. Non-metal Hose
- 5.3. Market Analysis, Insights and Forecast - by Region
- 5.3.1. North America
- 5.3.2. South America
- 5.3.3. Europe
- 5.3.4. Middle East & Africa
- 5.3.5. Asia Pacific
- 5.1. Market Analysis, Insights and Forecast - by Application
- 6. North America Fluid Transfer Hose Analysis, Insights and Forecast, 2020-2032
- 6.1. Market Analysis, Insights and Forecast - by Application
- 6.1.1. Automobile Industry
- 6.1.2. Chemical Industry
- 6.1.3. Food Industry
- 6.1.4. Medical Industry
- 6.2. Market Analysis, Insights and Forecast - by Types
- 6.2.1. Metal Hose
- 6.2.2. Non-metal Hose
- 6.1. Market Analysis, Insights and Forecast - by Application
- 7. South America Fluid Transfer Hose Analysis, Insights and Forecast, 2020-2032
- 7.1. Market Analysis, Insights and Forecast - by Application
- 7.1.1. Automobile Industry
- 7.1.2. Chemical Industry
- 7.1.3. Food Industry
- 7.1.4. Medical Industry
- 7.2. Market Analysis, Insights and Forecast - by Types
- 7.2.1. Metal Hose
- 7.2.2. Non-metal Hose
- 7.1. Market Analysis, Insights and Forecast - by Application
- 8. Europe Fluid Transfer Hose Analysis, Insights and Forecast, 2020-2032
- 8.1. Market Analysis, Insights and Forecast - by Application
- 8.1.1. Automobile Industry
- 8.1.2. Chemical Industry
- 8.1.3. Food Industry
- 8.1.4. Medical Industry
- 8.2. Market Analysis, Insights and Forecast - by Types
- 8.2.1. Metal Hose
- 8.2.2. Non-metal Hose
- 8.1. Market Analysis, Insights and Forecast - by Application
- 9. Middle East & Africa Fluid Transfer Hose Analysis, Insights and Forecast, 2020-2032
- 9.1. Market Analysis, Insights and Forecast - by Application
- 9.1.1. Automobile Industry
- 9.1.2. Chemical Industry
- 9.1.3. Food Industry
- 9.1.4. Medical Industry
- 9.2. Market Analysis, Insights and Forecast - by Types
- 9.2.1. Metal Hose
- 9.2.2. Non-metal Hose
- 9.1. Market Analysis, Insights and Forecast - by Application
- 10. Asia Pacific Fluid Transfer Hose Analysis, Insights and Forecast, 2020-2032
- 10.1. Market Analysis, Insights and Forecast - by Application
- 10.1.1. Automobile Industry
- 10.1.2. Chemical Industry
- 10.1.3. Food Industry
- 10.1.4. Medical Industry
- 10.2. Market Analysis, Insights and Forecast - by Types
- 10.2.1. Metal Hose
- 10.2.2. Non-metal Hose
- 10.1. Market Analysis, Insights and Forecast - by Application
- 11. Competitive Analysis
- 11.1. Global Market Share Analysis 2025
- 11.2. Company Profiles
- 11.2.1 Delfingen
- 11.2.1.1. Overview
- 11.2.1.2. Products
- 11.2.1.3. SWOT Analysis
- 11.2.1.4. Recent Developments
- 11.2.1.5. Financials (Based on Availability)
- 11.2.2 Thermo Fisher Scientific
- 11.2.2.1. Overview
- 11.2.2.2. Products
- 11.2.2.3. SWOT Analysis
- 11.2.2.4. Recent Developments
- 11.2.2.5. Financials (Based on Availability)
- 11.2.3 Grayline Inc
- 11.2.3.1. Overview
- 11.2.3.2. Products
- 11.2.3.3. SWOT Analysis
- 11.2.3.4. Recent Developments
- 11.2.3.5. Financials (Based on Availability)
- 11.2.4 Junkosha
- 11.2.4.1. Overview
- 11.2.4.2. Products
- 11.2.4.3. SWOT Analysis
- 11.2.4.4. Recent Developments
- 11.2.4.5. Financials (Based on Availability)
- 11.2.5 Puresys
- 11.2.5.1. Overview
- 11.2.5.2. Products
- 11.2.5.3. SWOT Analysis
- 11.2.5.4. Recent Developments
- 11.2.5.5. Financials (Based on Availability)
- 11.2.6 Saint-Gobain
- 11.2.6.1. Overview
- 11.2.6.2. Products
- 11.2.6.3. SWOT Analysis
- 11.2.6.4. Recent Developments
- 11.2.6.5. Financials (Based on Availability)
- 11.2.7 Senior Flexonics
- 11.2.7.1. Overview
- 11.2.7.2. Products
- 11.2.7.3. SWOT Analysis
- 11.2.7.4. Recent Developments
- 11.2.7.5. Financials (Based on Availability)
- 11.2.8 RB Royal
- 11.2.8.1. Overview
- 11.2.8.2. Products
- 11.2.8.3. SWOT Analysis
- 11.2.8.4. Recent Developments
- 11.2.8.5. Financials (Based on Availability)
- 11.2.9 Orscheln
- 11.2.9.1. Overview
- 11.2.9.2. Products
- 11.2.9.3. SWOT Analysis
- 11.2.9.4. Recent Developments
- 11.2.9.5. Financials (Based on Availability)
- 11.2.10 Furukawa Electric
- 11.2.10.1. Overview
- 11.2.10.2. Products
- 11.2.10.3. SWOT Analysis
- 11.2.10.4. Recent Developments
- 11.2.10.5. Financials (Based on Availability)
- 11.2.11 Watson Marlow
- 11.2.11.1. Overview
- 11.2.11.2. Products
- 11.2.11.3. SWOT Analysis
- 11.2.11.4. Recent Developments
- 11.2.11.5. Financials (Based on Availability)
- 11.2.12 Ginho Group
- 11.2.12.1. Overview
- 11.2.12.2. Products
- 11.2.12.3. SWOT Analysis
- 11.2.12.4. Recent Developments
- 11.2.12.5. Financials (Based on Availability)
- 11.2.13 J.K. Organisation
- 11.2.13.1. Overview
- 11.2.13.2. Products
- 11.2.13.3. SWOT Analysis
- 11.2.13.4. Recent Developments
- 11.2.13.5. Financials (Based on Availability)
- 11.2.14 Cooper Standard
- 11.2.14.1. Overview
- 11.2.14.2. Products
- 11.2.14.3. SWOT Analysis
- 11.2.14.4. Recent Developments
- 11.2.14.5. Financials (Based on Availability)
- 11.2.15 SACRED
- 11.2.15.1. Overview
- 11.2.15.2. Products
- 11.2.15.3. SWOT Analysis
- 11.2.15.4. Recent Developments
- 11.2.15.5. Financials (Based on Availability)
- 11.2.16 Safran
- 11.2.16.1. Overview
- 11.2.16.2. Products
- 11.2.16.3. SWOT Analysis
- 11.2.16.4. Recent Developments
- 11.2.16.5. Financials (Based on Availability)
- 11.2.1 Delfingen
List of Figures
- Figure 1: Global Fluid Transfer Hose Revenue Breakdown (billion, %) by Region 2025 & 2033
- Figure 2: Global Fluid Transfer Hose Volume Breakdown (K, %) by Region 2025 & 2033
- Figure 3: North America Fluid Transfer Hose Revenue (billion), by Application 2025 & 2033
- Figure 4: North America Fluid Transfer Hose Volume (K), by Application 2025 & 2033
- Figure 5: North America Fluid Transfer Hose Revenue Share (%), by Application 2025 & 2033
- Figure 6: North America Fluid Transfer Hose Volume Share (%), by Application 2025 & 2033
- Figure 7: North America Fluid Transfer Hose Revenue (billion), by Types 2025 & 2033
- Figure 8: North America Fluid Transfer Hose Volume (K), by Types 2025 & 2033
- Figure 9: North America Fluid Transfer Hose Revenue Share (%), by Types 2025 & 2033
- Figure 10: North America Fluid Transfer Hose Volume Share (%), by Types 2025 & 2033
- Figure 11: North America Fluid Transfer Hose Revenue (billion), by Country 2025 & 2033
- Figure 12: North America Fluid Transfer Hose Volume (K), by Country 2025 & 2033
- Figure 13: North America Fluid Transfer Hose Revenue Share (%), by Country 2025 & 2033
- Figure 14: North America Fluid Transfer Hose Volume Share (%), by Country 2025 & 2033
- Figure 15: South America Fluid Transfer Hose Revenue (billion), by Application 2025 & 2033
- Figure 16: South America Fluid Transfer Hose Volume (K), by Application 2025 & 2033
- Figure 17: South America Fluid Transfer Hose Revenue Share (%), by Application 2025 & 2033
- Figure 18: South America Fluid Transfer Hose Volume Share (%), by Application 2025 & 2033
- Figure 19: South America Fluid Transfer Hose Revenue (billion), by Types 2025 & 2033
- Figure 20: South America Fluid Transfer Hose Volume (K), by Types 2025 & 2033
- Figure 21: South America Fluid Transfer Hose Revenue Share (%), by Types 2025 & 2033
- Figure 22: South America Fluid Transfer Hose Volume Share (%), by Types 2025 & 2033
- Figure 23: South America Fluid Transfer Hose Revenue (billion), by Country 2025 & 2033
- Figure 24: South America Fluid Transfer Hose Volume (K), by Country 2025 & 2033
- Figure 25: South America Fluid Transfer Hose Revenue Share (%), by Country 2025 & 2033
- Figure 26: South America Fluid Transfer Hose Volume Share (%), by Country 2025 & 2033
- Figure 27: Europe Fluid Transfer Hose Revenue (billion), by Application 2025 & 2033
- Figure 28: Europe Fluid Transfer Hose Volume (K), by Application 2025 & 2033
- Figure 29: Europe Fluid Transfer Hose Revenue Share (%), by Application 2025 & 2033
- Figure 30: Europe Fluid Transfer Hose Volume Share (%), by Application 2025 & 2033
- Figure 31: Europe Fluid Transfer Hose Revenue (billion), by Types 2025 & 2033
- Figure 32: Europe Fluid Transfer Hose Volume (K), by Types 2025 & 2033
- Figure 33: Europe Fluid Transfer Hose Revenue Share (%), by Types 2025 & 2033
- Figure 34: Europe Fluid Transfer Hose Volume Share (%), by Types 2025 & 2033
- Figure 35: Europe Fluid Transfer Hose Revenue (billion), by Country 2025 & 2033
- Figure 36: Europe Fluid Transfer Hose Volume (K), by Country 2025 & 2033
- Figure 37: Europe Fluid Transfer Hose Revenue Share (%), by Country 2025 & 2033
- Figure 38: Europe Fluid Transfer Hose Volume Share (%), by Country 2025 & 2033
- Figure 39: Middle East & Africa Fluid Transfer Hose Revenue (billion), by Application 2025 & 2033
- Figure 40: Middle East & Africa Fluid Transfer Hose Volume (K), by Application 2025 & 2033
- Figure 41: Middle East & Africa Fluid Transfer Hose Revenue Share (%), by Application 2025 & 2033
- Figure 42: Middle East & Africa Fluid Transfer Hose Volume Share (%), by Application 2025 & 2033
- Figure 43: Middle East & Africa Fluid Transfer Hose Revenue (billion), by Types 2025 & 2033
- Figure 44: Middle East & Africa Fluid Transfer Hose Volume (K), by Types 2025 & 2033
- Figure 45: Middle East & Africa Fluid Transfer Hose Revenue Share (%), by Types 2025 & 2033
- Figure 46: Middle East & Africa Fluid Transfer Hose Volume Share (%), by Types 2025 & 2033
- Figure 47: Middle East & Africa Fluid Transfer Hose Revenue (billion), by Country 2025 & 2033
- Figure 48: Middle East & Africa Fluid Transfer Hose Volume (K), by Country 2025 & 2033
- Figure 49: Middle East & Africa Fluid Transfer Hose Revenue Share (%), by Country 2025 & 2033
- Figure 50: Middle East & Africa Fluid Transfer Hose Volume Share (%), by Country 2025 & 2033
- Figure 51: Asia Pacific Fluid Transfer Hose Revenue (billion), by Application 2025 & 2033
- Figure 52: Asia Pacific Fluid Transfer Hose Volume (K), by Application 2025 & 2033
- Figure 53: Asia Pacific Fluid Transfer Hose Revenue Share (%), by Application 2025 & 2033
- Figure 54: Asia Pacific Fluid Transfer Hose Volume Share (%), by Application 2025 & 2033
- Figure 55: Asia Pacific Fluid Transfer Hose Revenue (billion), by Types 2025 & 2033
- Figure 56: Asia Pacific Fluid Transfer Hose Volume (K), by Types 2025 & 2033
- Figure 57: Asia Pacific Fluid Transfer Hose Revenue Share (%), by Types 2025 & 2033
- Figure 58: Asia Pacific Fluid Transfer Hose Volume Share (%), by Types 2025 & 2033
- Figure 59: Asia Pacific Fluid Transfer Hose Revenue (billion), by Country 2025 & 2033
- Figure 60: Asia Pacific Fluid Transfer Hose Volume (K), by Country 2025 & 2033
- Figure 61: Asia Pacific Fluid Transfer Hose Revenue Share (%), by Country 2025 & 2033
- Figure 62: Asia Pacific Fluid Transfer Hose Volume Share (%), by Country 2025 & 2033
List of Tables
- Table 1: Global Fluid Transfer Hose Revenue billion Forecast, by Application 2020 & 2033
- Table 2: Global Fluid Transfer Hose Volume K Forecast, by Application 2020 & 2033
- Table 3: Global Fluid Transfer Hose Revenue billion Forecast, by Types 2020 & 2033
- Table 4: Global Fluid Transfer Hose Volume K Forecast, by Types 2020 & 2033
- Table 5: Global Fluid Transfer Hose Revenue billion Forecast, by Region 2020 & 2033
- Table 6: Global Fluid Transfer Hose Volume K Forecast, by Region 2020 & 2033
- Table 7: Global Fluid Transfer Hose Revenue billion Forecast, by Application 2020 & 2033
- Table 8: Global Fluid Transfer Hose Volume K Forecast, by Application 2020 & 2033
- Table 9: Global Fluid Transfer Hose Revenue billion Forecast, by Types 2020 & 2033
- Table 10: Global Fluid Transfer Hose Volume K Forecast, by Types 2020 & 2033
- Table 11: Global Fluid Transfer Hose Revenue billion Forecast, by Country 2020 & 2033
- Table 12: Global Fluid Transfer Hose Volume K Forecast, by Country 2020 & 2033
- Table 13: United States Fluid Transfer Hose Revenue (billion) Forecast, by Application 2020 & 2033
- Table 14: United States Fluid Transfer Hose Volume (K) Forecast, by Application 2020 & 2033
- Table 15: Canada Fluid Transfer Hose Revenue (billion) Forecast, by Application 2020 & 2033
- Table 16: Canada Fluid Transfer Hose Volume (K) Forecast, by Application 2020 & 2033
- Table 17: Mexico Fluid Transfer Hose Revenue (billion) Forecast, by Application 2020 & 2033
- Table 18: Mexico Fluid Transfer Hose Volume (K) Forecast, by Application 2020 & 2033
- Table 19: Global Fluid Transfer Hose Revenue billion Forecast, by Application 2020 & 2033
- Table 20: Global Fluid Transfer Hose Volume K Forecast, by Application 2020 & 2033
- Table 21: Global Fluid Transfer Hose Revenue billion Forecast, by Types 2020 & 2033
- Table 22: Global Fluid Transfer Hose Volume K Forecast, by Types 2020 & 2033
- Table 23: Global Fluid Transfer Hose Revenue billion Forecast, by Country 2020 & 2033
- Table 24: Global Fluid Transfer Hose Volume K Forecast, by Country 2020 & 2033
- Table 25: Brazil Fluid Transfer Hose Revenue (billion) Forecast, by Application 2020 & 2033
- Table 26: Brazil Fluid Transfer Hose Volume (K) Forecast, by Application 2020 & 2033
- Table 27: Argentina Fluid Transfer Hose Revenue (billion) Forecast, by Application 2020 & 2033
- Table 28: Argentina Fluid Transfer Hose Volume (K) Forecast, by Application 2020 & 2033
- Table 29: Rest of South America Fluid Transfer Hose Revenue (billion) Forecast, by Application 2020 & 2033
- Table 30: Rest of South America Fluid Transfer Hose Volume (K) Forecast, by Application 2020 & 2033
- Table 31: Global Fluid Transfer Hose Revenue billion Forecast, by Application 2020 & 2033
- Table 32: Global Fluid Transfer Hose Volume K Forecast, by Application 2020 & 2033
- Table 33: Global Fluid Transfer Hose Revenue billion Forecast, by Types 2020 & 2033
- Table 34: Global Fluid Transfer Hose Volume K Forecast, by Types 2020 & 2033
- Table 35: Global Fluid Transfer Hose Revenue billion Forecast, by Country 2020 & 2033
- Table 36: Global Fluid Transfer Hose Volume K Forecast, by Country 2020 & 2033
- Table 37: United Kingdom Fluid Transfer Hose Revenue (billion) Forecast, by Application 2020 & 2033
- Table 38: United Kingdom Fluid Transfer Hose Volume (K) Forecast, by Application 2020 & 2033
- Table 39: Germany Fluid Transfer Hose Revenue (billion) Forecast, by Application 2020 & 2033
- Table 40: Germany Fluid Transfer Hose Volume (K) Forecast, by Application 2020 & 2033
- Table 41: France Fluid Transfer Hose Revenue (billion) Forecast, by Application 2020 & 2033
- Table 42: France Fluid Transfer Hose Volume (K) Forecast, by Application 2020 & 2033
- Table 43: Italy Fluid Transfer Hose Revenue (billion) Forecast, by Application 2020 & 2033
- Table 44: Italy Fluid Transfer Hose Volume (K) Forecast, by Application 2020 & 2033
- Table 45: Spain Fluid Transfer Hose Revenue (billion) Forecast, by Application 2020 & 2033
- Table 46: Spain Fluid Transfer Hose Volume (K) Forecast, by Application 2020 & 2033
- Table 47: Russia Fluid Transfer Hose Revenue (billion) Forecast, by Application 2020 & 2033
- Table 48: Russia Fluid Transfer Hose Volume (K) Forecast, by Application 2020 & 2033
- Table 49: Benelux Fluid Transfer Hose Revenue (billion) Forecast, by Application 2020 & 2033
- Table 50: Benelux Fluid Transfer Hose Volume (K) Forecast, by Application 2020 & 2033
- Table 51: Nordics Fluid Transfer Hose Revenue (billion) Forecast, by Application 2020 & 2033
- Table 52: Nordics Fluid Transfer Hose Volume (K) Forecast, by Application 2020 & 2033
- Table 53: Rest of Europe Fluid Transfer Hose Revenue (billion) Forecast, by Application 2020 & 2033
- Table 54: Rest of Europe Fluid Transfer Hose Volume (K) Forecast, by Application 2020 & 2033
- Table 55: Global Fluid Transfer Hose Revenue billion Forecast, by Application 2020 & 2033
- Table 56: Global Fluid Transfer Hose Volume K Forecast, by Application 2020 & 2033
- Table 57: Global Fluid Transfer Hose Revenue billion Forecast, by Types 2020 & 2033
- Table 58: Global Fluid Transfer Hose Volume K Forecast, by Types 2020 & 2033
- Table 59: Global Fluid Transfer Hose Revenue billion Forecast, by Country 2020 & 2033
- Table 60: Global Fluid Transfer Hose Volume K Forecast, by Country 2020 & 2033
- Table 61: Turkey Fluid Transfer Hose Revenue (billion) Forecast, by Application 2020 & 2033
- Table 62: Turkey Fluid Transfer Hose Volume (K) Forecast, by Application 2020 & 2033
- Table 63: Israel Fluid Transfer Hose Revenue (billion) Forecast, by Application 2020 & 2033
- Table 64: Israel Fluid Transfer Hose Volume (K) Forecast, by Application 2020 & 2033
- Table 65: GCC Fluid Transfer Hose Revenue (billion) Forecast, by Application 2020 & 2033
- Table 66: GCC Fluid Transfer Hose Volume (K) Forecast, by Application 2020 & 2033
- Table 67: North Africa Fluid Transfer Hose Revenue (billion) Forecast, by Application 2020 & 2033
- Table 68: North Africa Fluid Transfer Hose Volume (K) Forecast, by Application 2020 & 2033
- Table 69: South Africa Fluid Transfer Hose Revenue (billion) Forecast, by Application 2020 & 2033
- Table 70: South Africa Fluid Transfer Hose Volume (K) Forecast, by Application 2020 & 2033
- Table 71: Rest of Middle East & Africa Fluid Transfer Hose Revenue (billion) Forecast, by Application 2020 & 2033
- Table 72: Rest of Middle East & Africa Fluid Transfer Hose Volume (K) Forecast, by Application 2020 & 2033
- Table 73: Global Fluid Transfer Hose Revenue billion Forecast, by Application 2020 & 2033
- Table 74: Global Fluid Transfer Hose Volume K Forecast, by Application 2020 & 2033
- Table 75: Global Fluid Transfer Hose Revenue billion Forecast, by Types 2020 & 2033
- Table 76: Global Fluid Transfer Hose Volume K Forecast, by Types 2020 & 2033
- Table 77: Global Fluid Transfer Hose Revenue billion Forecast, by Country 2020 & 2033
- Table 78: Global Fluid Transfer Hose Volume K Forecast, by Country 2020 & 2033
- Table 79: China Fluid Transfer Hose Revenue (billion) Forecast, by Application 2020 & 2033
- Table 80: China Fluid Transfer Hose Volume (K) Forecast, by Application 2020 & 2033
- Table 81: India Fluid Transfer Hose Revenue (billion) Forecast, by Application 2020 & 2033
- Table 82: India Fluid Transfer Hose Volume (K) Forecast, by Application 2020 & 2033
- Table 83: Japan Fluid Transfer Hose Revenue (billion) Forecast, by Application 2020 & 2033
- Table 84: Japan Fluid Transfer Hose Volume (K) Forecast, by Application 2020 & 2033
- Table 85: South Korea Fluid Transfer Hose Revenue (billion) Forecast, by Application 2020 & 2033
- Table 86: South Korea Fluid Transfer Hose Volume (K) Forecast, by Application 2020 & 2033
- Table 87: ASEAN Fluid Transfer Hose Revenue (billion) Forecast, by Application 2020 & 2033
- Table 88: ASEAN Fluid Transfer Hose Volume (K) Forecast, by Application 2020 & 2033
- Table 89: Oceania Fluid Transfer Hose Revenue (billion) Forecast, by Application 2020 & 2033
- Table 90: Oceania Fluid Transfer Hose Volume (K) Forecast, by Application 2020 & 2033
- Table 91: Rest of Asia Pacific Fluid Transfer Hose Revenue (billion) Forecast, by Application 2020 & 2033
- Table 92: Rest of Asia Pacific Fluid Transfer Hose Volume (K) Forecast, by Application 2020 & 2033
Frequently Asked Questions
1. What is the projected Compound Annual Growth Rate (CAGR) of the Fluid Transfer Hose?
The projected CAGR is approximately 4.7%.
2. Which companies are prominent players in the Fluid Transfer Hose?
Key companies in the market include Delfingen, Thermo Fisher Scientific, Grayline Inc, Junkosha, Puresys, Saint-Gobain, Senior Flexonics, RB Royal, Orscheln, Furukawa Electric, Watson Marlow, Ginho Group, J.K. Organisation, Cooper Standard, SACRED, Safran.
3. What are the main segments of the Fluid Transfer Hose?
The market segments include Application, Types.
4. Can you provide details about the market size?
The market size is estimated to be USD 30.9 billion as of 2022.
5. What are some drivers contributing to market growth?
N/A
6. What are the notable trends driving market growth?
N/A
7. Are there any restraints impacting market growth?
N/A
8. Can you provide examples of recent developments in the market?
N/A
9. What pricing options are available for accessing the report?
Pricing options include single-user, multi-user, and enterprise licenses priced at USD 3950.00, USD 5925.00, and USD 7900.00 respectively.
10. Is the market size provided in terms of value or volume?
The market size is provided in terms of value, measured in billion and volume, measured in K.
11. Are there any specific market keywords associated with the report?
Yes, the market keyword associated with the report is "Fluid Transfer Hose," which aids in identifying and referencing the specific market segment covered.
12. How do I determine which pricing option suits my needs best?
The pricing options vary based on user requirements and access needs. Individual users may opt for single-user licenses, while businesses requiring broader access may choose multi-user or enterprise licenses for cost-effective access to the report.
13. Are there any additional resources or data provided in the Fluid Transfer Hose report?
While the report offers comprehensive insights, it's advisable to review the specific contents or supplementary materials provided to ascertain if additional resources or data are available.
14. How can I stay updated on further developments or reports in the Fluid Transfer Hose?
To stay informed about further developments, trends, and reports in the Fluid Transfer Hose, consider subscribing to industry newsletters, following relevant companies and organizations, or regularly checking reputable industry news sources and publications.
Methodology
Step 1 - Identification of Relevant Samples Size from Population Database


Step 2 - Approaches for Defining Global Market Size (Value, Volume* & Price*)

Note*: In applicable scenarios
Step 3 - Data Sources
Primary Research
- Web Analytics
- Survey Reports
- Research Institute
- Latest Research Reports
- Opinion Leaders
Secondary Research
- Annual Reports
- White Paper
- Latest Press Release
- Industry Association
- Paid Database
- Investor Presentations

Step 4 - Data Triangulation
Involves using different sources of information in order to increase the validity of a study
These sources are likely to be stakeholders in a program - participants, other researchers, program staff, other community members, and so on.
Then we put all data in single framework & apply various statistical tools to find out the dynamic on the market.
During the analysis stage, feedback from the stakeholder groups would be compared to determine areas of agreement as well as areas of divergence