

Key Insights
The South African food colorant market, valued at approximately ZAR 250 million in 2025, is projected to experience robust growth, driven by increasing demand from the food processing and beverage industries. This growth is fueled by several factors: a burgeoning middle class with rising disposable incomes leading to increased consumption of processed foods, the expanding popularity of convenience foods and ready-to-eat meals, and a growing preference for visually appealing products. The market is segmented by product type (synthetic and natural colorants) and application (bakery, dairy, confectionery, meat, beverages, etc.), with synthetic colorants currently holding a larger market share due to their cost-effectiveness and vibrant color range. However, increasing consumer awareness of the potential health impacts of synthetic colorants is driving a shift towards natural alternatives, presenting significant growth opportunities for this segment. Regulatory changes regarding food additives and increasing demand for clean-label products also contribute to this trend. Key players in the South African market include both international and local companies, constantly innovating to meet evolving consumer preferences and regulatory requirements. The market is competitive, with companies focusing on product diversification, strategic partnerships, and geographical expansion to maintain market share.
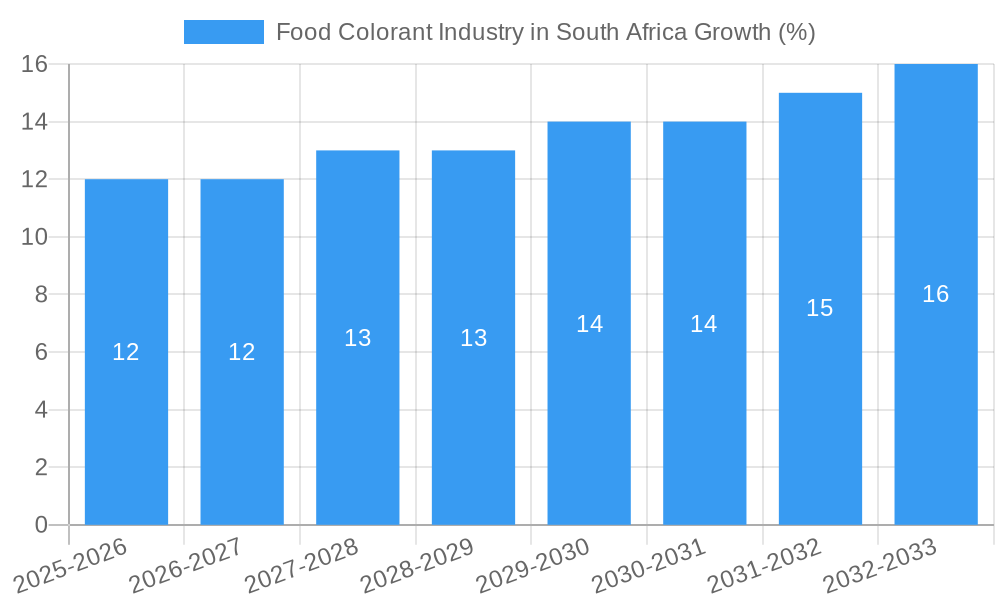
Despite the positive outlook, challenges remain. Fluctuations in raw material prices, stringent regulatory compliance, and the potential for economic instability could impact market growth. Furthermore, competition from imported colorants and the need for continuous investment in research and development to create innovative and sustainable colorant solutions represent significant hurdles. The forecast period (2025-2033) is anticipated to witness a steady rise in market value, with the CAGR of 4.60% indicating sustainable growth. However, understanding and adapting to changing consumer preferences and regulatory landscapes will be crucial for success within this dynamic market.

South Africa Food Colorant Industry Report: 2019-2033
This comprehensive report provides a detailed analysis of the South African food colorant industry, offering invaluable insights for businesses, investors, and stakeholders. Covering the period from 2019 to 2033, with a focus on 2025, this report unveils market trends, competitive dynamics, and future growth potential. The report leverages extensive research to provide a granular understanding of this dynamic sector, encompassing market sizing, segmentation, and key player analysis.
Food Colorant Industry in South Africa Market Structure & Competitive Landscape
The South African food colorant market exhibits a moderately concentrated structure, with a Herfindahl-Hirschman Index (HHI) estimated at xx in 2025. Key players, including BASF SE, Sensient Technologies, Chr. Hansen Holding A/S, and Nicola J Flavors & Fragrances, hold significant market share. However, the presence of smaller, specialized players like EDCOL and Quantum Colors S indicates a degree of competition.
Market innovation is driven by increasing consumer demand for natural and clean-label food products, necessitating the development of new, sustainable colorants. Regulatory changes, particularly concerning food safety and labeling, significantly influence market dynamics. Synthetic food colorants remain dominant due to cost-effectiveness, but natural colorants are gaining traction, driven by health consciousness. Product substitutes, such as natural extracts and fruit/vegetable purees, pose some competition, albeit limited due to cost and functionality differences.
End-user segmentation is significant, with the bakery, confectionery, and beverage sectors representing the largest applications. M&A activity in the South African food colorant market has been relatively low in recent years, with an estimated xx Million in transaction value between 2019-2024. Future consolidation is anticipated as larger players seek to expand their market reach and product portfolios.
Food Colorant Industry in South Africa Market Trends & Opportunities
The South African food colorant market is projected to experience a Compound Annual Growth Rate (CAGR) of xx% during the forecast period (2025-2033), reaching a market value of xx Million by 2033. This growth is fueled by rising consumer demand for processed foods, particularly within the rapidly expanding middle class. Technological advancements, such as the development of more stable and versatile colorants, further contribute to market expansion. Increasing health consciousness is driving demand for natural food colorants, opening opportunities for manufacturers focusing on organic and clean-label products. The market penetration rate of natural colorants is projected to reach xx% by 2033, up from xx% in 2025. However, the competitive landscape remains intense, with established players and emerging entrants vying for market share. Price fluctuations of raw materials, particularly natural ingredients, present a key challenge to manufacturers.
Dominant Markets & Segments in Food Colorant Industry in South Africa
The dominant segment within the South African food colorant industry is synthetic food colorants, driven by their cost-effectiveness and ease of use in various applications. However, the natural food colorants segment is demonstrating significant growth potential, reflecting rising consumer preference for healthier and cleaner food products.
By Product Type:
- Synthetic Food Colorants: Dominant due to cost-effectiveness; projected to maintain significant market share.
- Natural Food Colorants: Experiencing rapid growth, driven by increasing health consciousness; higher price point limits widespread adoption.
By Application:
- Beverages: Strong growth potential due to high consumption and demand for visually appealing products.
- Confectionery: Significant market share due to the use of colorants for enhancing visual appeal.
- Bakery: Substantial consumption of colorants in various baked goods.
- Dairy & Frozen Products: Steady growth, driven by increased consumption of these products.
Growth Drivers:
- Expanding middle class and increased disposable income.
- Rising demand for processed and convenience foods.
- Growing preference for visually appealing food products.
- Government initiatives supporting the food processing industry.
Food Colorant Industry in South Africa Product Analysis
Product innovation in the South African food colorant industry focuses on developing natural, stable, and versatile colorants catering to the increasing demand for clean-label products. Technological advancements include the use of advanced extraction techniques for natural colorants and the development of colorants with enhanced stability and color intensity. These innovations are crucial for manufacturers to meet evolving consumer preferences and regulatory requirements, securing a competitive edge in the market.
Key Drivers, Barriers & Challenges in Food Colorant Industry in South Africa
Key Drivers:
- Growing demand for processed foods.
- Increasing consumer preference for visually appealing products.
- Development of innovative and sustainable colorants.
Challenges:
- Fluctuating raw material prices (particularly for natural colorants).
- Stringent regulatory requirements for food safety and labeling.
- Intense competition from both domestic and international players. Price wars impacting profitability. Estimated impact on 2025 profits: xx Million lost.
Growth Drivers in the Food Colorant Industry in South Africa Market
The South African food colorant market is driven by the growth of the processed food industry, the increasing demand for visually appealing food products, and the development of innovative and sustainable colorants. Economic growth and expanding middle class further fuel this market. Government initiatives to support the food processing sector create favorable conditions for investment and growth.
Challenges Impacting Food Colorant Industry in South Africa Growth
Challenges include price volatility of raw materials, particularly natural ingredients, which impacts profitability. Stringent regulatory requirements for food safety and labeling, along with intense competition and the need for continuous innovation, add to market complexities.
Key Players Shaping the Food Colorant Industry in South Africa Market
- Nicola J Flavors & Fragrances
- Chemical Services Ltd (Lake Foods)
- Sensient Technologies
- Chr. Hansen Holding A/S
- BASF SE
- Quantum Colors S
- EDCOL
Significant Food Colorant Industry in South Africa Industry Milestones
- 2020: Increased demand for natural food colorants due to growing health consciousness.
- 2022: Introduction of stricter regulations regarding food labeling and safety standards.
- 2023: Launch of a new range of sustainable food colorants by a major player.
- 2024: Increased investment in research and development of natural colorants by several companies.
Future Outlook for Food Colorant Industry in South Africa Market
The South African food colorant market is poised for continued growth, driven by a confluence of factors. The expanding food processing industry, increasing consumer demand for appealing and healthy food products, and the focus on innovation in the area of sustainable and natural colorants all contribute to positive market prospects. Strategic investments in research and development, alongside effective market penetration strategies, will shape the success of players in this evolving market. Opportunities exist for companies that can successfully cater to the growing demand for natural colorants while maintaining cost competitiveness.
Food Colorant Industry in South Africa Segmentation
-
1. Product Type
- 1.1. Synthetic Food colorants
- 1.2. Natural Food Colorants
-
2. Application
- 2.1. Bakery
- 2.2. Dairy & Frozen products
- 2.3. Confectionery
- 2.4. Meat poultry & Sea Food products
- 2.5. Beverages
- 2.6. Others
Food Colorant Industry in South Africa Segmentation By Geography
-
1. North America
- 1.1. United States
- 1.2. Canada
- 1.3. Mexico
-
2. South America
- 2.1. Brazil
- 2.2. Argentina
- 2.3. Rest of South America
-
3. Europe
- 3.1. United Kingdom
- 3.2. Germany
- 3.3. France
- 3.4. Italy
- 3.5. Spain
- 3.6. Russia
- 3.7. Benelux
- 3.8. Nordics
- 3.9. Rest of Europe
-
4. Middle East & Africa
- 4.1. Turkey
- 4.2. Israel
- 4.3. GCC
- 4.4. North Africa
- 4.5. South Africa
- 4.6. Rest of Middle East & Africa
-
5. Asia Pacific
- 5.1. China
- 5.2. India
- 5.3. Japan
- 5.4. South Korea
- 5.5. ASEAN
- 5.6. Oceania
- 5.7. Rest of Asia Pacific

Food Colorant Industry in South Africa REPORT HIGHLIGHTS
| Aspects | Details |
|---|---|
| Study Period | 2019-2033 |
| Base Year | 2024 |
| Estimated Year | 2025 |
| Forecast Period | 2025-2033 |
| Historical Period | 2019-2024 |
| Growth Rate | CAGR of 4.60% from 2019-2033 |
| Segmentation |
|
Table of Contents
- 1. Introduction
- 1.1. Research Scope
- 1.2. Market Segmentation
- 1.3. Research Methodology
- 1.4. Definitions and Assumptions
- 2. Executive Summary
- 2.1. Introduction
- 3. Market Dynamics
- 3.1. Introduction
- 3.2. Market Drivers
- 3.2.1. Rising Health Consciousness among consumer
- 3.3. Market Restrains
- 3.3.1. High Cost of natural Ingredients
- 3.4. Market Trends
- 3.4.1. Growing Emergence of Natural Color
- 4. Market Factor Analysis
- 4.1. Porters Five Forces
- 4.2. Supply/Value Chain
- 4.3. PESTEL analysis
- 4.4. Market Entropy
- 4.5. Patent/Trademark Analysis
- 5. Global Food Colorant Industry in South Africa Analysis, Insights and Forecast, 2019-2031
- 5.1. Market Analysis, Insights and Forecast - by Product Type
- 5.1.1. Synthetic Food colorants
- 5.1.2. Natural Food Colorants
- 5.2. Market Analysis, Insights and Forecast - by Application
- 5.2.1. Bakery
- 5.2.2. Dairy & Frozen products
- 5.2.3. Confectionery
- 5.2.4. Meat poultry & Sea Food products
- 5.2.5. Beverages
- 5.2.6. Others
- 5.3. Market Analysis, Insights and Forecast - by Region
- 5.3.1. North America
- 5.3.2. South America
- 5.3.3. Europe
- 5.3.4. Middle East & Africa
- 5.3.5. Asia Pacific
- 5.1. Market Analysis, Insights and Forecast - by Product Type
- 6. North America Food Colorant Industry in South Africa Analysis, Insights and Forecast, 2019-2031
- 6.1. Market Analysis, Insights and Forecast - by Product Type
- 6.1.1. Synthetic Food colorants
- 6.1.2. Natural Food Colorants
- 6.2. Market Analysis, Insights and Forecast - by Application
- 6.2.1. Bakery
- 6.2.2. Dairy & Frozen products
- 6.2.3. Confectionery
- 6.2.4. Meat poultry & Sea Food products
- 6.2.5. Beverages
- 6.2.6. Others
- 6.1. Market Analysis, Insights and Forecast - by Product Type
- 7. South America Food Colorant Industry in South Africa Analysis, Insights and Forecast, 2019-2031
- 7.1. Market Analysis, Insights and Forecast - by Product Type
- 7.1.1. Synthetic Food colorants
- 7.1.2. Natural Food Colorants
- 7.2. Market Analysis, Insights and Forecast - by Application
- 7.2.1. Bakery
- 7.2.2. Dairy & Frozen products
- 7.2.3. Confectionery
- 7.2.4. Meat poultry & Sea Food products
- 7.2.5. Beverages
- 7.2.6. Others
- 7.1. Market Analysis, Insights and Forecast - by Product Type
- 8. Europe Food Colorant Industry in South Africa Analysis, Insights and Forecast, 2019-2031
- 8.1. Market Analysis, Insights and Forecast - by Product Type
- 8.1.1. Synthetic Food colorants
- 8.1.2. Natural Food Colorants
- 8.2. Market Analysis, Insights and Forecast - by Application
- 8.2.1. Bakery
- 8.2.2. Dairy & Frozen products
- 8.2.3. Confectionery
- 8.2.4. Meat poultry & Sea Food products
- 8.2.5. Beverages
- 8.2.6. Others
- 8.1. Market Analysis, Insights and Forecast - by Product Type
- 9. Middle East & Africa Food Colorant Industry in South Africa Analysis, Insights and Forecast, 2019-2031
- 9.1. Market Analysis, Insights and Forecast - by Product Type
- 9.1.1. Synthetic Food colorants
- 9.1.2. Natural Food Colorants
- 9.2. Market Analysis, Insights and Forecast - by Application
- 9.2.1. Bakery
- 9.2.2. Dairy & Frozen products
- 9.2.3. Confectionery
- 9.2.4. Meat poultry & Sea Food products
- 9.2.5. Beverages
- 9.2.6. Others
- 9.1. Market Analysis, Insights and Forecast - by Product Type
- 10. Asia Pacific Food Colorant Industry in South Africa Analysis, Insights and Forecast, 2019-2031
- 10.1. Market Analysis, Insights and Forecast - by Product Type
- 10.1.1. Synthetic Food colorants
- 10.1.2. Natural Food Colorants
- 10.2. Market Analysis, Insights and Forecast - by Application
- 10.2.1. Bakery
- 10.2.2. Dairy & Frozen products
- 10.2.3. Confectionery
- 10.2.4. Meat poultry & Sea Food products
- 10.2.5. Beverages
- 10.2.6. Others
- 10.1. Market Analysis, Insights and Forecast - by Product Type
- 11. South Africa Food Colorant Industry in South Africa Analysis, Insights and Forecast, 2019-2031
- 12. Sudan Food Colorant Industry in South Africa Analysis, Insights and Forecast, 2019-2031
- 13. Uganda Food Colorant Industry in South Africa Analysis, Insights and Forecast, 2019-2031
- 14. Tanzania Food Colorant Industry in South Africa Analysis, Insights and Forecast, 2019-2031
- 15. Kenya Food Colorant Industry in South Africa Analysis, Insights and Forecast, 2019-2031
- 16. Rest of Africa Food Colorant Industry in South Africa Analysis, Insights and Forecast, 2019-2031
- 17. Competitive Analysis
- 17.1. Global Market Share Analysis 2024
- 17.2. Company Profiles
- 17.2.1 Nicola J Flavors & Fragrances
- 17.2.1.1. Overview
- 17.2.1.2. Products
- 17.2.1.3. SWOT Analysis
- 17.2.1.4. Recent Developments
- 17.2.1.5. Financials (Based on Availability)
- 17.2.2 Chemical Services Ltd (Lake Foods)
- 17.2.2.1. Overview
- 17.2.2.2. Products
- 17.2.2.3. SWOT Analysis
- 17.2.2.4. Recent Developments
- 17.2.2.5. Financials (Based on Availability)
- 17.2.3 Sensient Technologies
- 17.2.3.1. Overview
- 17.2.3.2. Products
- 17.2.3.3. SWOT Analysis
- 17.2.3.4. Recent Developments
- 17.2.3.5. Financials (Based on Availability)
- 17.2.4 Chr Hansen holdings A/S
- 17.2.4.1. Overview
- 17.2.4.2. Products
- 17.2.4.3. SWOT Analysis
- 17.2.4.4. Recent Developments
- 17.2.4.5. Financials (Based on Availability)
- 17.2.5 BASF SE
- 17.2.5.1. Overview
- 17.2.5.2. Products
- 17.2.5.3. SWOT Analysis
- 17.2.5.4. Recent Developments
- 17.2.5.5. Financials (Based on Availability)
- 17.2.6 Quantum Colors S
- 17.2.6.1. Overview
- 17.2.6.2. Products
- 17.2.6.3. SWOT Analysis
- 17.2.6.4. Recent Developments
- 17.2.6.5. Financials (Based on Availability)
- 17.2.7 EDCOL
- 17.2.7.1. Overview
- 17.2.7.2. Products
- 17.2.7.3. SWOT Analysis
- 17.2.7.4. Recent Developments
- 17.2.7.5. Financials (Based on Availability)
- 17.2.1 Nicola J Flavors & Fragrances
List of Figures
- Figure 1: Global Food Colorant Industry in South Africa Revenue Breakdown (Million, %) by Region 2024 & 2032
- Figure 2: Africa Food Colorant Industry in South Africa Revenue (Million), by Country 2024 & 2032
- Figure 3: Africa Food Colorant Industry in South Africa Revenue Share (%), by Country 2024 & 2032
- Figure 4: North America Food Colorant Industry in South Africa Revenue (Million), by Product Type 2024 & 2032
- Figure 5: North America Food Colorant Industry in South Africa Revenue Share (%), by Product Type 2024 & 2032
- Figure 6: North America Food Colorant Industry in South Africa Revenue (Million), by Application 2024 & 2032
- Figure 7: North America Food Colorant Industry in South Africa Revenue Share (%), by Application 2024 & 2032
- Figure 8: North America Food Colorant Industry in South Africa Revenue (Million), by Country 2024 & 2032
- Figure 9: North America Food Colorant Industry in South Africa Revenue Share (%), by Country 2024 & 2032
- Figure 10: South America Food Colorant Industry in South Africa Revenue (Million), by Product Type 2024 & 2032
- Figure 11: South America Food Colorant Industry in South Africa Revenue Share (%), by Product Type 2024 & 2032
- Figure 12: South America Food Colorant Industry in South Africa Revenue (Million), by Application 2024 & 2032
- Figure 13: South America Food Colorant Industry in South Africa Revenue Share (%), by Application 2024 & 2032
- Figure 14: South America Food Colorant Industry in South Africa Revenue (Million), by Country 2024 & 2032
- Figure 15: South America Food Colorant Industry in South Africa Revenue Share (%), by Country 2024 & 2032
- Figure 16: Europe Food Colorant Industry in South Africa Revenue (Million), by Product Type 2024 & 2032
- Figure 17: Europe Food Colorant Industry in South Africa Revenue Share (%), by Product Type 2024 & 2032
- Figure 18: Europe Food Colorant Industry in South Africa Revenue (Million), by Application 2024 & 2032
- Figure 19: Europe Food Colorant Industry in South Africa Revenue Share (%), by Application 2024 & 2032
- Figure 20: Europe Food Colorant Industry in South Africa Revenue (Million), by Country 2024 & 2032
- Figure 21: Europe Food Colorant Industry in South Africa Revenue Share (%), by Country 2024 & 2032
- Figure 22: Middle East & Africa Food Colorant Industry in South Africa Revenue (Million), by Product Type 2024 & 2032
- Figure 23: Middle East & Africa Food Colorant Industry in South Africa Revenue Share (%), by Product Type 2024 & 2032
- Figure 24: Middle East & Africa Food Colorant Industry in South Africa Revenue (Million), by Application 2024 & 2032
- Figure 25: Middle East & Africa Food Colorant Industry in South Africa Revenue Share (%), by Application 2024 & 2032
- Figure 26: Middle East & Africa Food Colorant Industry in South Africa Revenue (Million), by Country 2024 & 2032
- Figure 27: Middle East & Africa Food Colorant Industry in South Africa Revenue Share (%), by Country 2024 & 2032
- Figure 28: Asia Pacific Food Colorant Industry in South Africa Revenue (Million), by Product Type 2024 & 2032
- Figure 29: Asia Pacific Food Colorant Industry in South Africa Revenue Share (%), by Product Type 2024 & 2032
- Figure 30: Asia Pacific Food Colorant Industry in South Africa Revenue (Million), by Application 2024 & 2032
- Figure 31: Asia Pacific Food Colorant Industry in South Africa Revenue Share (%), by Application 2024 & 2032
- Figure 32: Asia Pacific Food Colorant Industry in South Africa Revenue (Million), by Country 2024 & 2032
- Figure 33: Asia Pacific Food Colorant Industry in South Africa Revenue Share (%), by Country 2024 & 2032
List of Tables
- Table 1: Global Food Colorant Industry in South Africa Revenue Million Forecast, by Region 2019 & 2032
- Table 2: Global Food Colorant Industry in South Africa Revenue Million Forecast, by Product Type 2019 & 2032
- Table 3: Global Food Colorant Industry in South Africa Revenue Million Forecast, by Application 2019 & 2032
- Table 4: Global Food Colorant Industry in South Africa Revenue Million Forecast, by Region 2019 & 2032
- Table 5: Global Food Colorant Industry in South Africa Revenue Million Forecast, by Country 2019 & 2032
- Table 6: South Africa Food Colorant Industry in South Africa Revenue (Million) Forecast, by Application 2019 & 2032
- Table 7: Sudan Food Colorant Industry in South Africa Revenue (Million) Forecast, by Application 2019 & 2032
- Table 8: Uganda Food Colorant Industry in South Africa Revenue (Million) Forecast, by Application 2019 & 2032
- Table 9: Tanzania Food Colorant Industry in South Africa Revenue (Million) Forecast, by Application 2019 & 2032
- Table 10: Kenya Food Colorant Industry in South Africa Revenue (Million) Forecast, by Application 2019 & 2032
- Table 11: Rest of Africa Food Colorant Industry in South Africa Revenue (Million) Forecast, by Application 2019 & 2032
- Table 12: Global Food Colorant Industry in South Africa Revenue Million Forecast, by Product Type 2019 & 2032
- Table 13: Global Food Colorant Industry in South Africa Revenue Million Forecast, by Application 2019 & 2032
- Table 14: Global Food Colorant Industry in South Africa Revenue Million Forecast, by Country 2019 & 2032
- Table 15: United States Food Colorant Industry in South Africa Revenue (Million) Forecast, by Application 2019 & 2032
- Table 16: Canada Food Colorant Industry in South Africa Revenue (Million) Forecast, by Application 2019 & 2032
- Table 17: Mexico Food Colorant Industry in South Africa Revenue (Million) Forecast, by Application 2019 & 2032
- Table 18: Global Food Colorant Industry in South Africa Revenue Million Forecast, by Product Type 2019 & 2032
- Table 19: Global Food Colorant Industry in South Africa Revenue Million Forecast, by Application 2019 & 2032
- Table 20: Global Food Colorant Industry in South Africa Revenue Million Forecast, by Country 2019 & 2032
- Table 21: Brazil Food Colorant Industry in South Africa Revenue (Million) Forecast, by Application 2019 & 2032
- Table 22: Argentina Food Colorant Industry in South Africa Revenue (Million) Forecast, by Application 2019 & 2032
- Table 23: Rest of South America Food Colorant Industry in South Africa Revenue (Million) Forecast, by Application 2019 & 2032
- Table 24: Global Food Colorant Industry in South Africa Revenue Million Forecast, by Product Type 2019 & 2032
- Table 25: Global Food Colorant Industry in South Africa Revenue Million Forecast, by Application 2019 & 2032
- Table 26: Global Food Colorant Industry in South Africa Revenue Million Forecast, by Country 2019 & 2032
- Table 27: United Kingdom Food Colorant Industry in South Africa Revenue (Million) Forecast, by Application 2019 & 2032
- Table 28: Germany Food Colorant Industry in South Africa Revenue (Million) Forecast, by Application 2019 & 2032
- Table 29: France Food Colorant Industry in South Africa Revenue (Million) Forecast, by Application 2019 & 2032
- Table 30: Italy Food Colorant Industry in South Africa Revenue (Million) Forecast, by Application 2019 & 2032
- Table 31: Spain Food Colorant Industry in South Africa Revenue (Million) Forecast, by Application 2019 & 2032
- Table 32: Russia Food Colorant Industry in South Africa Revenue (Million) Forecast, by Application 2019 & 2032
- Table 33: Benelux Food Colorant Industry in South Africa Revenue (Million) Forecast, by Application 2019 & 2032
- Table 34: Nordics Food Colorant Industry in South Africa Revenue (Million) Forecast, by Application 2019 & 2032
- Table 35: Rest of Europe Food Colorant Industry in South Africa Revenue (Million) Forecast, by Application 2019 & 2032
- Table 36: Global Food Colorant Industry in South Africa Revenue Million Forecast, by Product Type 2019 & 2032
- Table 37: Global Food Colorant Industry in South Africa Revenue Million Forecast, by Application 2019 & 2032
- Table 38: Global Food Colorant Industry in South Africa Revenue Million Forecast, by Country 2019 & 2032
- Table 39: Turkey Food Colorant Industry in South Africa Revenue (Million) Forecast, by Application 2019 & 2032
- Table 40: Israel Food Colorant Industry in South Africa Revenue (Million) Forecast, by Application 2019 & 2032
- Table 41: GCC Food Colorant Industry in South Africa Revenue (Million) Forecast, by Application 2019 & 2032
- Table 42: North Africa Food Colorant Industry in South Africa Revenue (Million) Forecast, by Application 2019 & 2032
- Table 43: South Africa Food Colorant Industry in South Africa Revenue (Million) Forecast, by Application 2019 & 2032
- Table 44: Rest of Middle East & Africa Food Colorant Industry in South Africa Revenue (Million) Forecast, by Application 2019 & 2032
- Table 45: Global Food Colorant Industry in South Africa Revenue Million Forecast, by Product Type 2019 & 2032
- Table 46: Global Food Colorant Industry in South Africa Revenue Million Forecast, by Application 2019 & 2032
- Table 47: Global Food Colorant Industry in South Africa Revenue Million Forecast, by Country 2019 & 2032
- Table 48: China Food Colorant Industry in South Africa Revenue (Million) Forecast, by Application 2019 & 2032
- Table 49: India Food Colorant Industry in South Africa Revenue (Million) Forecast, by Application 2019 & 2032
- Table 50: Japan Food Colorant Industry in South Africa Revenue (Million) Forecast, by Application 2019 & 2032
- Table 51: South Korea Food Colorant Industry in South Africa Revenue (Million) Forecast, by Application 2019 & 2032
- Table 52: ASEAN Food Colorant Industry in South Africa Revenue (Million) Forecast, by Application 2019 & 2032
- Table 53: Oceania Food Colorant Industry in South Africa Revenue (Million) Forecast, by Application 2019 & 2032
- Table 54: Rest of Asia Pacific Food Colorant Industry in South Africa Revenue (Million) Forecast, by Application 2019 & 2032
Frequently Asked Questions
1. What is the projected Compound Annual Growth Rate (CAGR) of the Food Colorant Industry in South Africa?
The projected CAGR is approximately 4.60%.
2. Which companies are prominent players in the Food Colorant Industry in South Africa?
Key companies in the market include Nicola J Flavors & Fragrances, Chemical Services Ltd (Lake Foods), Sensient Technologies, Chr Hansen holdings A/S, BASF SE, Quantum Colors S, EDCOL.
3. What are the main segments of the Food Colorant Industry in South Africa?
The market segments include Product Type, Application.
4. Can you provide details about the market size?
The market size is estimated to be USD XX Million as of 2022.
5. What are some drivers contributing to market growth?
Rising Health Consciousness among consumer.
6. What are the notable trends driving market growth?
Growing Emergence of Natural Color.
7. Are there any restraints impacting market growth?
High Cost of natural Ingredients.
8. Can you provide examples of recent developments in the market?
N/A
9. What pricing options are available for accessing the report?
Pricing options include single-user, multi-user, and enterprise licenses priced at USD 3800, USD 4500, and USD 5800 respectively.
10. Is the market size provided in terms of value or volume?
The market size is provided in terms of value, measured in Million.
11. Are there any specific market keywords associated with the report?
Yes, the market keyword associated with the report is "Food Colorant Industry in South Africa," which aids in identifying and referencing the specific market segment covered.
12. How do I determine which pricing option suits my needs best?
The pricing options vary based on user requirements and access needs. Individual users may opt for single-user licenses, while businesses requiring broader access may choose multi-user or enterprise licenses for cost-effective access to the report.
13. Are there any additional resources or data provided in the Food Colorant Industry in South Africa report?
While the report offers comprehensive insights, it's advisable to review the specific contents or supplementary materials provided to ascertain if additional resources or data are available.
14. How can I stay updated on further developments or reports in the Food Colorant Industry in South Africa?
To stay informed about further developments, trends, and reports in the Food Colorant Industry in South Africa, consider subscribing to industry newsletters, following relevant companies and organizations, or regularly checking reputable industry news sources and publications.
Methodology
Step 1 - Identification of Relevant Samples Size from Population Database


Step 2 - Approaches for Defining Global Market Size (Value, Volume* & Price*)

Note*: In applicable scenarios
Step 3 - Data Sources
Primary Research
- Web Analytics
- Survey Reports
- Research Institute
- Latest Research Reports
- Opinion Leaders
Secondary Research
- Annual Reports
- White Paper
- Latest Press Release
- Industry Association
- Paid Database
- Investor Presentations

Step 4 - Data Triangulation
Involves using different sources of information in order to increase the validity of a study
These sources are likely to be stakeholders in a program - participants, other researchers, program staff, other community members, and so on.
Then we put all data in single framework & apply various statistical tools to find out the dynamic on the market.
During the analysis stage, feedback from the stakeholder groups would be compared to determine areas of agreement as well as areas of divergence
