

Key Insights
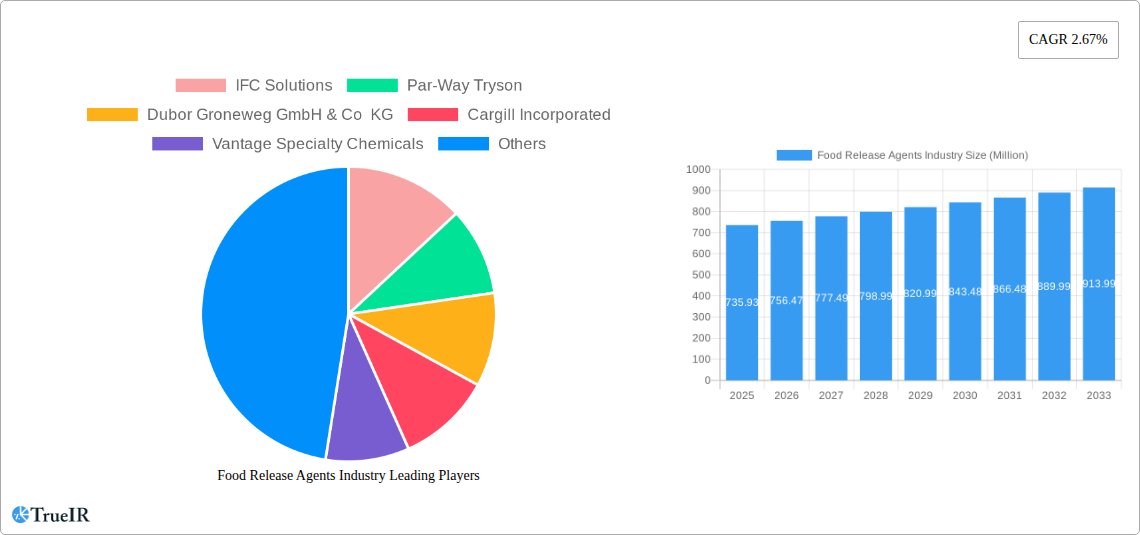
The global food release agents market, valued at $735.93 million in 2025, is projected to experience steady growth, driven by increasing demand for convenient and efficiently produced food products across various sectors. The market's Compound Annual Growth Rate (CAGR) of 2.67% from 2025 to 2033 indicates a consistent expansion, fueled by factors such as the rising popularity of bakery and confectionery items, the growth of the meat processing industry, and the increasing adoption of automation in food manufacturing. The rising consumer preference for clean-label products is impacting the market, with a significant increase in the demand for bio-based release agents compared to their synthetic counterparts. This shift is driven by growing health consciousness and a preference for natural ingredients among consumers. Furthermore, technological advancements in food processing techniques and the introduction of innovative release agents with improved performance characteristics contribute to the market's positive outlook. The market segmentation, encompassing categories like synthetic and bio-based agents and applications such as bakery, confectionery, meat products, and other applications, provides diverse avenues for growth. Geographical expansion, especially in rapidly developing economies in Asia-Pacific, further contributes to the market's potential.
The competitive landscape is marked by the presence of both established industry giants and specialized manufacturers. Key players leverage their expertise in product development and distribution networks to secure market share. Strategies such as mergers and acquisitions, technological innovations, and expansion into new markets are expected to shape the competitive dynamics in the coming years. However, fluctuations in raw material prices and stringent regulatory requirements could pose challenges to market growth. Despite these challenges, the overall market trend indicates a promising future for food release agents, with continued expansion across various segments and geographies, driven by the unwavering need for efficient and high-quality food production. The continued focus on sustainability and consumer demand for natural ingredients will significantly influence the future composition of the market.
Food Release Agents Industry: A Comprehensive Market Report (2019-2033)
This dynamic report provides a detailed analysis of the Food Release Agents industry, offering invaluable insights for businesses, investors, and researchers. Covering the period from 2019 to 2033, with a focus on 2025, this study unveils market trends, competitive dynamics, and future growth potential. The report leverages extensive data analysis and expert insights to provide a comprehensive understanding of this rapidly evolving sector. The global market size in 2025 is estimated at $XX Million, poised for significant growth over the forecast period (2025-2033).
Food Release Agents Industry Market Structure & Competitive Landscape
The Food Release Agents industry exhibits a moderately concentrated market structure, with several key players holding significant market share. The 2025 Herfindahl-Hirschman Index (HHI) is estimated to be XX, indicating a moderately consolidated market. Innovation is a crucial driver, with companies continuously developing new formulations to enhance performance, cater to specific applications, and meet increasing demand for natural and sustainable options. Regulatory landscapes vary across geographies, impacting ingredient approvals and labeling requirements, thus influencing market dynamics. Product substitutes, such as alternative coatings and processing techniques, present competitive pressures, forcing companies to innovate and differentiate their offerings. End-user segmentation, driven by diverse applications across bakery, confectionery, and meat products, shapes market demand. M&A activity is moderately active, with XX mergers and acquisitions recorded between 2019 and 2024, primarily driven by companies seeking to expand their product portfolios and geographic reach.
Food Release Agents Industry Market Trends & Opportunities
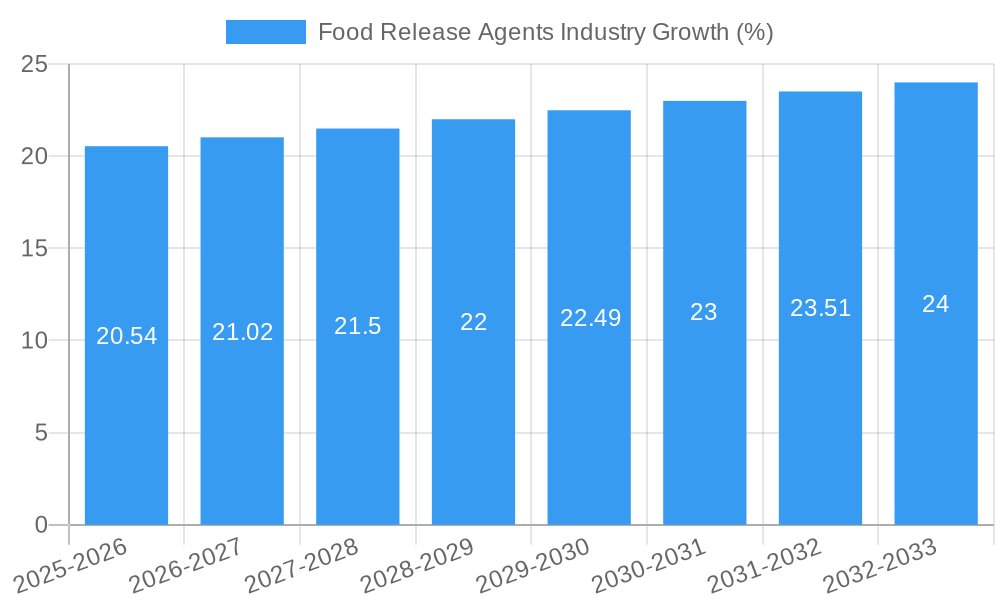
The Food Release Agents market is experiencing robust growth, driven by several key factors. The market is projected to achieve a Compound Annual Growth Rate (CAGR) of XX% during the forecast period (2025-2033). Rising consumer demand for convenient and high-quality food products fuels the need for effective release agents. The shift towards healthier and more natural food options has created opportunities for bio-based release agents, while technological advancements are driving the development of innovative formulations with enhanced performance characteristics. Market penetration rates for bio-based release agents are growing steadily, reaching XX% in 2025, reflecting a strong preference for sustainable solutions. Competitive dynamics are characterized by innovation, strategic partnerships, and geographic expansion.
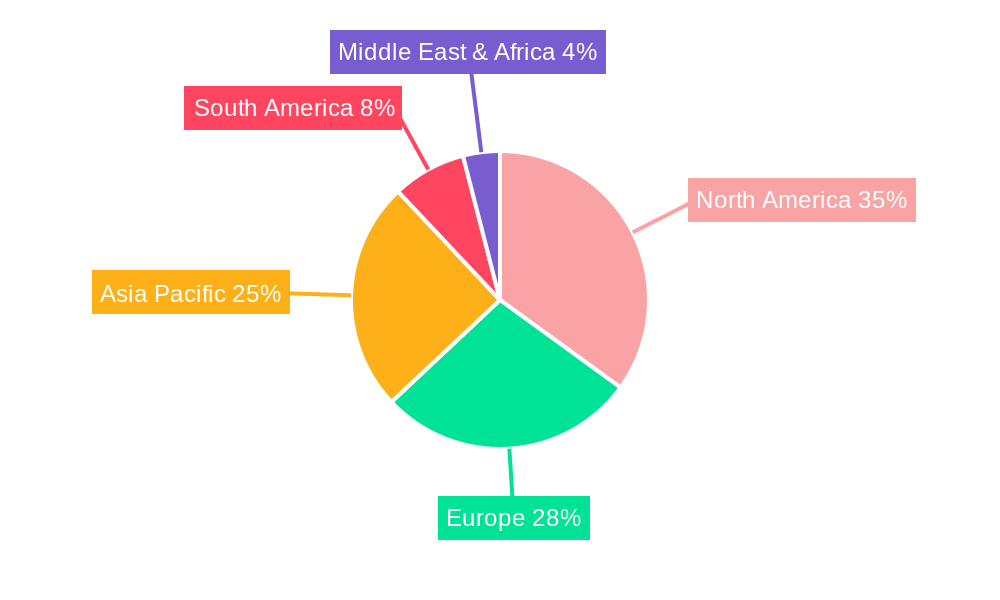
Dominant Markets & Segments in Food Release Agents Industry
The North American region holds a dominant position in the Food Release Agents market, accounting for approximately XX% of the global market share in 2025. This dominance is attributed to several factors:
- Strong Food Processing Industry: A well-established and technologically advanced food processing sector drives demand.
- High Consumer Spending: High disposable incomes support greater consumption of processed foods.
- Favorable Regulatory Environment: Supportive policies and regulations stimulate industry growth.
The bakery segment is the largest application area, representing XX% of the total market in 2025, followed by confectionery and meat and meat products. Within the product category, synthetic release agents still hold a larger market share (XX%) than bio-based (XX%), although the latter is experiencing faster growth due to increasing consumer demand for natural and sustainable ingredients.
Food Release Agents Industry Product Analysis
Technological advancements are driving the development of high-performance food release agents with improved functionalities. These innovations include formulations with enhanced release properties, improved durability, and enhanced compatibility with different food matrices. The market is witnessing a growing trend towards eco-friendly and sustainable options, such as bio-based release agents derived from renewable resources. Companies are focusing on developing customized solutions tailored to specific food applications, emphasizing performance and cost-effectiveness.
Key Drivers, Barriers & Challenges in Food Release Agents Industry
Key Drivers: Increased demand for processed foods, rising consumer preference for convenience, technological advancements leading to improved product performance and sustainability, and supportive government regulations promoting the use of eco-friendly ingredients are key drivers.
Key Challenges: Fluctuations in raw material prices, stringent regulatory compliance requirements, intense competition among manufacturers, and concerns regarding the potential health and environmental impacts of certain release agents represent significant challenges. The impact of these challenges is estimated to decrease the market growth by approximately XX% during the forecast period.
Growth Drivers in the Food Release Agents Industry Market
The market is propelled by the rising demand for processed foods, particularly in developing economies. Technological advancements, leading to improved release agent efficacy and sustainability, are also crucial. Furthermore, favorable regulatory environments in certain regions incentivize adoption of food-grade release agents.
Challenges Impacting Food Release Agents Industry Growth
Regulatory complexities, concerning ingredient approvals and labeling requirements, represent significant hurdles. Supply chain disruptions, including volatile raw material prices and logistical challenges, also impact market growth. Intense competition among established players and new entrants creates pressure on pricing and profitability.
Key Players Shaping the Food Release Agents Industry Market
- IFC Solutions
- Par-Way Tryson
- Dubor Groneweg GmbH & Co KG
- Cargill Incorporated
- Vantage Specialty Chemicals
- Lasenor Emul SL
- Bunge Limited
- Avatar Corporation
- Archer-Daniels-Midland Co
- Bundy Baking solutions
Significant Food Release Agents Industry Industry Milestones
- 2020: Introduction of a new bio-based release agent by IFC Solutions, expanding its sustainable product line.
- 2022: Cargill Incorporated acquired a smaller release agent manufacturer, strengthening its market position.
- 2023: Several key players launched new formulations with enhanced heat resistance and improved release properties.
Future Outlook for Food Release Agents Industry Market
The Food Release Agents market is poised for continued growth, driven by increasing demand for convenient and high-quality food products, coupled with the growing adoption of sustainable and eco-friendly solutions. Strategic partnerships, technological innovations, and expansions into new markets present significant opportunities for growth. The market is projected to reach $XX Million by 2033.
Food Release Agents Industry Segmentation
-
1. Cateogry
- 1.1. Synthetic
- 1.2. Bio-based
-
2. Application
- 2.1. Bakery
- 2.2. Confectionery
- 2.3. Meat and Meat Products
- 2.4. Other Applications
Food Release Agents Industry Segmentation By Geography
-
1. North America
- 1.1. United States
- 1.2. Canada
- 1.3. Mexico
- 1.4. Rest of North America
-
2. Europe
- 2.1. United Kingdom
- 2.2. Germany
- 2.3. France
- 2.4. Russia
- 2.5. Italy
- 2.6. Spain
- 2.7. Rest of Europe
-
3. Asia Pacific
- 3.1. India
- 3.2. China
- 3.3. Japan
- 3.4. Australia
- 3.5. Rest of Asia Pacific
-
4. South America
- 4.1. Brazil
- 4.2. Argentina
- 4.3. Rest of South America
- 5. Middle East
-
6. South Africa
- 6.1. United Arab Emirates
- 6.2. Rest of Middle East
Food Release Agents Industry REPORT HIGHLIGHTS
| Aspects | Details |
|---|---|
| Study Period | 2019-2033 |
| Base Year | 2024 |
| Estimated Year | 2025 |
| Forecast Period | 2025-2033 |
| Historical Period | 2019-2024 |
| Growth Rate | CAGR of 2.67% from 2019-2033 |
| Segmentation |
|
Table of Contents
- 1. Introduction
- 1.1. Research Scope
- 1.2. Market Segmentation
- 1.3. Research Methodology
- 1.4. Definitions and Assumptions
- 2. Executive Summary
- 2.1. Introduction
- 3. Market Dynamics
- 3.1. Introduction
- 3.2. Market Drivers
- 3.2.1. Health Benefits Promoting Apple Cider Vinegar Demand; Unfiltered Apple Cider Vinegar Being Popular
- 3.3. Market Restrains
- 3.3.1. Rising Demand for Other Vinegar Types
- 3.4. Market Trends
- 3.4.1. Wide Applications and Functionality
- 4. Market Factor Analysis
- 4.1. Porters Five Forces
- 4.2. Supply/Value Chain
- 4.3. PESTEL analysis
- 4.4. Market Entropy
- 4.5. Patent/Trademark Analysis
- 5. Global Food Release Agents Industry Analysis, Insights and Forecast, 2019-2031
- 5.1. Market Analysis, Insights and Forecast - by Cateogry
- 5.1.1. Synthetic
- 5.1.2. Bio-based
- 5.2. Market Analysis, Insights and Forecast - by Application
- 5.2.1. Bakery
- 5.2.2. Confectionery
- 5.2.3. Meat and Meat Products
- 5.2.4. Other Applications
- 5.3. Market Analysis, Insights and Forecast - by Region
- 5.3.1. North America
- 5.3.2. Europe
- 5.3.3. Asia Pacific
- 5.3.4. South America
- 5.3.5. Middle East
- 5.3.6. South Africa
- 5.1. Market Analysis, Insights and Forecast - by Cateogry
- 6. North America Food Release Agents Industry Analysis, Insights and Forecast, 2019-2031
- 6.1. Market Analysis, Insights and Forecast - by Cateogry
- 6.1.1. Synthetic
- 6.1.2. Bio-based
- 6.2. Market Analysis, Insights and Forecast - by Application
- 6.2.1. Bakery
- 6.2.2. Confectionery
- 6.2.3. Meat and Meat Products
- 6.2.4. Other Applications
- 6.1. Market Analysis, Insights and Forecast - by Cateogry
- 7. Europe Food Release Agents Industry Analysis, Insights and Forecast, 2019-2031
- 7.1. Market Analysis, Insights and Forecast - by Cateogry
- 7.1.1. Synthetic
- 7.1.2. Bio-based
- 7.2. Market Analysis, Insights and Forecast - by Application
- 7.2.1. Bakery
- 7.2.2. Confectionery
- 7.2.3. Meat and Meat Products
- 7.2.4. Other Applications
- 7.1. Market Analysis, Insights and Forecast - by Cateogry
- 8. Asia Pacific Food Release Agents Industry Analysis, Insights and Forecast, 2019-2031
- 8.1. Market Analysis, Insights and Forecast - by Cateogry
- 8.1.1. Synthetic
- 8.1.2. Bio-based
- 8.2. Market Analysis, Insights and Forecast - by Application
- 8.2.1. Bakery
- 8.2.2. Confectionery
- 8.2.3. Meat and Meat Products
- 8.2.4. Other Applications
- 8.1. Market Analysis, Insights and Forecast - by Cateogry
- 9. South America Food Release Agents Industry Analysis, Insights and Forecast, 2019-2031
- 9.1. Market Analysis, Insights and Forecast - by Cateogry
- 9.1.1. Synthetic
- 9.1.2. Bio-based
- 9.2. Market Analysis, Insights and Forecast - by Application
- 9.2.1. Bakery
- 9.2.2. Confectionery
- 9.2.3. Meat and Meat Products
- 9.2.4. Other Applications
- 9.1. Market Analysis, Insights and Forecast - by Cateogry
- 10. Middle East Food Release Agents Industry Analysis, Insights and Forecast, 2019-2031
- 10.1. Market Analysis, Insights and Forecast - by Cateogry
- 10.1.1. Synthetic
- 10.1.2. Bio-based
- 10.2. Market Analysis, Insights and Forecast - by Application
- 10.2.1. Bakery
- 10.2.2. Confectionery
- 10.2.3. Meat and Meat Products
- 10.2.4. Other Applications
- 10.1. Market Analysis, Insights and Forecast - by Cateogry
- 11. South Africa Food Release Agents Industry Analysis, Insights and Forecast, 2019-2031
- 11.1. Market Analysis, Insights and Forecast - by Cateogry
- 11.1.1. Synthetic
- 11.1.2. Bio-based
- 11.2. Market Analysis, Insights and Forecast - by Application
- 11.2.1. Bakery
- 11.2.2. Confectionery
- 11.2.3. Meat and Meat Products
- 11.2.4. Other Applications
- 11.1. Market Analysis, Insights and Forecast - by Cateogry
- 12. North America Food Release Agents Industry Analysis, Insights and Forecast, 2019-2031
- 12.1. Market Analysis, Insights and Forecast - By Country/Sub-region
- 12.1.1 United States
- 12.1.2 Canada
- 12.1.3 Mexico
- 12.1.4 Rest of North America
- 13. Europe Food Release Agents Industry Analysis, Insights and Forecast, 2019-2031
- 13.1. Market Analysis, Insights and Forecast - By Country/Sub-region
- 13.1.1 United Kingdom
- 13.1.2 Germany
- 13.1.3 France
- 13.1.4 Russia
- 13.1.5 Italy
- 13.1.6 Spain
- 13.1.7 Rest of Europe
- 14. Asia Pacific Food Release Agents Industry Analysis, Insights and Forecast, 2019-2031
- 14.1. Market Analysis, Insights and Forecast - By Country/Sub-region
- 14.1.1 India
- 14.1.2 China
- 14.1.3 Japan
- 14.1.4 Australia
- 14.1.5 Rest of Asia Pacific
- 15. South America Food Release Agents Industry Analysis, Insights and Forecast, 2019-2031
- 15.1. Market Analysis, Insights and Forecast - By Country/Sub-region
- 15.1.1 Brazil
- 15.1.2 Argentina
- 15.1.3 Rest of South America
- 16. Middle East & Africa Food Release Agents Industry Analysis, Insights and Forecast, 2019-2031
- 16.1. Market Analysis, Insights and Forecast - By Country/Sub-region
- 16.1.1 UAE
- 16.1.2 South Africa
- 16.1.3 Saudi Arabia
- 16.1.4 Rest of MEA
- 17. Competitive Analysis
- 17.1. Global Market Share Analysis 2024
- 17.2. Company Profiles
- 17.2.1 IFC Solutions
- 17.2.1.1. Overview
- 17.2.1.2. Products
- 17.2.1.3. SWOT Analysis
- 17.2.1.4. Recent Developments
- 17.2.1.5. Financials (Based on Availability)
- 17.2.2 Par-Way Tryson
- 17.2.2.1. Overview
- 17.2.2.2. Products
- 17.2.2.3. SWOT Analysis
- 17.2.2.4. Recent Developments
- 17.2.2.5. Financials (Based on Availability)
- 17.2.3 Dubor Groneweg GmbH & Co KG
- 17.2.3.1. Overview
- 17.2.3.2. Products
- 17.2.3.3. SWOT Analysis
- 17.2.3.4. Recent Developments
- 17.2.3.5. Financials (Based on Availability)
- 17.2.4 Cargill Incorporated
- 17.2.4.1. Overview
- 17.2.4.2. Products
- 17.2.4.3. SWOT Analysis
- 17.2.4.4. Recent Developments
- 17.2.4.5. Financials (Based on Availability)
- 17.2.5 Vantage Specialty Chemicals
- 17.2.5.1. Overview
- 17.2.5.2. Products
- 17.2.5.3. SWOT Analysis
- 17.2.5.4. Recent Developments
- 17.2.5.5. Financials (Based on Availability)
- 17.2.6 Lasenor Emul SL
- 17.2.6.1. Overview
- 17.2.6.2. Products
- 17.2.6.3. SWOT Analysis
- 17.2.6.4. Recent Developments
- 17.2.6.5. Financials (Based on Availability)
- 17.2.7 Bunge Limited
- 17.2.7.1. Overview
- 17.2.7.2. Products
- 17.2.7.3. SWOT Analysis
- 17.2.7.4. Recent Developments
- 17.2.7.5. Financials (Based on Availability)
- 17.2.8 Avatar Corporation
- 17.2.8.1. Overview
- 17.2.8.2. Products
- 17.2.8.3. SWOT Analysis
- 17.2.8.4. Recent Developments
- 17.2.8.5. Financials (Based on Availability)
- 17.2.9 Archer-Daniels-Midland Co
- 17.2.9.1. Overview
- 17.2.9.2. Products
- 17.2.9.3. SWOT Analysis
- 17.2.9.4. Recent Developments
- 17.2.9.5. Financials (Based on Availability)
- 17.2.10 Bundy Baking solutions*List Not Exhaustive
- 17.2.10.1. Overview
- 17.2.10.2. Products
- 17.2.10.3. SWOT Analysis
- 17.2.10.4. Recent Developments
- 17.2.10.5. Financials (Based on Availability)
- 17.2.1 IFC Solutions
List of Figures
- Figure 1: Global Food Release Agents Industry Revenue Breakdown (Million, %) by Region 2024 & 2032
- Figure 2: North America Food Release Agents Industry Revenue (Million), by Country 2024 & 2032
- Figure 3: North America Food Release Agents Industry Revenue Share (%), by Country 2024 & 2032
- Figure 4: Europe Food Release Agents Industry Revenue (Million), by Country 2024 & 2032
- Figure 5: Europe Food Release Agents Industry Revenue Share (%), by Country 2024 & 2032
- Figure 6: Asia Pacific Food Release Agents Industry Revenue (Million), by Country 2024 & 2032
- Figure 7: Asia Pacific Food Release Agents Industry Revenue Share (%), by Country 2024 & 2032
- Figure 8: South America Food Release Agents Industry Revenue (Million), by Country 2024 & 2032
- Figure 9: South America Food Release Agents Industry Revenue Share (%), by Country 2024 & 2032
- Figure 10: Middle East & Africa Food Release Agents Industry Revenue (Million), by Country 2024 & 2032
- Figure 11: Middle East & Africa Food Release Agents Industry Revenue Share (%), by Country 2024 & 2032
- Figure 12: North America Food Release Agents Industry Revenue (Million), by Cateogry 2024 & 2032
- Figure 13: North America Food Release Agents Industry Revenue Share (%), by Cateogry 2024 & 2032
- Figure 14: North America Food Release Agents Industry Revenue (Million), by Application 2024 & 2032
- Figure 15: North America Food Release Agents Industry Revenue Share (%), by Application 2024 & 2032
- Figure 16: North America Food Release Agents Industry Revenue (Million), by Country 2024 & 2032
- Figure 17: North America Food Release Agents Industry Revenue Share (%), by Country 2024 & 2032
- Figure 18: Europe Food Release Agents Industry Revenue (Million), by Cateogry 2024 & 2032
- Figure 19: Europe Food Release Agents Industry Revenue Share (%), by Cateogry 2024 & 2032
- Figure 20: Europe Food Release Agents Industry Revenue (Million), by Application 2024 & 2032
- Figure 21: Europe Food Release Agents Industry Revenue Share (%), by Application 2024 & 2032
- Figure 22: Europe Food Release Agents Industry Revenue (Million), by Country 2024 & 2032
- Figure 23: Europe Food Release Agents Industry Revenue Share (%), by Country 2024 & 2032
- Figure 24: Asia Pacific Food Release Agents Industry Revenue (Million), by Cateogry 2024 & 2032
- Figure 25: Asia Pacific Food Release Agents Industry Revenue Share (%), by Cateogry 2024 & 2032
- Figure 26: Asia Pacific Food Release Agents Industry Revenue (Million), by Application 2024 & 2032
- Figure 27: Asia Pacific Food Release Agents Industry Revenue Share (%), by Application 2024 & 2032
- Figure 28: Asia Pacific Food Release Agents Industry Revenue (Million), by Country 2024 & 2032
- Figure 29: Asia Pacific Food Release Agents Industry Revenue Share (%), by Country 2024 & 2032
- Figure 30: South America Food Release Agents Industry Revenue (Million), by Cateogry 2024 & 2032
- Figure 31: South America Food Release Agents Industry Revenue Share (%), by Cateogry 2024 & 2032
- Figure 32: South America Food Release Agents Industry Revenue (Million), by Application 2024 & 2032
- Figure 33: South America Food Release Agents Industry Revenue Share (%), by Application 2024 & 2032
- Figure 34: South America Food Release Agents Industry Revenue (Million), by Country 2024 & 2032
- Figure 35: South America Food Release Agents Industry Revenue Share (%), by Country 2024 & 2032
- Figure 36: Middle East Food Release Agents Industry Revenue (Million), by Cateogry 2024 & 2032
- Figure 37: Middle East Food Release Agents Industry Revenue Share (%), by Cateogry 2024 & 2032
- Figure 38: Middle East Food Release Agents Industry Revenue (Million), by Application 2024 & 2032
- Figure 39: Middle East Food Release Agents Industry Revenue Share (%), by Application 2024 & 2032
- Figure 40: Middle East Food Release Agents Industry Revenue (Million), by Country 2024 & 2032
- Figure 41: Middle East Food Release Agents Industry Revenue Share (%), by Country 2024 & 2032
- Figure 42: South Africa Food Release Agents Industry Revenue (Million), by Cateogry 2024 & 2032
- Figure 43: South Africa Food Release Agents Industry Revenue Share (%), by Cateogry 2024 & 2032
- Figure 44: South Africa Food Release Agents Industry Revenue (Million), by Application 2024 & 2032
- Figure 45: South Africa Food Release Agents Industry Revenue Share (%), by Application 2024 & 2032
- Figure 46: South Africa Food Release Agents Industry Revenue (Million), by Country 2024 & 2032
- Figure 47: South Africa Food Release Agents Industry Revenue Share (%), by Country 2024 & 2032
List of Tables
- Table 1: Global Food Release Agents Industry Revenue Million Forecast, by Region 2019 & 2032
- Table 2: Global Food Release Agents Industry Revenue Million Forecast, by Cateogry 2019 & 2032
- Table 3: Global Food Release Agents Industry Revenue Million Forecast, by Application 2019 & 2032
- Table 4: Global Food Release Agents Industry Revenue Million Forecast, by Region 2019 & 2032
- Table 5: Global Food Release Agents Industry Revenue Million Forecast, by Country 2019 & 2032
- Table 6: United States Food Release Agents Industry Revenue (Million) Forecast, by Application 2019 & 2032
- Table 7: Canada Food Release Agents Industry Revenue (Million) Forecast, by Application 2019 & 2032
- Table 8: Mexico Food Release Agents Industry Revenue (Million) Forecast, by Application 2019 & 2032
- Table 9: Rest of North America Food Release Agents Industry Revenue (Million) Forecast, by Application 2019 & 2032
- Table 10: Global Food Release Agents Industry Revenue Million Forecast, by Country 2019 & 2032
- Table 11: United Kingdom Food Release Agents Industry Revenue (Million) Forecast, by Application 2019 & 2032
- Table 12: Germany Food Release Agents Industry Revenue (Million) Forecast, by Application 2019 & 2032
- Table 13: France Food Release Agents Industry Revenue (Million) Forecast, by Application 2019 & 2032
- Table 14: Russia Food Release Agents Industry Revenue (Million) Forecast, by Application 2019 & 2032
- Table 15: Italy Food Release Agents Industry Revenue (Million) Forecast, by Application 2019 & 2032
- Table 16: Spain Food Release Agents Industry Revenue (Million) Forecast, by Application 2019 & 2032
- Table 17: Rest of Europe Food Release Agents Industry Revenue (Million) Forecast, by Application 2019 & 2032
- Table 18: Global Food Release Agents Industry Revenue Million Forecast, by Country 2019 & 2032
- Table 19: India Food Release Agents Industry Revenue (Million) Forecast, by Application 2019 & 2032
- Table 20: China Food Release Agents Industry Revenue (Million) Forecast, by Application 2019 & 2032
- Table 21: Japan Food Release Agents Industry Revenue (Million) Forecast, by Application 2019 & 2032
- Table 22: Australia Food Release Agents Industry Revenue (Million) Forecast, by Application 2019 & 2032
- Table 23: Rest of Asia Pacific Food Release Agents Industry Revenue (Million) Forecast, by Application 2019 & 2032
- Table 24: Global Food Release Agents Industry Revenue Million Forecast, by Country 2019 & 2032
- Table 25: Brazil Food Release Agents Industry Revenue (Million) Forecast, by Application 2019 & 2032
- Table 26: Argentina Food Release Agents Industry Revenue (Million) Forecast, by Application 2019 & 2032
- Table 27: Rest of South America Food Release Agents Industry Revenue (Million) Forecast, by Application 2019 & 2032
- Table 28: Global Food Release Agents Industry Revenue Million Forecast, by Country 2019 & 2032
- Table 29: UAE Food Release Agents Industry Revenue (Million) Forecast, by Application 2019 & 2032
- Table 30: South Africa Food Release Agents Industry Revenue (Million) Forecast, by Application 2019 & 2032
- Table 31: Saudi Arabia Food Release Agents Industry Revenue (Million) Forecast, by Application 2019 & 2032
- Table 32: Rest of MEA Food Release Agents Industry Revenue (Million) Forecast, by Application 2019 & 2032
- Table 33: Global Food Release Agents Industry Revenue Million Forecast, by Cateogry 2019 & 2032
- Table 34: Global Food Release Agents Industry Revenue Million Forecast, by Application 2019 & 2032
- Table 35: Global Food Release Agents Industry Revenue Million Forecast, by Country 2019 & 2032
- Table 36: United States Food Release Agents Industry Revenue (Million) Forecast, by Application 2019 & 2032
- Table 37: Canada Food Release Agents Industry Revenue (Million) Forecast, by Application 2019 & 2032
- Table 38: Mexico Food Release Agents Industry Revenue (Million) Forecast, by Application 2019 & 2032
- Table 39: Rest of North America Food Release Agents Industry Revenue (Million) Forecast, by Application 2019 & 2032
- Table 40: Global Food Release Agents Industry Revenue Million Forecast, by Cateogry 2019 & 2032
- Table 41: Global Food Release Agents Industry Revenue Million Forecast, by Application 2019 & 2032
- Table 42: Global Food Release Agents Industry Revenue Million Forecast, by Country 2019 & 2032
- Table 43: United Kingdom Food Release Agents Industry Revenue (Million) Forecast, by Application 2019 & 2032
- Table 44: Germany Food Release Agents Industry Revenue (Million) Forecast, by Application 2019 & 2032
- Table 45: France Food Release Agents Industry Revenue (Million) Forecast, by Application 2019 & 2032
- Table 46: Russia Food Release Agents Industry Revenue (Million) Forecast, by Application 2019 & 2032
- Table 47: Italy Food Release Agents Industry Revenue (Million) Forecast, by Application 2019 & 2032
- Table 48: Spain Food Release Agents Industry Revenue (Million) Forecast, by Application 2019 & 2032
- Table 49: Rest of Europe Food Release Agents Industry Revenue (Million) Forecast, by Application 2019 & 2032
- Table 50: Global Food Release Agents Industry Revenue Million Forecast, by Cateogry 2019 & 2032
- Table 51: Global Food Release Agents Industry Revenue Million Forecast, by Application 2019 & 2032
- Table 52: Global Food Release Agents Industry Revenue Million Forecast, by Country 2019 & 2032
- Table 53: India Food Release Agents Industry Revenue (Million) Forecast, by Application 2019 & 2032
- Table 54: China Food Release Agents Industry Revenue (Million) Forecast, by Application 2019 & 2032
- Table 55: Japan Food Release Agents Industry Revenue (Million) Forecast, by Application 2019 & 2032
- Table 56: Australia Food Release Agents Industry Revenue (Million) Forecast, by Application 2019 & 2032
- Table 57: Rest of Asia Pacific Food Release Agents Industry Revenue (Million) Forecast, by Application 2019 & 2032
- Table 58: Global Food Release Agents Industry Revenue Million Forecast, by Cateogry 2019 & 2032
- Table 59: Global Food Release Agents Industry Revenue Million Forecast, by Application 2019 & 2032
- Table 60: Global Food Release Agents Industry Revenue Million Forecast, by Country 2019 & 2032
- Table 61: Brazil Food Release Agents Industry Revenue (Million) Forecast, by Application 2019 & 2032
- Table 62: Argentina Food Release Agents Industry Revenue (Million) Forecast, by Application 2019 & 2032
- Table 63: Rest of South America Food Release Agents Industry Revenue (Million) Forecast, by Application 2019 & 2032
- Table 64: Global Food Release Agents Industry Revenue Million Forecast, by Cateogry 2019 & 2032
- Table 65: Global Food Release Agents Industry Revenue Million Forecast, by Application 2019 & 2032
- Table 66: Global Food Release Agents Industry Revenue Million Forecast, by Country 2019 & 2032
- Table 67: Global Food Release Agents Industry Revenue Million Forecast, by Cateogry 2019 & 2032
- Table 68: Global Food Release Agents Industry Revenue Million Forecast, by Application 2019 & 2032
- Table 69: Global Food Release Agents Industry Revenue Million Forecast, by Country 2019 & 2032
- Table 70: United Arab Emirates Food Release Agents Industry Revenue (Million) Forecast, by Application 2019 & 2032
- Table 71: Rest of Middle East Food Release Agents Industry Revenue (Million) Forecast, by Application 2019 & 2032
Frequently Asked Questions
1. What is the projected Compound Annual Growth Rate (CAGR) of the Food Release Agents Industry?
The projected CAGR is approximately 2.67%.
2. Which companies are prominent players in the Food Release Agents Industry?
Key companies in the market include IFC Solutions, Par-Way Tryson, Dubor Groneweg GmbH & Co KG, Cargill Incorporated, Vantage Specialty Chemicals, Lasenor Emul SL, Bunge Limited, Avatar Corporation, Archer-Daniels-Midland Co, Bundy Baking solutions*List Not Exhaustive.
3. What are the main segments of the Food Release Agents Industry?
The market segments include Cateogry, Application.
4. Can you provide details about the market size?
The market size is estimated to be USD 735.93 Million as of 2022.
5. What are some drivers contributing to market growth?
Health Benefits Promoting Apple Cider Vinegar Demand; Unfiltered Apple Cider Vinegar Being Popular.
6. What are the notable trends driving market growth?
Wide Applications and Functionality.
7. Are there any restraints impacting market growth?
Rising Demand for Other Vinegar Types.
8. Can you provide examples of recent developments in the market?
N/A
9. What pricing options are available for accessing the report?
Pricing options include single-user, multi-user, and enterprise licenses priced at USD 4750, USD 5250, and USD 8750 respectively.
10. Is the market size provided in terms of value or volume?
The market size is provided in terms of value, measured in Million.
11. Are there any specific market keywords associated with the report?
Yes, the market keyword associated with the report is "Food Release Agents Industry," which aids in identifying and referencing the specific market segment covered.
12. How do I determine which pricing option suits my needs best?
The pricing options vary based on user requirements and access needs. Individual users may opt for single-user licenses, while businesses requiring broader access may choose multi-user or enterprise licenses for cost-effective access to the report.
13. Are there any additional resources or data provided in the Food Release Agents Industry report?
While the report offers comprehensive insights, it's advisable to review the specific contents or supplementary materials provided to ascertain if additional resources or data are available.
14. How can I stay updated on further developments or reports in the Food Release Agents Industry?
To stay informed about further developments, trends, and reports in the Food Release Agents Industry, consider subscribing to industry newsletters, following relevant companies and organizations, or regularly checking reputable industry news sources and publications.
Methodology
Step 1 - Identification of Relevant Samples Size from Population Database


Step 2 - Approaches for Defining Global Market Size (Value, Volume* & Price*)

Note*: In applicable scenarios
Step 3 - Data Sources
Primary Research
- Web Analytics
- Survey Reports
- Research Institute
- Latest Research Reports
- Opinion Leaders
Secondary Research
- Annual Reports
- White Paper
- Latest Press Release
- Industry Association
- Paid Database
- Investor Presentations

Step 4 - Data Triangulation
Involves using different sources of information in order to increase the validity of a study
These sources are likely to be stakeholders in a program - participants, other researchers, program staff, other community members, and so on.
Then we put all data in single framework & apply various statistical tools to find out the dynamic on the market.
During the analysis stage, feedback from the stakeholder groups would be compared to determine areas of agreement as well as areas of divergence
