

Key Insights
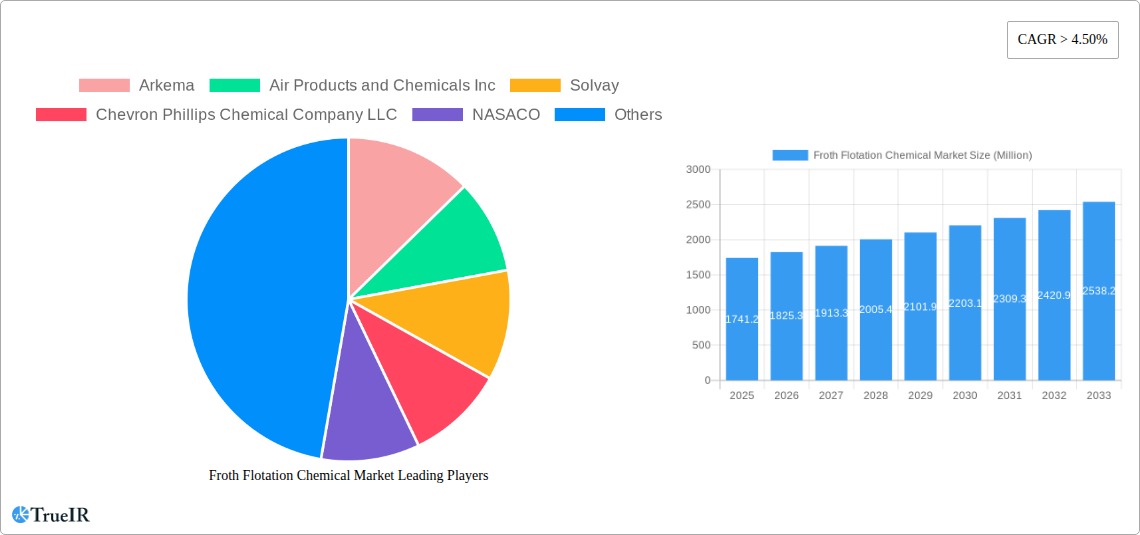
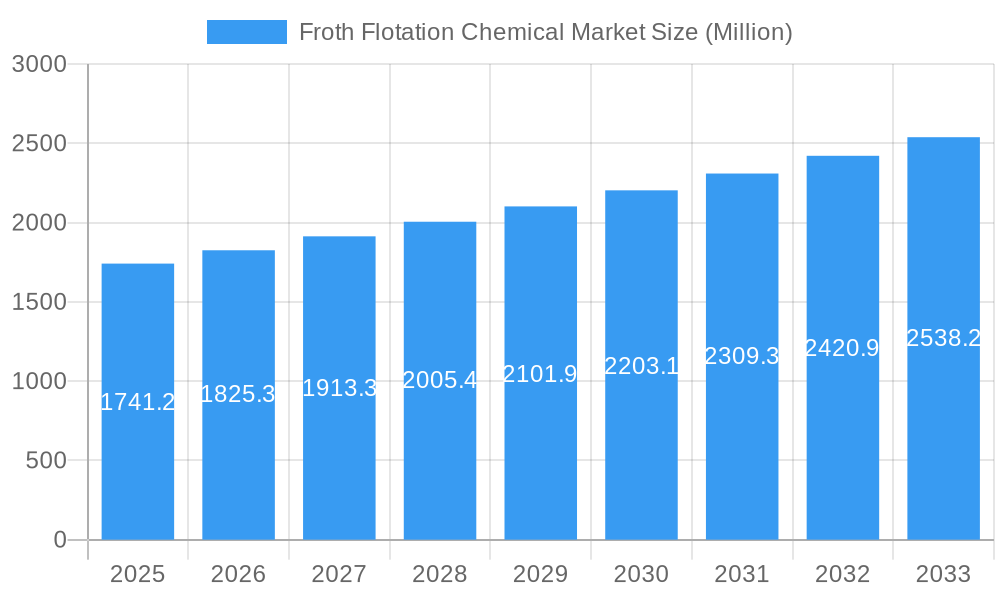
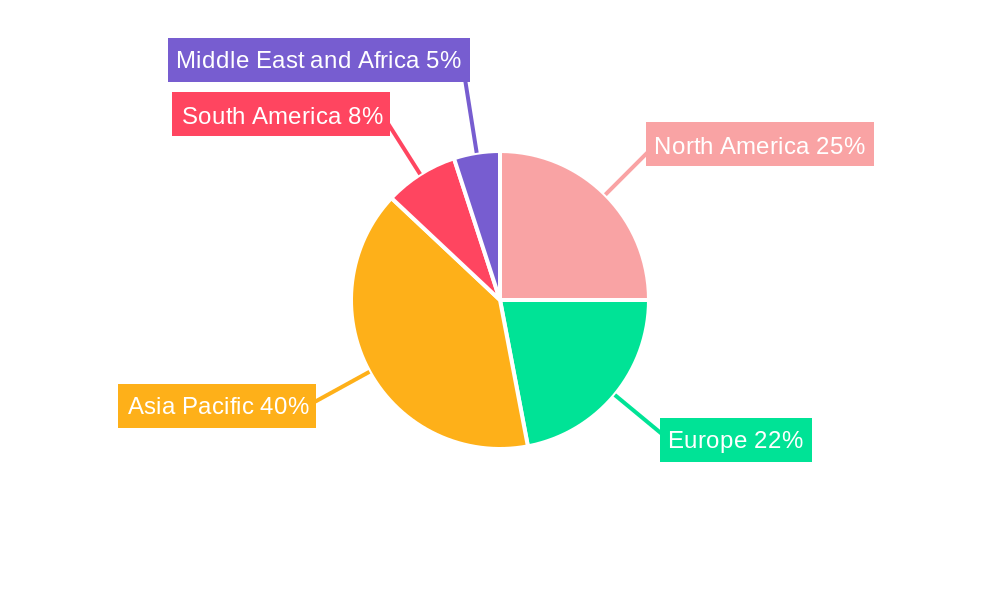
The Froth Flotation Chemical market, valued at $1741.2 million in 2025, is projected to experience robust growth, exceeding a 4.5% CAGR from 2025 to 2033. This expansion is driven by the increasing demand for efficient mineral processing in the mining industry, coupled with the growing need for effective wastewater treatment in industrial and municipal sectors. The Pulp and Paper industry also contributes significantly to market demand, utilizing froth flotation chemicals for various processes. Key trends shaping the market include the rising adoption of sustainable and environmentally friendly reagents, alongside ongoing technological advancements in flotation chemistry enhancing efficiency and selectivity. While regulatory constraints on chemical usage and potential fluctuations in raw material prices pose challenges, the overall market outlook remains positive, fueled by the continuous expansion of end-user industries and the inherent need for efficient mineral recovery and wastewater treatment globally. The market is segmented by reagent type (collectors, frothers, modifiers, and deactivators), end-user industry (mining, pulp and paper, industrial waste and sewage treatment, and others), and geography, with Asia Pacific, North America, and Europe representing the major regional markets. Leading companies like Arkema, Air Products and Chemicals, Solvay, and BASF are actively shaping market dynamics through innovation and strategic partnerships.
Froth Flotation Chemical Market Market Size (In Billion)
The significant growth within the mining sector is largely attributed to the global rise in resource extraction and the need to optimize mineral recovery. The increasing stringency of environmental regulations concerning effluent discharge is a major catalyst for the adoption of advanced froth flotation chemicals in wastewater treatment. The continued expansion of the pulp and paper industry, with its reliance on efficient fiber separation and purification methods, further bolsters market demand. Competition among key players is intense, focused on providing innovative, cost-effective solutions catering to the specific needs of diverse end-user industries. Future growth will likely be influenced by technological advancements such as improved reagent formulations, advanced automation, and data-driven process optimization within the mining, pulp and paper, and wastewater treatment sectors.
Froth Flotation Chemical Market Company Market Share
Froth Flotation Chemical Market: A Comprehensive Market Report (2019-2033)
This dynamic report offers a deep dive into the Froth Flotation Chemical market, providing a comprehensive analysis of its current state, future trajectory, and key players. Leveraging extensive market research and data analysis covering the period 2019-2033 (with a base year of 2025 and forecast period 2025-2033), this report is an indispensable resource for industry professionals, investors, and strategic decision-makers. The report analyzes market trends, opportunities, and challenges across various segments, including reagent types (Collectors, Non-ionic Frothers), end-user industries (Mining, Pulp and Paper, Industrial Waste and Sewage Treatment, Other End-user Industries), and geographic regions.
Froth Flotation Chemical Market Market Structure & Competitive Landscape
The Froth Flotation Chemical market exhibits a moderately concentrated structure, with key players such as Arkema, Air Products and Chemicals Inc., Solvay, Chevron Phillips Chemical Company LLC, BASF SE, Kemira, Dow, Clariant, and others (including NASACO and Nouryon) holding significant market share. The market's competitive landscape is characterized by intense innovation, driven by the need for more efficient and sustainable solutions. Regulatory pressures, particularly concerning environmental regulations and worker safety, are also shaping market dynamics. Product substitution is a factor, with ongoing research into alternative separation techniques. However, froth flotation remains a dominant technology due to its cost-effectiveness and adaptability.
The end-user segmentation demonstrates a strong reliance on the mining industry, with significant contributions from the pulp and paper and industrial waste treatment sectors. M&A activity has been moderate, with xx Million in transactions recorded between 2019 and 2024, primarily focused on expanding product portfolios and geographic reach. The market concentration ratio (CR4) is estimated to be around xx%, indicating a moderately concentrated market. Future M&A activity is expected to focus on technological advancements and sustainable solutions.
Froth Flotation Chemical Market Market Trends & Opportunities
The global Froth Flotation Chemical market is projected to witness robust growth during the forecast period (2025-2033), with a CAGR of xx%. This growth is primarily fueled by the increasing demand from the mining industry, particularly in developing economies experiencing rapid industrialization. Technological advancements are also driving market expansion, with a growing focus on AI-powered reagent optimization and automation solutions. Consumer preferences are shifting towards eco-friendly and sustainable options, prompting manufacturers to develop greener formulations. Competitive dynamics are characterized by ongoing innovation, strategic partnerships, and capacity expansions. Market penetration rates for advanced reagent technologies are steadily rising, indicating increased adoption by end-users. The market size is estimated at xx Million in 2025, and is expected to reach xx Million by 2033.
Dominant Markets & Segments in Froth Flotation Chemical Market
The mining industry remains the dominant end-user segment, accounting for approximately xx% of the market share in 2025. Within the reagent types, collectors hold the largest market share, followed by non-ionic frothers. Geographically, the Asia-Pacific region is expected to be the fastest-growing market, driven by significant mining activities and infrastructure development.
Key Growth Drivers for Mining Segment:
- Expansion of mining operations, particularly in emerging markets.
- Increasing demand for metals and minerals.
- Government initiatives promoting resource extraction.
- Advancements in mining technologies leading to higher reagent demand.
Key Growth Drivers for Asia-Pacific Region:
- Rapid industrialization and urbanization.
- Significant investments in mining infrastructure.
- Growing demand for raw materials from manufacturing sectors.
The North American market is also significant, benefiting from established mining activities and a robust industrial base. Europe, while mature, shows steady growth due to ongoing investments in sustainable mining practices and advancements in reagent technologies.
Froth Flotation Chemical Market Product Analysis
Product innovation in the froth flotation chemical market is focused on developing more efficient, selective, and environmentally friendly reagents. Advanced collectors with improved selectivity and reduced consumption are gaining traction. Similarly, frothers with enhanced performance characteristics, such as improved foam stability and reduced water consumption, are becoming increasingly popular. These innovations address specific challenges faced by end-users, such as minimizing reagent costs, improving recovery rates, and reducing environmental impact. The market fit of these new products is largely driven by industry demand for increased efficiency and sustainability.
Key Drivers, Barriers & Challenges in Froth Flotation Chemical Market
Key Drivers:
The Froth Flotation Chemical market is propelled by the growing demand for metals and minerals, technological advancements in reagent formulations, and government initiatives promoting sustainable mining practices. Increased automation in mining operations also drives demand.
Challenges:
Fluctuations in raw material prices, stringent environmental regulations, and intense competition among manufacturers represent key challenges. Supply chain disruptions, particularly in the procurement of specific raw materials, can lead to production delays and increased costs. The impact of these challenges can be quantified through reduced profit margins and potential market share losses for manufacturers.
Growth Drivers in the Froth Flotation Chemical Market Market
Growth is fueled by increasing demand from key industries like mining and pulp & paper, coupled with technological advancements leading to more efficient and sustainable reagents. Government regulations promoting resource recovery and sustainable practices further contribute.
Challenges Impacting Froth Flotation Chemical Market Growth
Challenges include volatile raw material prices, stringent environmental regulations increasing manufacturing costs, and supply chain disruptions impacting production. Competition from alternative separation techniques also puts pressure on the market.
Key Players Shaping the Froth Flotation Chemical Market Market
Significant Froth Flotation Chemical Market Industry Milestones
- October 2022: Solvay launched 'SmartFloat,' an AI-based reagent optimization system for the mining industry, improving process efficiency and data utilization. This signifies a shift towards digitalization and data-driven optimization within the froth flotation industry.
Future Outlook for Froth Flotation Chemical Market Market
The Froth Flotation Chemical market is poised for continued growth, driven by increasing demand from key industries and technological advancements leading to more sustainable and efficient solutions. Strategic partnerships, mergers and acquisitions, and investments in R&D will further shape market dynamics. Opportunities exist in developing innovative reagents, expanding into new geographic markets, and providing comprehensive solutions to end-users.
Froth Flotation Chemical Market Segmentation
-
1. Reagent Type
-
1.1. Collectors
- 1.1.1. Cationic
- 1.1.2. Anionic
- 1.1.3. Non-ionic
-
1.2. Frothers
- 1.2.1. Acidic
- 1.2.2. Basic
- 1.2.3. Neutral
-
1.3. Modifiers
- 1.3.1. Acidic Depressants
- 1.3.2. pH modifiers
- 1.3.3. Activators
- 1.3.4. Deactivators
- 1.4. Other Reagent Types
-
1.1. Collectors
-
2. End-user Industry
- 2.1. Mining
- 2.2. Pulp and Paper
- 2.3. Industrial Waste and Sewage Treatment
- 2.4. Other End-user Industries
Froth Flotation Chemical Market Segmentation By Geography
-
1. Asia Pacific
- 1.1. China
- 1.2. India
- 1.3. Japan
- 1.4. South Korea
- 1.5. Rest of Asia Pacific
-
2. North America
- 2.1. United States
- 2.2. Canada
- 2.3. Mexico
-
3. Europe
- 3.1. Germany
- 3.2. United Kingdom
- 3.3. France
- 3.4. Italy
- 3.5. Rest of Europe
-
4. South America
- 4.1. Brazil
- 4.2. Argentina
- 4.3. Rest of South America
-
5. Middle East and Africa
- 5.1. Saudi Arabia
- 5.2. South Africa
- 5.3. Rest of Middle East and Africa
Froth Flotation Chemical Market Regional Market Share
Geographic Coverage of Froth Flotation Chemical Market
Froth Flotation Chemical Market REPORT HIGHLIGHTS
| Aspects | Details |
|---|---|
| Study Period | 2020-2034 |
| Base Year | 2025 |
| Estimated Year | 2026 |
| Forecast Period | 2026-2034 |
| Historical Period | 2020-2025 |
| Growth Rate | CAGR of > 4.50% from 2020-2034 |
| Segmentation |
|
Table of Contents
- 1. Introduction
- 1.1. Research Scope
- 1.2. Market Segmentation
- 1.3. Research Objective
- 1.4. Definitions and Assumptions
- 2. Executive Summary
- 2.1. Market Snapshot
- 3. Market Dynamics
- 3.1. Market Drivers
- 3.2. Market Restrains
- 3.3. Market Trends
- 3.4. Market Opportunities
- 4. Market Factor Analysis
- 4.1. Porters Five Forces
- 4.1.1. Bargaining Power of Suppliers
- 4.1.2. Bargaining Power of Buyers
- 4.1.3. Threat of New Entrants
- 4.1.4. Threat of Substitutes
- 4.1.5. Competitive Rivalry
- 4.2. PESTEL analysis
- 4.3. BCG Analysis
- 4.3.1. Stars (High Growth, High Market Share)
- 4.3.2. Cash Cows (Low Growth, High Market Share)
- 4.3.3. Question Mark (High Growth, Low Market Share)
- 4.3.4. Dogs (Low Growth, Low Market Share)
- 4.4. Ansoff Matrix Analysis
- 4.5. Supply Chain Analysis
- 4.6. Regulatory Landscape
- 4.7. Current Market Potential and Opportunity Assessment (TAM–SAM–SOM Framework)
- 4.8. TIR Analyst Note
- 4.1. Porters Five Forces
- 5. Market Analysis, Insights and Forecast 2021-2033
- 5.1. Market Analysis, Insights and Forecast - by Reagent Type
- 5.1.1. Collectors
- 5.1.1.1. Cationic
- 5.1.1.2. Anionic
- 5.1.1.3. Non-ionic
- 5.1.2. Frothers
- 5.1.2.1. Acidic
- 5.1.2.2. Basic
- 5.1.2.3. Neutral
- 5.1.3. Modifiers
- 5.1.3.1. Acidic Depressants
- 5.1.3.2. pH modifiers
- 5.1.3.3. Activators
- 5.1.3.4. Deactivators
- 5.1.4. Other Reagent Types
- 5.1.1. Collectors
- 5.2. Market Analysis, Insights and Forecast - by End-user Industry
- 5.2.1. Mining
- 5.2.2. Pulp and Paper
- 5.2.3. Industrial Waste and Sewage Treatment
- 5.2.4. Other End-user Industries
- 5.3. Market Analysis, Insights and Forecast - by Region
- 5.3.1. Asia Pacific
- 5.3.2. North America
- 5.3.3. Europe
- 5.3.4. South America
- 5.3.5. Middle East and Africa
- 5.1. Market Analysis, Insights and Forecast - by Reagent Type
- 6. Global Froth Flotation Chemical Market Analysis, Insights and Forecast, 2021-2033
- 6.1. Market Analysis, Insights and Forecast - by Reagent Type
- 6.1.1. Collectors
- 6.1.1.1. Cationic
- 6.1.1.2. Anionic
- 6.1.1.3. Non-ionic
- 6.1.2. Frothers
- 6.1.2.1. Acidic
- 6.1.2.2. Basic
- 6.1.2.3. Neutral
- 6.1.3. Modifiers
- 6.1.3.1. Acidic Depressants
- 6.1.3.2. pH modifiers
- 6.1.3.3. Activators
- 6.1.3.4. Deactivators
- 6.1.4. Other Reagent Types
- 6.1.1. Collectors
- 6.2. Market Analysis, Insights and Forecast - by End-user Industry
- 6.2.1. Mining
- 6.2.2. Pulp and Paper
- 6.2.3. Industrial Waste and Sewage Treatment
- 6.2.4. Other End-user Industries
- 6.1. Market Analysis, Insights and Forecast - by Reagent Type
- 7. Asia Pacific Froth Flotation Chemical Market Analysis, Insights and Forecast, 2020-2032
- 7.1. Market Analysis, Insights and Forecast - by Reagent Type
- 7.1.1. Collectors
- 7.1.1.1. Cationic
- 7.1.1.2. Anionic
- 7.1.1.3. Non-ionic
- 7.1.2. Frothers
- 7.1.2.1. Acidic
- 7.1.2.2. Basic
- 7.1.2.3. Neutral
- 7.1.3. Modifiers
- 7.1.3.1. Acidic Depressants
- 7.1.3.2. pH modifiers
- 7.1.3.3. Activators
- 7.1.3.4. Deactivators
- 7.1.4. Other Reagent Types
- 7.1.1. Collectors
- 7.2. Market Analysis, Insights and Forecast - by End-user Industry
- 7.2.1. Mining
- 7.2.2. Pulp and Paper
- 7.2.3. Industrial Waste and Sewage Treatment
- 7.2.4. Other End-user Industries
- 7.1. Market Analysis, Insights and Forecast - by Reagent Type
- 8. North America Froth Flotation Chemical Market Analysis, Insights and Forecast, 2020-2032
- 8.1. Market Analysis, Insights and Forecast - by Reagent Type
- 8.1.1. Collectors
- 8.1.1.1. Cationic
- 8.1.1.2. Anionic
- 8.1.1.3. Non-ionic
- 8.1.2. Frothers
- 8.1.2.1. Acidic
- 8.1.2.2. Basic
- 8.1.2.3. Neutral
- 8.1.3. Modifiers
- 8.1.3.1. Acidic Depressants
- 8.1.3.2. pH modifiers
- 8.1.3.3. Activators
- 8.1.3.4. Deactivators
- 8.1.4. Other Reagent Types
- 8.1.1. Collectors
- 8.2. Market Analysis, Insights and Forecast - by End-user Industry
- 8.2.1. Mining
- 8.2.2. Pulp and Paper
- 8.2.3. Industrial Waste and Sewage Treatment
- 8.2.4. Other End-user Industries
- 8.1. Market Analysis, Insights and Forecast - by Reagent Type
- 9. Europe Froth Flotation Chemical Market Analysis, Insights and Forecast, 2020-2032
- 9.1. Market Analysis, Insights and Forecast - by Reagent Type
- 9.1.1. Collectors
- 9.1.1.1. Cationic
- 9.1.1.2. Anionic
- 9.1.1.3. Non-ionic
- 9.1.2. Frothers
- 9.1.2.1. Acidic
- 9.1.2.2. Basic
- 9.1.2.3. Neutral
- 9.1.3. Modifiers
- 9.1.3.1. Acidic Depressants
- 9.1.3.2. pH modifiers
- 9.1.3.3. Activators
- 9.1.3.4. Deactivators
- 9.1.4. Other Reagent Types
- 9.1.1. Collectors
- 9.2. Market Analysis, Insights and Forecast - by End-user Industry
- 9.2.1. Mining
- 9.2.2. Pulp and Paper
- 9.2.3. Industrial Waste and Sewage Treatment
- 9.2.4. Other End-user Industries
- 9.1. Market Analysis, Insights and Forecast - by Reagent Type
- 10. South America Froth Flotation Chemical Market Analysis, Insights and Forecast, 2020-2032
- 10.1. Market Analysis, Insights and Forecast - by Reagent Type
- 10.1.1. Collectors
- 10.1.1.1. Cationic
- 10.1.1.2. Anionic
- 10.1.1.3. Non-ionic
- 10.1.2. Frothers
- 10.1.2.1. Acidic
- 10.1.2.2. Basic
- 10.1.2.3. Neutral
- 10.1.3. Modifiers
- 10.1.3.1. Acidic Depressants
- 10.1.3.2. pH modifiers
- 10.1.3.3. Activators
- 10.1.3.4. Deactivators
- 10.1.4. Other Reagent Types
- 10.1.1. Collectors
- 10.2. Market Analysis, Insights and Forecast - by End-user Industry
- 10.2.1. Mining
- 10.2.2. Pulp and Paper
- 10.2.3. Industrial Waste and Sewage Treatment
- 10.2.4. Other End-user Industries
- 10.1. Market Analysis, Insights and Forecast - by Reagent Type
- 11. Middle East and Africa Froth Flotation Chemical Market Analysis, Insights and Forecast, 2020-2032
- 11.1. Market Analysis, Insights and Forecast - by Reagent Type
- 11.1.1. Collectors
- 11.1.1.1. Cationic
- 11.1.1.2. Anionic
- 11.1.1.3. Non-ionic
- 11.1.2. Frothers
- 11.1.2.1. Acidic
- 11.1.2.2. Basic
- 11.1.2.3. Neutral
- 11.1.3. Modifiers
- 11.1.3.1. Acidic Depressants
- 11.1.3.2. pH modifiers
- 11.1.3.3. Activators
- 11.1.3.4. Deactivators
- 11.1.4. Other Reagent Types
- 11.1.1. Collectors
- 11.2. Market Analysis, Insights and Forecast - by End-user Industry
- 11.2.1. Mining
- 11.2.2. Pulp and Paper
- 11.2.3. Industrial Waste and Sewage Treatment
- 11.2.4. Other End-user Industries
- 11.1. Market Analysis, Insights and Forecast - by Reagent Type
- 12. Competitive Analysis
- 12.1. Company Profiles
- 12.1.1 Arkema
- 12.1.1.1. Company Overview
- 12.1.1.2. Products
- 12.1.1.3. Company Financials
- 12.1.1.4. SWOT Analysis
- 12.1.2 Air Products and Chemicals Inc
- 12.1.2.1. Company Overview
- 12.1.2.2. Products
- 12.1.2.3. Company Financials
- 12.1.2.4. SWOT Analysis
- 12.1.3 Solvay
- 12.1.3.1. Company Overview
- 12.1.3.2. Products
- 12.1.3.3. Company Financials
- 12.1.3.4. SWOT Analysis
- 12.1.4 Chevron Phillips Chemical Company LLC
- 12.1.4.1. Company Overview
- 12.1.4.2. Products
- 12.1.4.3. Company Financials
- 12.1.4.4. SWOT Analysis
- 12.1.5 NASACO
- 12.1.5.1. Company Overview
- 12.1.5.2. Products
- 12.1.5.3. Company Financials
- 12.1.5.4. SWOT Analysis
- 12.1.6 Nouryon*List Not Exhaustive
- 12.1.6.1. Company Overview
- 12.1.6.2. Products
- 12.1.6.3. Company Financials
- 12.1.6.4. SWOT Analysis
- 12.1.7 BASF SE
- 12.1.7.1. Company Overview
- 12.1.7.2. Products
- 12.1.7.3. Company Financials
- 12.1.7.4. SWOT Analysis
- 12.1.8 Kemira
- 12.1.8.1. Company Overview
- 12.1.8.2. Products
- 12.1.8.3. Company Financials
- 12.1.8.4. SWOT Analysis
- 12.1.9 Dow
- 12.1.9.1. Company Overview
- 12.1.9.2. Products
- 12.1.9.3. Company Financials
- 12.1.9.4. SWOT Analysis
- 12.1.10 CLARIANT
- 12.1.10.1. Company Overview
- 12.1.10.2. Products
- 12.1.10.3. Company Financials
- 12.1.10.4. SWOT Analysis
- 12.1.1 Arkema
- 12.2. Market Entropy
- 12.2.1 Company's Key Areas Served
- 12.2.2 Recent Developments
- 12.3. Company Market Share Analysis 2025
- 12.3.1 Top 5 Companies Market Share Analysis
- 12.3.2 Top 3 Companies Market Share Analysis
- 12.4. List of Potential Customers
- 13. Research Methodology
List of Figures
- Figure 1: Global Froth Flotation Chemical Market Revenue Breakdown (Million, %) by Region 2025 & 2033
- Figure 2: Global Froth Flotation Chemical Market Volume Breakdown (K Tons, %) by Region 2025 & 2033
- Figure 3: Asia Pacific Froth Flotation Chemical Market Revenue (Million), by Reagent Type 2025 & 2033
- Figure 4: Asia Pacific Froth Flotation Chemical Market Volume (K Tons), by Reagent Type 2025 & 2033
- Figure 5: Asia Pacific Froth Flotation Chemical Market Revenue Share (%), by Reagent Type 2025 & 2033
- Figure 6: Asia Pacific Froth Flotation Chemical Market Volume Share (%), by Reagent Type 2025 & 2033
- Figure 7: Asia Pacific Froth Flotation Chemical Market Revenue (Million), by End-user Industry 2025 & 2033
- Figure 8: Asia Pacific Froth Flotation Chemical Market Volume (K Tons), by End-user Industry 2025 & 2033
- Figure 9: Asia Pacific Froth Flotation Chemical Market Revenue Share (%), by End-user Industry 2025 & 2033
- Figure 10: Asia Pacific Froth Flotation Chemical Market Volume Share (%), by End-user Industry 2025 & 2033
- Figure 11: Asia Pacific Froth Flotation Chemical Market Revenue (Million), by Country 2025 & 2033
- Figure 12: Asia Pacific Froth Flotation Chemical Market Volume (K Tons), by Country 2025 & 2033
- Figure 13: Asia Pacific Froth Flotation Chemical Market Revenue Share (%), by Country 2025 & 2033
- Figure 14: Asia Pacific Froth Flotation Chemical Market Volume Share (%), by Country 2025 & 2033
- Figure 15: North America Froth Flotation Chemical Market Revenue (Million), by Reagent Type 2025 & 2033
- Figure 16: North America Froth Flotation Chemical Market Volume (K Tons), by Reagent Type 2025 & 2033
- Figure 17: North America Froth Flotation Chemical Market Revenue Share (%), by Reagent Type 2025 & 2033
- Figure 18: North America Froth Flotation Chemical Market Volume Share (%), by Reagent Type 2025 & 2033
- Figure 19: North America Froth Flotation Chemical Market Revenue (Million), by End-user Industry 2025 & 2033
- Figure 20: North America Froth Flotation Chemical Market Volume (K Tons), by End-user Industry 2025 & 2033
- Figure 21: North America Froth Flotation Chemical Market Revenue Share (%), by End-user Industry 2025 & 2033
- Figure 22: North America Froth Flotation Chemical Market Volume Share (%), by End-user Industry 2025 & 2033
- Figure 23: North America Froth Flotation Chemical Market Revenue (Million), by Country 2025 & 2033
- Figure 24: North America Froth Flotation Chemical Market Volume (K Tons), by Country 2025 & 2033
- Figure 25: North America Froth Flotation Chemical Market Revenue Share (%), by Country 2025 & 2033
- Figure 26: North America Froth Flotation Chemical Market Volume Share (%), by Country 2025 & 2033
- Figure 27: Europe Froth Flotation Chemical Market Revenue (Million), by Reagent Type 2025 & 2033
- Figure 28: Europe Froth Flotation Chemical Market Volume (K Tons), by Reagent Type 2025 & 2033
- Figure 29: Europe Froth Flotation Chemical Market Revenue Share (%), by Reagent Type 2025 & 2033
- Figure 30: Europe Froth Flotation Chemical Market Volume Share (%), by Reagent Type 2025 & 2033
- Figure 31: Europe Froth Flotation Chemical Market Revenue (Million), by End-user Industry 2025 & 2033
- Figure 32: Europe Froth Flotation Chemical Market Volume (K Tons), by End-user Industry 2025 & 2033
- Figure 33: Europe Froth Flotation Chemical Market Revenue Share (%), by End-user Industry 2025 & 2033
- Figure 34: Europe Froth Flotation Chemical Market Volume Share (%), by End-user Industry 2025 & 2033
- Figure 35: Europe Froth Flotation Chemical Market Revenue (Million), by Country 2025 & 2033
- Figure 36: Europe Froth Flotation Chemical Market Volume (K Tons), by Country 2025 & 2033
- Figure 37: Europe Froth Flotation Chemical Market Revenue Share (%), by Country 2025 & 2033
- Figure 38: Europe Froth Flotation Chemical Market Volume Share (%), by Country 2025 & 2033
- Figure 39: South America Froth Flotation Chemical Market Revenue (Million), by Reagent Type 2025 & 2033
- Figure 40: South America Froth Flotation Chemical Market Volume (K Tons), by Reagent Type 2025 & 2033
- Figure 41: South America Froth Flotation Chemical Market Revenue Share (%), by Reagent Type 2025 & 2033
- Figure 42: South America Froth Flotation Chemical Market Volume Share (%), by Reagent Type 2025 & 2033
- Figure 43: South America Froth Flotation Chemical Market Revenue (Million), by End-user Industry 2025 & 2033
- Figure 44: South America Froth Flotation Chemical Market Volume (K Tons), by End-user Industry 2025 & 2033
- Figure 45: South America Froth Flotation Chemical Market Revenue Share (%), by End-user Industry 2025 & 2033
- Figure 46: South America Froth Flotation Chemical Market Volume Share (%), by End-user Industry 2025 & 2033
- Figure 47: South America Froth Flotation Chemical Market Revenue (Million), by Country 2025 & 2033
- Figure 48: South America Froth Flotation Chemical Market Volume (K Tons), by Country 2025 & 2033
- Figure 49: South America Froth Flotation Chemical Market Revenue Share (%), by Country 2025 & 2033
- Figure 50: South America Froth Flotation Chemical Market Volume Share (%), by Country 2025 & 2033
- Figure 51: Middle East and Africa Froth Flotation Chemical Market Revenue (Million), by Reagent Type 2025 & 2033
- Figure 52: Middle East and Africa Froth Flotation Chemical Market Volume (K Tons), by Reagent Type 2025 & 2033
- Figure 53: Middle East and Africa Froth Flotation Chemical Market Revenue Share (%), by Reagent Type 2025 & 2033
- Figure 54: Middle East and Africa Froth Flotation Chemical Market Volume Share (%), by Reagent Type 2025 & 2033
- Figure 55: Middle East and Africa Froth Flotation Chemical Market Revenue (Million), by End-user Industry 2025 & 2033
- Figure 56: Middle East and Africa Froth Flotation Chemical Market Volume (K Tons), by End-user Industry 2025 & 2033
- Figure 57: Middle East and Africa Froth Flotation Chemical Market Revenue Share (%), by End-user Industry 2025 & 2033
- Figure 58: Middle East and Africa Froth Flotation Chemical Market Volume Share (%), by End-user Industry 2025 & 2033
- Figure 59: Middle East and Africa Froth Flotation Chemical Market Revenue (Million), by Country 2025 & 2033
- Figure 60: Middle East and Africa Froth Flotation Chemical Market Volume (K Tons), by Country 2025 & 2033
- Figure 61: Middle East and Africa Froth Flotation Chemical Market Revenue Share (%), by Country 2025 & 2033
- Figure 62: Middle East and Africa Froth Flotation Chemical Market Volume Share (%), by Country 2025 & 2033
List of Tables
- Table 1: Global Froth Flotation Chemical Market Revenue Million Forecast, by Reagent Type 2020 & 2033
- Table 2: Global Froth Flotation Chemical Market Volume K Tons Forecast, by Reagent Type 2020 & 2033
- Table 3: Global Froth Flotation Chemical Market Revenue Million Forecast, by End-user Industry 2020 & 2033
- Table 4: Global Froth Flotation Chemical Market Volume K Tons Forecast, by End-user Industry 2020 & 2033
- Table 5: Global Froth Flotation Chemical Market Revenue Million Forecast, by Region 2020 & 2033
- Table 6: Global Froth Flotation Chemical Market Volume K Tons Forecast, by Region 2020 & 2033
- Table 7: Global Froth Flotation Chemical Market Revenue Million Forecast, by Reagent Type 2020 & 2033
- Table 8: Global Froth Flotation Chemical Market Volume K Tons Forecast, by Reagent Type 2020 & 2033
- Table 9: Global Froth Flotation Chemical Market Revenue Million Forecast, by End-user Industry 2020 & 2033
- Table 10: Global Froth Flotation Chemical Market Volume K Tons Forecast, by End-user Industry 2020 & 2033
- Table 11: Global Froth Flotation Chemical Market Revenue Million Forecast, by Country 2020 & 2033
- Table 12: Global Froth Flotation Chemical Market Volume K Tons Forecast, by Country 2020 & 2033
- Table 13: China Froth Flotation Chemical Market Revenue (Million) Forecast, by Application 2020 & 2033
- Table 14: China Froth Flotation Chemical Market Volume (K Tons) Forecast, by Application 2020 & 2033
- Table 15: India Froth Flotation Chemical Market Revenue (Million) Forecast, by Application 2020 & 2033
- Table 16: India Froth Flotation Chemical Market Volume (K Tons) Forecast, by Application 2020 & 2033
- Table 17: Japan Froth Flotation Chemical Market Revenue (Million) Forecast, by Application 2020 & 2033
- Table 18: Japan Froth Flotation Chemical Market Volume (K Tons) Forecast, by Application 2020 & 2033
- Table 19: South Korea Froth Flotation Chemical Market Revenue (Million) Forecast, by Application 2020 & 2033
- Table 20: South Korea Froth Flotation Chemical Market Volume (K Tons) Forecast, by Application 2020 & 2033
- Table 21: Rest of Asia Pacific Froth Flotation Chemical Market Revenue (Million) Forecast, by Application 2020 & 2033
- Table 22: Rest of Asia Pacific Froth Flotation Chemical Market Volume (K Tons) Forecast, by Application 2020 & 2033
- Table 23: Global Froth Flotation Chemical Market Revenue Million Forecast, by Reagent Type 2020 & 2033
- Table 24: Global Froth Flotation Chemical Market Volume K Tons Forecast, by Reagent Type 2020 & 2033
- Table 25: Global Froth Flotation Chemical Market Revenue Million Forecast, by End-user Industry 2020 & 2033
- Table 26: Global Froth Flotation Chemical Market Volume K Tons Forecast, by End-user Industry 2020 & 2033
- Table 27: Global Froth Flotation Chemical Market Revenue Million Forecast, by Country 2020 & 2033
- Table 28: Global Froth Flotation Chemical Market Volume K Tons Forecast, by Country 2020 & 2033
- Table 29: United States Froth Flotation Chemical Market Revenue (Million) Forecast, by Application 2020 & 2033
- Table 30: United States Froth Flotation Chemical Market Volume (K Tons) Forecast, by Application 2020 & 2033
- Table 31: Canada Froth Flotation Chemical Market Revenue (Million) Forecast, by Application 2020 & 2033
- Table 32: Canada Froth Flotation Chemical Market Volume (K Tons) Forecast, by Application 2020 & 2033
- Table 33: Mexico Froth Flotation Chemical Market Revenue (Million) Forecast, by Application 2020 & 2033
- Table 34: Mexico Froth Flotation Chemical Market Volume (K Tons) Forecast, by Application 2020 & 2033
- Table 35: Global Froth Flotation Chemical Market Revenue Million Forecast, by Reagent Type 2020 & 2033
- Table 36: Global Froth Flotation Chemical Market Volume K Tons Forecast, by Reagent Type 2020 & 2033
- Table 37: Global Froth Flotation Chemical Market Revenue Million Forecast, by End-user Industry 2020 & 2033
- Table 38: Global Froth Flotation Chemical Market Volume K Tons Forecast, by End-user Industry 2020 & 2033
- Table 39: Global Froth Flotation Chemical Market Revenue Million Forecast, by Country 2020 & 2033
- Table 40: Global Froth Flotation Chemical Market Volume K Tons Forecast, by Country 2020 & 2033
- Table 41: Germany Froth Flotation Chemical Market Revenue (Million) Forecast, by Application 2020 & 2033
- Table 42: Germany Froth Flotation Chemical Market Volume (K Tons) Forecast, by Application 2020 & 2033
- Table 43: United Kingdom Froth Flotation Chemical Market Revenue (Million) Forecast, by Application 2020 & 2033
- Table 44: United Kingdom Froth Flotation Chemical Market Volume (K Tons) Forecast, by Application 2020 & 2033
- Table 45: France Froth Flotation Chemical Market Revenue (Million) Forecast, by Application 2020 & 2033
- Table 46: France Froth Flotation Chemical Market Volume (K Tons) Forecast, by Application 2020 & 2033
- Table 47: Italy Froth Flotation Chemical Market Revenue (Million) Forecast, by Application 2020 & 2033
- Table 48: Italy Froth Flotation Chemical Market Volume (K Tons) Forecast, by Application 2020 & 2033
- Table 49: Rest of Europe Froth Flotation Chemical Market Revenue (Million) Forecast, by Application 2020 & 2033
- Table 50: Rest of Europe Froth Flotation Chemical Market Volume (K Tons) Forecast, by Application 2020 & 2033
- Table 51: Global Froth Flotation Chemical Market Revenue Million Forecast, by Reagent Type 2020 & 2033
- Table 52: Global Froth Flotation Chemical Market Volume K Tons Forecast, by Reagent Type 2020 & 2033
- Table 53: Global Froth Flotation Chemical Market Revenue Million Forecast, by End-user Industry 2020 & 2033
- Table 54: Global Froth Flotation Chemical Market Volume K Tons Forecast, by End-user Industry 2020 & 2033
- Table 55: Global Froth Flotation Chemical Market Revenue Million Forecast, by Country 2020 & 2033
- Table 56: Global Froth Flotation Chemical Market Volume K Tons Forecast, by Country 2020 & 2033
- Table 57: Brazil Froth Flotation Chemical Market Revenue (Million) Forecast, by Application 2020 & 2033
- Table 58: Brazil Froth Flotation Chemical Market Volume (K Tons) Forecast, by Application 2020 & 2033
- Table 59: Argentina Froth Flotation Chemical Market Revenue (Million) Forecast, by Application 2020 & 2033
- Table 60: Argentina Froth Flotation Chemical Market Volume (K Tons) Forecast, by Application 2020 & 2033
- Table 61: Rest of South America Froth Flotation Chemical Market Revenue (Million) Forecast, by Application 2020 & 2033
- Table 62: Rest of South America Froth Flotation Chemical Market Volume (K Tons) Forecast, by Application 2020 & 2033
- Table 63: Global Froth Flotation Chemical Market Revenue Million Forecast, by Reagent Type 2020 & 2033
- Table 64: Global Froth Flotation Chemical Market Volume K Tons Forecast, by Reagent Type 2020 & 2033
- Table 65: Global Froth Flotation Chemical Market Revenue Million Forecast, by End-user Industry 2020 & 2033
- Table 66: Global Froth Flotation Chemical Market Volume K Tons Forecast, by End-user Industry 2020 & 2033
- Table 67: Global Froth Flotation Chemical Market Revenue Million Forecast, by Country 2020 & 2033
- Table 68: Global Froth Flotation Chemical Market Volume K Tons Forecast, by Country 2020 & 2033
- Table 69: Saudi Arabia Froth Flotation Chemical Market Revenue (Million) Forecast, by Application 2020 & 2033
- Table 70: Saudi Arabia Froth Flotation Chemical Market Volume (K Tons) Forecast, by Application 2020 & 2033
- Table 71: South Africa Froth Flotation Chemical Market Revenue (Million) Forecast, by Application 2020 & 2033
- Table 72: South Africa Froth Flotation Chemical Market Volume (K Tons) Forecast, by Application 2020 & 2033
- Table 73: Rest of Middle East and Africa Froth Flotation Chemical Market Revenue (Million) Forecast, by Application 2020 & 2033
- Table 74: Rest of Middle East and Africa Froth Flotation Chemical Market Volume (K Tons) Forecast, by Application 2020 & 2033
Frequently Asked Questions
1. What is the projected Compound Annual Growth Rate (CAGR) of the Froth Flotation Chemical Market?
The projected CAGR is approximately > 4.50%.
2. Which companies are prominent players in the Froth Flotation Chemical Market?
Key companies in the market include Arkema, Air Products and Chemicals Inc, Solvay, Chevron Phillips Chemical Company LLC, NASACO, Nouryon*List Not Exhaustive, BASF SE, Kemira, Dow, CLARIANT.
3. What are the main segments of the Froth Flotation Chemical Market?
The market segments include Reagent Type, End-user Industry.
4. Can you provide details about the market size?
The market size is estimated to be USD 1741.2 Million as of 2022.
5. What are some drivers contributing to market growth?
Rising Demand for Froth Flotation Chemicals in Asia-Pacific; Increasing Mining Activities in Canada and Mexico; Other Drivers.
6. What are the notable trends driving market growth?
Rising Demand from the Mining Industry.
7. Are there any restraints impacting market growth?
Stringent Policies and Changing Regulatory Landscape Exist in North America and Europe; Other Restraints.
8. Can you provide examples of recent developments in the market?
October 2022: Solvay launched a digital mining solution, 'SmartFloat,' an AI-based reagent optimization system. It helps mining companies capture more value from their data and optimize froth flotation processes.
9. What pricing options are available for accessing the report?
Pricing options include single-user, multi-user, and enterprise licenses priced at USD 4750, USD 5250, and USD 8750 respectively.
10. Is the market size provided in terms of value or volume?
The market size is provided in terms of value, measured in Million and volume, measured in K Tons.
11. Are there any specific market keywords associated with the report?
Yes, the market keyword associated with the report is "Froth Flotation Chemical Market," which aids in identifying and referencing the specific market segment covered.
12. How do I determine which pricing option suits my needs best?
The pricing options vary based on user requirements and access needs. Individual users may opt for single-user licenses, while businesses requiring broader access may choose multi-user or enterprise licenses for cost-effective access to the report.
13. Are there any additional resources or data provided in the Froth Flotation Chemical Market report?
While the report offers comprehensive insights, it's advisable to review the specific contents or supplementary materials provided to ascertain if additional resources or data are available.
14. How can I stay updated on further developments or reports in the Froth Flotation Chemical Market?
To stay informed about further developments, trends, and reports in the Froth Flotation Chemical Market, consider subscribing to industry newsletters, following relevant companies and organizations, or regularly checking reputable industry news sources and publications.
Methodology
Step 1 - Identification of Relevant Samples Size from Population Database


Step 2 - Approaches for Defining Global Market Size (Value, Volume* & Price*)

Note*: In applicable scenarios
Step 3 - Data Sources
Primary Research
- Web Analytics
- Survey Reports
- Research Institute
- Latest Research Reports
- Opinion Leaders
Secondary Research
- Annual Reports
- White Paper
- Latest Press Release
- Industry Association
- Paid Database
- Investor Presentations

Step 4 - Data Triangulation
Involves using different sources of information in order to increase the validity of a study
These sources are likely to be stakeholders in a program - participants, other researchers, program staff, other community members, and so on.
Then we put all data in single framework & apply various statistical tools to find out the dynamic on the market.
During the analysis stage, feedback from the stakeholder groups would be compared to determine areas of agreement as well as areas of divergence