

Key Insights
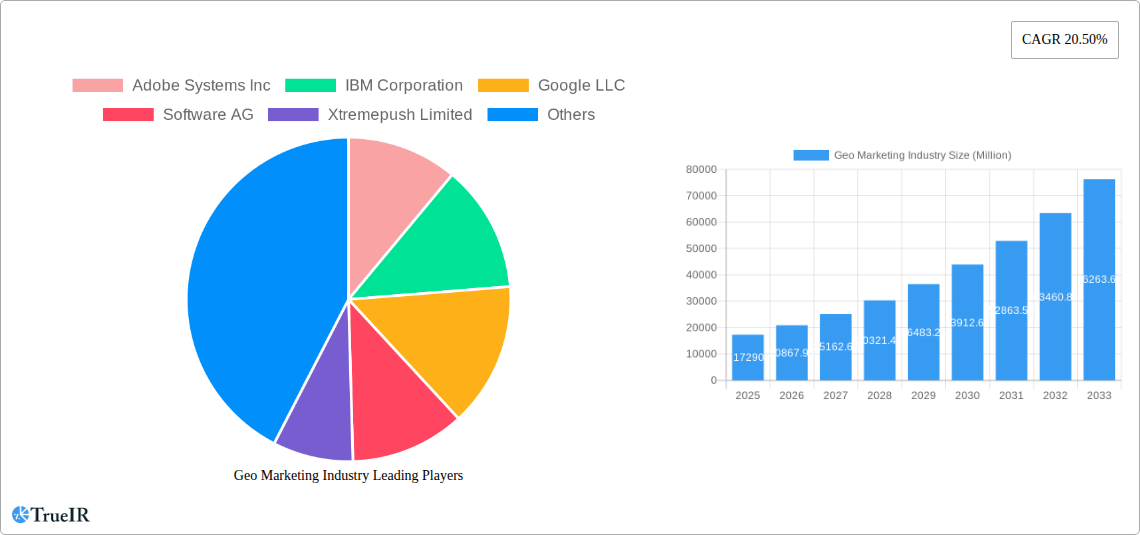
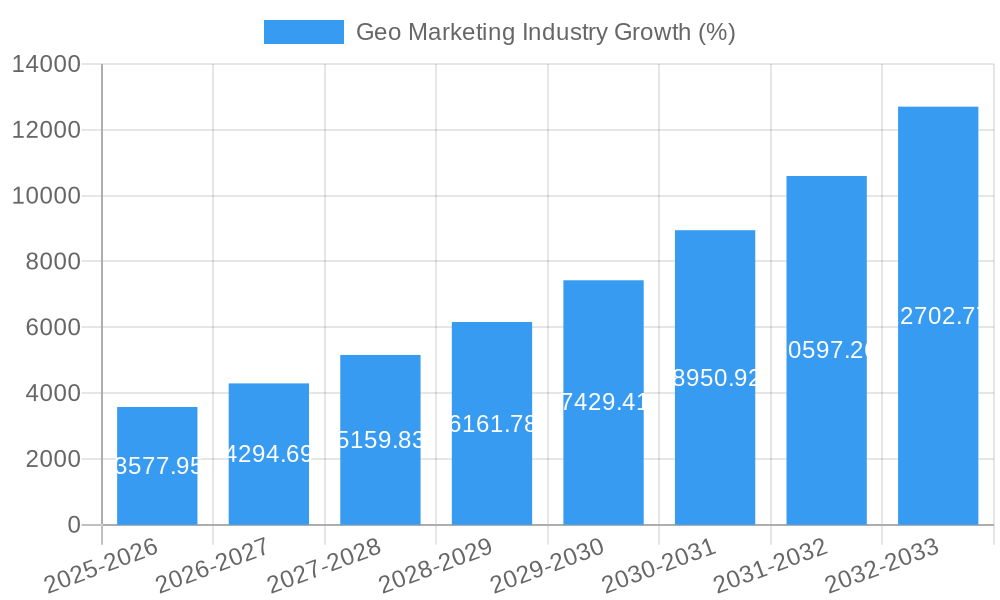
The global geospatial marketing industry, valued at $17.29 billion in 2025, is experiencing robust growth, projected to expand at a compound annual growth rate (CAGR) of 20.50% from 2025 to 2033. This surge is driven by the increasing adoption of location-based services, the rise of mobile marketing and location intelligence, and the growing need for precise targeting in marketing campaigns. Businesses across diverse sectors, including BFSI, IT and telecommunications, retail and e-commerce, and media and entertainment, are leveraging geospatial data and analytics to optimize their marketing strategies, personalize customer experiences, and improve ROI. The cloud-based deployment model is gaining significant traction due to its scalability, cost-effectiveness, and ease of access, while the software segment constitutes a significant portion of the market share, driven by the need for sophisticated geospatial analytics tools. Challenges include data privacy concerns, the high cost of implementation for some solutions, and the need for skilled professionals to manage and interpret geospatial data effectively. However, advancements in technologies such as AI and machine learning, coupled with the increasing availability of high-quality geospatial data, are poised to propel further market growth.
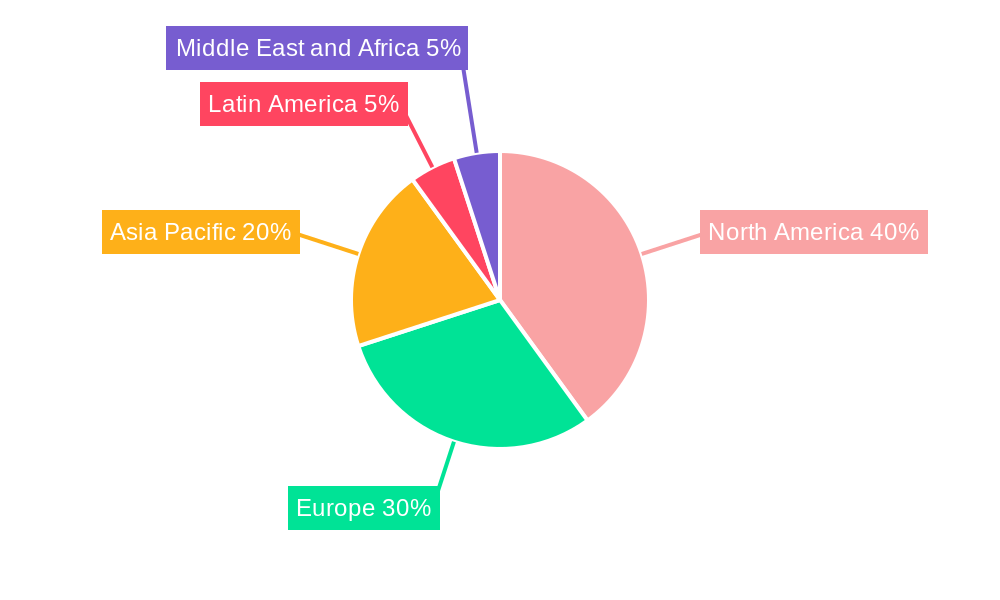
The North American market currently holds a dominant share, reflecting the region's advanced technological infrastructure and high adoption of digital marketing. However, the Asia-Pacific region is expected to witness substantial growth during the forecast period, driven by increasing smartphone penetration, rising internet usage, and a burgeoning e-commerce landscape. The European market also presents significant opportunities, fueled by stringent data privacy regulations driving demand for compliant and precise targeting solutions. The outdoor geospatial marketing segment is growing due to location-based advertising technologies becoming increasingly sophisticated and accurate. As businesses seek to connect more directly and effectively with their target demographics, tailored location-based campaigns will continue to be a critical component of successful marketing initiatives, making geospatial marketing an increasingly indispensable tool.
Geo Marketing Industry Report: A Comprehensive Analysis of Market Trends, Opportunities, and Challenges (2019-2033)
This dynamic report provides a comprehensive analysis of the Geo Marketing industry, offering invaluable insights for businesses, investors, and stakeholders. With a study period spanning 2019-2033, a base year of 2025, and a forecast period of 2025-2033, this report leverages extensive data analysis to illuminate key market trends and future potential. The market is valued at xx Million in 2025 and is projected to reach xx Million by 2033, exhibiting a robust CAGR of xx%. This report delves into the competitive landscape, identifies dominant market segments, and analyzes key growth drivers and challenges, providing a roadmap for success in this rapidly evolving sector.
Geo Marketing Industry Market Structure & Competitive Landscape
The Geo Marketing industry exhibits a moderately concentrated market structure, with several key players vying for market share. The Herfindahl-Hirschman Index (HHI) is estimated to be xx, suggesting a competitive yet not overly fragmented landscape. Innovation is a crucial driver, with companies continually developing advanced geospatial analytics tools and integrating them with other technologies like AI and machine learning. Regulatory frameworks surrounding data privacy and usage significantly impact the market, necessitating compliance with regulations like GDPR and CCPA. Product substitution is relatively limited, as specialized geo-marketing solutions are difficult to replicate easily.
The end-user segmentation is diverse, spanning BFSI, IT & Telecommunications, Retail & E-commerce, Media & Entertainment, Travel & Hospitality, and other sectors. M&A activity has been relatively modest, with xx significant mergers and acquisitions recorded between 2019 and 2024, indicating a focus on organic growth and strategic partnerships.
- Market Concentration: HHI estimated at xx
- Innovation Drivers: AI, Machine Learning, Big Data Analytics
- Regulatory Impacts: GDPR, CCPA, and other regional data privacy laws
- Product Substitutes: Limited direct substitutes; competition mainly driven by feature differentiation.
- End-User Segmentation: BFSI, IT & Telecom, Retail & E-commerce, Media & Entertainment, Travel & Hospitality, Others.
- M&A Trends: xx deals recorded between 2019-2024.
Geo Marketing Industry Market Trends & Opportunities
The Geo Marketing industry is experiencing significant growth, driven by the increasing adoption of location-based services, the proliferation of mobile devices, and the expanding availability of high-quality geospatial data. Market size growth is robust, with a projected CAGR of xx% during the forecast period. Technological advancements, such as improved mapping technologies and advanced analytics capabilities, are further fueling market expansion. Consumer preferences for personalized and location-relevant experiences are creating significant opportunities for businesses to leverage geo-marketing strategies effectively. Competitive dynamics are characterized by ongoing innovation, strategic partnerships, and a focus on data-driven insights. The market penetration rate is currently estimated at xx% and is projected to rise to xx% by 2033.
Dominant Markets & Segments in Geo Marketing Industry
The North American market currently holds a dominant position in the Geo Marketing industry, driven by advanced technological infrastructure, a strong presence of key players, and high adoption rates across various end-user sectors. However, the Asia-Pacific region is poised for substantial growth due to increasing digitalization and expanding mobile penetration.
- By Components: The Software segment is the largest, accounting for xx Million in revenue in 2025, followed by Services at xx Million.
- By Deployment: Cloud-based solutions are rapidly gaining traction, with projected revenue of xx Million in 2025, surpassing On-Premise deployments.
- By Location: Outdoor geo-marketing currently dominates, given its wider reach, followed by Indoor solutions, which are witnessing steady growth in specific sectors like retail.
- By End-User Industry: Retail and E-commerce is the leading segment, driven by its high dependence on targeted location-based campaigns. BFSI is another significant adopter, using geolocation for fraud prevention and targeted financial offers.
Key Growth Drivers:
- North America: Strong technological infrastructure, presence of major players, high adoption rates.
- Asia-Pacific: Rapid digitalization, rising mobile penetration, increasing investment in location-based services.
- Retail & E-commerce: High reliance on targeted location-based advertising.
- BFSI: Focus on fraud prevention and personalized financial services.
Geo Marketing Industry Product Analysis
The Geo Marketing industry offers a diverse range of products, including software platforms for geospatial data analysis, location intelligence tools, and data visualization dashboards. These solutions enable businesses to effectively plan marketing campaigns, optimize location selection, and personalize customer experiences. Key competitive advantages are derived from the accuracy and comprehensiveness of the underlying geospatial data, the sophistication of the analytical algorithms, and the user-friendliness of the software interfaces. Advancements in AI and machine learning are continuously enhancing the capabilities of these products.
Key Drivers, Barriers & Challenges in Geo Marketing Industry
Key Drivers:
The Geo Marketing industry is driven by several factors, including the increased availability of location data, advancements in data analytics techniques, and the growing need for personalized marketing campaigns. Government initiatives promoting digitalization further contribute to market expansion. The rising adoption of location-based services by businesses across various sectors fuels industry growth.
Challenges and Restraints:
Data privacy concerns, especially regarding GDPR and CCPA compliance, pose significant challenges to the industry. The high cost of data acquisition and processing, alongside the complexity of integrating geo-marketing data with existing systems, can also hinder adoption. Furthermore, competition among established players and emerging startups intensifies market pressure.
Growth Drivers in the Geo Marketing Industry Market
Key drivers include increasing adoption of location-based services, advancements in geospatial data analytics, and the rising need for personalized marketing. Government initiatives promoting digital economies and expanding digital infrastructure further boost market expansion.
Challenges Impacting Geo Marketing Industry Growth
Data privacy regulations, complex integration processes, and the high cost of data acquisition and processing present significant challenges. Intense competition and maintaining data accuracy also restrict growth.
Key Players Shaping the Geo Marketing Industry Market
- Adobe Systems Inc
- IBM Corporation
- Google LLC
- Software AG
- Xtremepush Limited
- Cisco Systems Inc
- Microsoft Corporation
- Ericsson Inc
- Oracle Corporation
- ESRI Business Information Solutions Inc
- Qualcomm Inc
Significant Geo Marketing Industry Industry Milestones
- January 2023: MapZot.AI launches mobile location data solutions, providing businesses with valuable insights into consumer behavior for site selection and portfolio optimization.
- April 2022: Precisely introduces enhanced geo-addressing capabilities, improving address verification and data cleansing in various business systems across Europe and North America.
Future Outlook for Geo Marketing Industry Market
The Geo Marketing industry is poised for continued growth, fueled by technological advancements and the increasing demand for personalized location-based marketing. Strategic partnerships and investments in AI and machine learning will drive innovation and market expansion. The integration of geo-marketing data with other marketing channels will further enhance campaign effectiveness and unlock new opportunities for businesses to engage customers effectively.
Geo Marketing Industry Segmentation
-
1. Components
- 1.1. Software
- 1.2. Services
-
2. Deployment
- 2.1. Cloud
- 2.2. On-Premise
-
3. Location
- 3.1. Indoor
- 3.2. Outdoor
-
4. End-User Industry
- 4.1. BFSI
- 4.2. IT and Telecommunications
- 4.3. Retail and E-commerce
- 4.4. Media and Entertainment
- 4.5. Travel and Hospitality
- 4.6. Other End-user Industries
Geo Marketing Industry Segmentation By Geography
- 1. North America
- 2. Europe
- 3. Asia Pacific
- 4. Latin America
- 5. Middle East and Africa
Geo Marketing Industry REPORT HIGHLIGHTS
| Aspects | Details |
|---|---|
| Study Period | 2019-2033 |
| Base Year | 2024 |
| Estimated Year | 2025 |
| Forecast Period | 2025-2033 |
| Historical Period | 2019-2024 |
| Growth Rate | CAGR of 20.50% from 2019-2033 |
| Segmentation |
|
Table of Contents
- 1. Introduction
- 1.1. Research Scope
- 1.2. Market Segmentation
- 1.3. Research Methodology
- 1.4. Definitions and Assumptions
- 2. Executive Summary
- 2.1. Introduction
- 3. Market Dynamics
- 3.1. Introduction
- 3.2. Market Drivers
- 3.2.1. Increasing Adoption of Emerging Technologies in Marketing Sector; Increasing Demand for Location-Based Intelligence to Enhance the Business Revenue
- 3.3. Market Restrains
- 3.3.1. Increasing Security and Privacy Concerns Among Enterprises
- 3.4. Market Trends
- 3.4.1. Services Components Segment is Expected to Hold Significant Market Share
- 4. Market Factor Analysis
- 4.1. Porters Five Forces
- 4.2. Supply/Value Chain
- 4.3. PESTEL analysis
- 4.4. Market Entropy
- 4.5. Patent/Trademark Analysis
- 5. Global Geo Marketing Industry Analysis, Insights and Forecast, 2019-2031
- 5.1. Market Analysis, Insights and Forecast - by Components
- 5.1.1. Software
- 5.1.2. Services
- 5.2. Market Analysis, Insights and Forecast - by Deployment
- 5.2.1. Cloud
- 5.2.2. On-Premise
- 5.3. Market Analysis, Insights and Forecast - by Location
- 5.3.1. Indoor
- 5.3.2. Outdoor
- 5.4. Market Analysis, Insights and Forecast - by End-User Industry
- 5.4.1. BFSI
- 5.4.2. IT and Telecommunications
- 5.4.3. Retail and E-commerce
- 5.4.4. Media and Entertainment
- 5.4.5. Travel and Hospitality
- 5.4.6. Other End-user Industries
- 5.5. Market Analysis, Insights and Forecast - by Region
- 5.5.1. North America
- 5.5.2. Europe
- 5.5.3. Asia Pacific
- 5.5.4. Latin America
- 5.5.5. Middle East and Africa
- 5.1. Market Analysis, Insights and Forecast - by Components
- 6. North America Geo Marketing Industry Analysis, Insights and Forecast, 2019-2031
- 6.1. Market Analysis, Insights and Forecast - by Components
- 6.1.1. Software
- 6.1.2. Services
- 6.2. Market Analysis, Insights and Forecast - by Deployment
- 6.2.1. Cloud
- 6.2.2. On-Premise
- 6.3. Market Analysis, Insights and Forecast - by Location
- 6.3.1. Indoor
- 6.3.2. Outdoor
- 6.4. Market Analysis, Insights and Forecast - by End-User Industry
- 6.4.1. BFSI
- 6.4.2. IT and Telecommunications
- 6.4.3. Retail and E-commerce
- 6.4.4. Media and Entertainment
- 6.4.5. Travel and Hospitality
- 6.4.6. Other End-user Industries
- 6.1. Market Analysis, Insights and Forecast - by Components
- 7. Europe Geo Marketing Industry Analysis, Insights and Forecast, 2019-2031
- 7.1. Market Analysis, Insights and Forecast - by Components
- 7.1.1. Software
- 7.1.2. Services
- 7.2. Market Analysis, Insights and Forecast - by Deployment
- 7.2.1. Cloud
- 7.2.2. On-Premise
- 7.3. Market Analysis, Insights and Forecast - by Location
- 7.3.1. Indoor
- 7.3.2. Outdoor
- 7.4. Market Analysis, Insights and Forecast - by End-User Industry
- 7.4.1. BFSI
- 7.4.2. IT and Telecommunications
- 7.4.3. Retail and E-commerce
- 7.4.4. Media and Entertainment
- 7.4.5. Travel and Hospitality
- 7.4.6. Other End-user Industries
- 7.1. Market Analysis, Insights and Forecast - by Components
- 8. Asia Pacific Geo Marketing Industry Analysis, Insights and Forecast, 2019-2031
- 8.1. Market Analysis, Insights and Forecast - by Components
- 8.1.1. Software
- 8.1.2. Services
- 8.2. Market Analysis, Insights and Forecast - by Deployment
- 8.2.1. Cloud
- 8.2.2. On-Premise
- 8.3. Market Analysis, Insights and Forecast - by Location
- 8.3.1. Indoor
- 8.3.2. Outdoor
- 8.4. Market Analysis, Insights and Forecast - by End-User Industry
- 8.4.1. BFSI
- 8.4.2. IT and Telecommunications
- 8.4.3. Retail and E-commerce
- 8.4.4. Media and Entertainment
- 8.4.5. Travel and Hospitality
- 8.4.6. Other End-user Industries
- 8.1. Market Analysis, Insights and Forecast - by Components
- 9. Latin America Geo Marketing Industry Analysis, Insights and Forecast, 2019-2031
- 9.1. Market Analysis, Insights and Forecast - by Components
- 9.1.1. Software
- 9.1.2. Services
- 9.2. Market Analysis, Insights and Forecast - by Deployment
- 9.2.1. Cloud
- 9.2.2. On-Premise
- 9.3. Market Analysis, Insights and Forecast - by Location
- 9.3.1. Indoor
- 9.3.2. Outdoor
- 9.4. Market Analysis, Insights and Forecast - by End-User Industry
- 9.4.1. BFSI
- 9.4.2. IT and Telecommunications
- 9.4.3. Retail and E-commerce
- 9.4.4. Media and Entertainment
- 9.4.5. Travel and Hospitality
- 9.4.6. Other End-user Industries
- 9.1. Market Analysis, Insights and Forecast - by Components
- 10. Middle East and Africa Geo Marketing Industry Analysis, Insights and Forecast, 2019-2031
- 10.1. Market Analysis, Insights and Forecast - by Components
- 10.1.1. Software
- 10.1.2. Services
- 10.2. Market Analysis, Insights and Forecast - by Deployment
- 10.2.1. Cloud
- 10.2.2. On-Premise
- 10.3. Market Analysis, Insights and Forecast - by Location
- 10.3.1. Indoor
- 10.3.2. Outdoor
- 10.4. Market Analysis, Insights and Forecast - by End-User Industry
- 10.4.1. BFSI
- 10.4.2. IT and Telecommunications
- 10.4.3. Retail and E-commerce
- 10.4.4. Media and Entertainment
- 10.4.5. Travel and Hospitality
- 10.4.6. Other End-user Industries
- 10.1. Market Analysis, Insights and Forecast - by Components
- 11. North America Geo Marketing Industry Analysis, Insights and Forecast, 2019-2031
- 11.1. Market Analysis, Insights and Forecast - By Country/Sub-region
- 11.1.1.
- 12. Europe Geo Marketing Industry Analysis, Insights and Forecast, 2019-2031
- 12.1. Market Analysis, Insights and Forecast - By Country/Sub-region
- 12.1.1.
- 13. Asia Pacific Geo Marketing Industry Analysis, Insights and Forecast, 2019-2031
- 13.1. Market Analysis, Insights and Forecast - By Country/Sub-region
- 13.1.1.
- 14. Latin America Geo Marketing Industry Analysis, Insights and Forecast, 2019-2031
- 14.1. Market Analysis, Insights and Forecast - By Country/Sub-region
- 14.1.1.
- 15. Middle East and Africa Geo Marketing Industry Analysis, Insights and Forecast, 2019-2031
- 15.1. Market Analysis, Insights and Forecast - By Country/Sub-region
- 15.1.1.
- 16. Competitive Analysis
- 16.1. Global Market Share Analysis 2024
- 16.2. Company Profiles
- 16.2.1 Adobe Systems Inc
- 16.2.1.1. Overview
- 16.2.1.2. Products
- 16.2.1.3. SWOT Analysis
- 16.2.1.4. Recent Developments
- 16.2.1.5. Financials (Based on Availability)
- 16.2.2 IBM Corporation
- 16.2.2.1. Overview
- 16.2.2.2. Products
- 16.2.2.3. SWOT Analysis
- 16.2.2.4. Recent Developments
- 16.2.2.5. Financials (Based on Availability)
- 16.2.3 Google LLC
- 16.2.3.1. Overview
- 16.2.3.2. Products
- 16.2.3.3. SWOT Analysis
- 16.2.3.4. Recent Developments
- 16.2.3.5. Financials (Based on Availability)
- 16.2.4 Software AG
- 16.2.4.1. Overview
- 16.2.4.2. Products
- 16.2.4.3. SWOT Analysis
- 16.2.4.4. Recent Developments
- 16.2.4.5. Financials (Based on Availability)
- 16.2.5 Xtremepush Limited
- 16.2.5.1. Overview
- 16.2.5.2. Products
- 16.2.5.3. SWOT Analysis
- 16.2.5.4. Recent Developments
- 16.2.5.5. Financials (Based on Availability)
- 16.2.6 Cisco Systems Inc
- 16.2.6.1. Overview
- 16.2.6.2. Products
- 16.2.6.3. SWOT Analysis
- 16.2.6.4. Recent Developments
- 16.2.6.5. Financials (Based on Availability)
- 16.2.7 Microsoft Corporation
- 16.2.7.1. Overview
- 16.2.7.2. Products
- 16.2.7.3. SWOT Analysis
- 16.2.7.4. Recent Developments
- 16.2.7.5. Financials (Based on Availability)
- 16.2.8 Ericsson Inc
- 16.2.8.1. Overview
- 16.2.8.2. Products
- 16.2.8.3. SWOT Analysis
- 16.2.8.4. Recent Developments
- 16.2.8.5. Financials (Based on Availability)
- 16.2.9 Oracle Corporation
- 16.2.9.1. Overview
- 16.2.9.2. Products
- 16.2.9.3. SWOT Analysis
- 16.2.9.4. Recent Developments
- 16.2.9.5. Financials (Based on Availability)
- 16.2.10 ESRI Business Information Solutions Inc
- 16.2.10.1. Overview
- 16.2.10.2. Products
- 16.2.10.3. SWOT Analysis
- 16.2.10.4. Recent Developments
- 16.2.10.5. Financials (Based on Availability)
- 16.2.11 Qualcomm Inc
- 16.2.11.1. Overview
- 16.2.11.2. Products
- 16.2.11.3. SWOT Analysis
- 16.2.11.4. Recent Developments
- 16.2.11.5. Financials (Based on Availability)
- 16.2.1 Adobe Systems Inc
List of Figures
- Figure 1: Global Geo Marketing Industry Revenue Breakdown (Million, %) by Region 2024 & 2032
- Figure 2: North America Geo Marketing Industry Revenue (Million), by Country 2024 & 2032
- Figure 3: North America Geo Marketing Industry Revenue Share (%), by Country 2024 & 2032
- Figure 4: Europe Geo Marketing Industry Revenue (Million), by Country 2024 & 2032
- Figure 5: Europe Geo Marketing Industry Revenue Share (%), by Country 2024 & 2032
- Figure 6: Asia Pacific Geo Marketing Industry Revenue (Million), by Country 2024 & 2032
- Figure 7: Asia Pacific Geo Marketing Industry Revenue Share (%), by Country 2024 & 2032
- Figure 8: Latin America Geo Marketing Industry Revenue (Million), by Country 2024 & 2032
- Figure 9: Latin America Geo Marketing Industry Revenue Share (%), by Country 2024 & 2032
- Figure 10: Middle East and Africa Geo Marketing Industry Revenue (Million), by Country 2024 & 2032
- Figure 11: Middle East and Africa Geo Marketing Industry Revenue Share (%), by Country 2024 & 2032
- Figure 12: North America Geo Marketing Industry Revenue (Million), by Components 2024 & 2032
- Figure 13: North America Geo Marketing Industry Revenue Share (%), by Components 2024 & 2032
- Figure 14: North America Geo Marketing Industry Revenue (Million), by Deployment 2024 & 2032
- Figure 15: North America Geo Marketing Industry Revenue Share (%), by Deployment 2024 & 2032
- Figure 16: North America Geo Marketing Industry Revenue (Million), by Location 2024 & 2032
- Figure 17: North America Geo Marketing Industry Revenue Share (%), by Location 2024 & 2032
- Figure 18: North America Geo Marketing Industry Revenue (Million), by End-User Industry 2024 & 2032
- Figure 19: North America Geo Marketing Industry Revenue Share (%), by End-User Industry 2024 & 2032
- Figure 20: North America Geo Marketing Industry Revenue (Million), by Country 2024 & 2032
- Figure 21: North America Geo Marketing Industry Revenue Share (%), by Country 2024 & 2032
- Figure 22: Europe Geo Marketing Industry Revenue (Million), by Components 2024 & 2032
- Figure 23: Europe Geo Marketing Industry Revenue Share (%), by Components 2024 & 2032
- Figure 24: Europe Geo Marketing Industry Revenue (Million), by Deployment 2024 & 2032
- Figure 25: Europe Geo Marketing Industry Revenue Share (%), by Deployment 2024 & 2032
- Figure 26: Europe Geo Marketing Industry Revenue (Million), by Location 2024 & 2032
- Figure 27: Europe Geo Marketing Industry Revenue Share (%), by Location 2024 & 2032
- Figure 28: Europe Geo Marketing Industry Revenue (Million), by End-User Industry 2024 & 2032
- Figure 29: Europe Geo Marketing Industry Revenue Share (%), by End-User Industry 2024 & 2032
- Figure 30: Europe Geo Marketing Industry Revenue (Million), by Country 2024 & 2032
- Figure 31: Europe Geo Marketing Industry Revenue Share (%), by Country 2024 & 2032
- Figure 32: Asia Pacific Geo Marketing Industry Revenue (Million), by Components 2024 & 2032
- Figure 33: Asia Pacific Geo Marketing Industry Revenue Share (%), by Components 2024 & 2032
- Figure 34: Asia Pacific Geo Marketing Industry Revenue (Million), by Deployment 2024 & 2032
- Figure 35: Asia Pacific Geo Marketing Industry Revenue Share (%), by Deployment 2024 & 2032
- Figure 36: Asia Pacific Geo Marketing Industry Revenue (Million), by Location 2024 & 2032
- Figure 37: Asia Pacific Geo Marketing Industry Revenue Share (%), by Location 2024 & 2032
- Figure 38: Asia Pacific Geo Marketing Industry Revenue (Million), by End-User Industry 2024 & 2032
- Figure 39: Asia Pacific Geo Marketing Industry Revenue Share (%), by End-User Industry 2024 & 2032
- Figure 40: Asia Pacific Geo Marketing Industry Revenue (Million), by Country 2024 & 2032
- Figure 41: Asia Pacific Geo Marketing Industry Revenue Share (%), by Country 2024 & 2032
- Figure 42: Latin America Geo Marketing Industry Revenue (Million), by Components 2024 & 2032
- Figure 43: Latin America Geo Marketing Industry Revenue Share (%), by Components 2024 & 2032
- Figure 44: Latin America Geo Marketing Industry Revenue (Million), by Deployment 2024 & 2032
- Figure 45: Latin America Geo Marketing Industry Revenue Share (%), by Deployment 2024 & 2032
- Figure 46: Latin America Geo Marketing Industry Revenue (Million), by Location 2024 & 2032
- Figure 47: Latin America Geo Marketing Industry Revenue Share (%), by Location 2024 & 2032
- Figure 48: Latin America Geo Marketing Industry Revenue (Million), by End-User Industry 2024 & 2032
- Figure 49: Latin America Geo Marketing Industry Revenue Share (%), by End-User Industry 2024 & 2032
- Figure 50: Latin America Geo Marketing Industry Revenue (Million), by Country 2024 & 2032
- Figure 51: Latin America Geo Marketing Industry Revenue Share (%), by Country 2024 & 2032
- Figure 52: Middle East and Africa Geo Marketing Industry Revenue (Million), by Components 2024 & 2032
- Figure 53: Middle East and Africa Geo Marketing Industry Revenue Share (%), by Components 2024 & 2032
- Figure 54: Middle East and Africa Geo Marketing Industry Revenue (Million), by Deployment 2024 & 2032
- Figure 55: Middle East and Africa Geo Marketing Industry Revenue Share (%), by Deployment 2024 & 2032
- Figure 56: Middle East and Africa Geo Marketing Industry Revenue (Million), by Location 2024 & 2032
- Figure 57: Middle East and Africa Geo Marketing Industry Revenue Share (%), by Location 2024 & 2032
- Figure 58: Middle East and Africa Geo Marketing Industry Revenue (Million), by End-User Industry 2024 & 2032
- Figure 59: Middle East and Africa Geo Marketing Industry Revenue Share (%), by End-User Industry 2024 & 2032
- Figure 60: Middle East and Africa Geo Marketing Industry Revenue (Million), by Country 2024 & 2032
- Figure 61: Middle East and Africa Geo Marketing Industry Revenue Share (%), by Country 2024 & 2032
List of Tables
- Table 1: Global Geo Marketing Industry Revenue Million Forecast, by Region 2019 & 2032
- Table 2: Global Geo Marketing Industry Revenue Million Forecast, by Components 2019 & 2032
- Table 3: Global Geo Marketing Industry Revenue Million Forecast, by Deployment 2019 & 2032
- Table 4: Global Geo Marketing Industry Revenue Million Forecast, by Location 2019 & 2032
- Table 5: Global Geo Marketing Industry Revenue Million Forecast, by End-User Industry 2019 & 2032
- Table 6: Global Geo Marketing Industry Revenue Million Forecast, by Region 2019 & 2032
- Table 7: Global Geo Marketing Industry Revenue Million Forecast, by Country 2019 & 2032
- Table 8: Geo Marketing Industry Revenue (Million) Forecast, by Application 2019 & 2032
- Table 9: Global Geo Marketing Industry Revenue Million Forecast, by Country 2019 & 2032
- Table 10: Geo Marketing Industry Revenue (Million) Forecast, by Application 2019 & 2032
- Table 11: Global Geo Marketing Industry Revenue Million Forecast, by Country 2019 & 2032
- Table 12: Geo Marketing Industry Revenue (Million) Forecast, by Application 2019 & 2032
- Table 13: Global Geo Marketing Industry Revenue Million Forecast, by Country 2019 & 2032
- Table 14: Geo Marketing Industry Revenue (Million) Forecast, by Application 2019 & 2032
- Table 15: Global Geo Marketing Industry Revenue Million Forecast, by Country 2019 & 2032
- Table 16: Geo Marketing Industry Revenue (Million) Forecast, by Application 2019 & 2032
- Table 17: Global Geo Marketing Industry Revenue Million Forecast, by Components 2019 & 2032
- Table 18: Global Geo Marketing Industry Revenue Million Forecast, by Deployment 2019 & 2032
- Table 19: Global Geo Marketing Industry Revenue Million Forecast, by Location 2019 & 2032
- Table 20: Global Geo Marketing Industry Revenue Million Forecast, by End-User Industry 2019 & 2032
- Table 21: Global Geo Marketing Industry Revenue Million Forecast, by Country 2019 & 2032
- Table 22: Global Geo Marketing Industry Revenue Million Forecast, by Components 2019 & 2032
- Table 23: Global Geo Marketing Industry Revenue Million Forecast, by Deployment 2019 & 2032
- Table 24: Global Geo Marketing Industry Revenue Million Forecast, by Location 2019 & 2032
- Table 25: Global Geo Marketing Industry Revenue Million Forecast, by End-User Industry 2019 & 2032
- Table 26: Global Geo Marketing Industry Revenue Million Forecast, by Country 2019 & 2032
- Table 27: Global Geo Marketing Industry Revenue Million Forecast, by Components 2019 & 2032
- Table 28: Global Geo Marketing Industry Revenue Million Forecast, by Deployment 2019 & 2032
- Table 29: Global Geo Marketing Industry Revenue Million Forecast, by Location 2019 & 2032
- Table 30: Global Geo Marketing Industry Revenue Million Forecast, by End-User Industry 2019 & 2032
- Table 31: Global Geo Marketing Industry Revenue Million Forecast, by Country 2019 & 2032
- Table 32: Global Geo Marketing Industry Revenue Million Forecast, by Components 2019 & 2032
- Table 33: Global Geo Marketing Industry Revenue Million Forecast, by Deployment 2019 & 2032
- Table 34: Global Geo Marketing Industry Revenue Million Forecast, by Location 2019 & 2032
- Table 35: Global Geo Marketing Industry Revenue Million Forecast, by End-User Industry 2019 & 2032
- Table 36: Global Geo Marketing Industry Revenue Million Forecast, by Country 2019 & 2032
- Table 37: Global Geo Marketing Industry Revenue Million Forecast, by Components 2019 & 2032
- Table 38: Global Geo Marketing Industry Revenue Million Forecast, by Deployment 2019 & 2032
- Table 39: Global Geo Marketing Industry Revenue Million Forecast, by Location 2019 & 2032
- Table 40: Global Geo Marketing Industry Revenue Million Forecast, by End-User Industry 2019 & 2032
- Table 41: Global Geo Marketing Industry Revenue Million Forecast, by Country 2019 & 2032
Frequently Asked Questions
1. What is the projected Compound Annual Growth Rate (CAGR) of the Geo Marketing Industry?
The projected CAGR is approximately 20.50%.
2. Which companies are prominent players in the Geo Marketing Industry?
Key companies in the market include Adobe Systems Inc, IBM Corporation, Google LLC, Software AG, Xtremepush Limited, Cisco Systems Inc, Microsoft Corporation, Ericsson Inc, Oracle Corporation, ESRI Business Information Solutions Inc, Qualcomm Inc.
3. What are the main segments of the Geo Marketing Industry?
The market segments include Components, Deployment, Location, End-User Industry.
4. Can you provide details about the market size?
The market size is estimated to be USD 17.29 Million as of 2022.
5. What are some drivers contributing to market growth?
Increasing Adoption of Emerging Technologies in Marketing Sector; Increasing Demand for Location-Based Intelligence to Enhance the Business Revenue.
6. What are the notable trends driving market growth?
Services Components Segment is Expected to Hold Significant Market Share.
7. Are there any restraints impacting market growth?
Increasing Security and Privacy Concerns Among Enterprises.
8. Can you provide examples of recent developments in the market?
Jan 2023: MapZot.AI provides Mobile Location data to assist businesses in increasing foot traffic. MapZot.AI provides site selection, portfolio analytics, and vacancy analysis by providing insights into the exact habits of consumers, allowing company owners to properly estimate customer accessibility. The data provided by MapZot.AI is insightful and simple; by combining detailed metrics such as store saturation and pull rates with a simple UI, any business owner can take advantage of the advanced analytics capabilities that MapZot.AI provides to gain insight into what drives customers to their stores and which potential locations could be advantageous for opening new ones.
9. What pricing options are available for accessing the report?
Pricing options include single-user, multi-user, and enterprise licenses priced at USD 4750, USD 5250, and USD 8750 respectively.
10. Is the market size provided in terms of value or volume?
The market size is provided in terms of value, measured in Million.
11. Are there any specific market keywords associated with the report?
Yes, the market keyword associated with the report is "Geo Marketing Industry," which aids in identifying and referencing the specific market segment covered.
12. How do I determine which pricing option suits my needs best?
The pricing options vary based on user requirements and access needs. Individual users may opt for single-user licenses, while businesses requiring broader access may choose multi-user or enterprise licenses for cost-effective access to the report.
13. Are there any additional resources or data provided in the Geo Marketing Industry report?
While the report offers comprehensive insights, it's advisable to review the specific contents or supplementary materials provided to ascertain if additional resources or data are available.
14. How can I stay updated on further developments or reports in the Geo Marketing Industry?
To stay informed about further developments, trends, and reports in the Geo Marketing Industry, consider subscribing to industry newsletters, following relevant companies and organizations, or regularly checking reputable industry news sources and publications.
Methodology
Step 1 - Identification of Relevant Samples Size from Population Database


Step 2 - Approaches for Defining Global Market Size (Value, Volume* & Price*)

Note*: In applicable scenarios
Step 3 - Data Sources
Primary Research
- Web Analytics
- Survey Reports
- Research Institute
- Latest Research Reports
- Opinion Leaders
Secondary Research
- Annual Reports
- White Paper
- Latest Press Release
- Industry Association
- Paid Database
- Investor Presentations

Step 4 - Data Triangulation
Involves using different sources of information in order to increase the validity of a study
These sources are likely to be stakeholders in a program - participants, other researchers, program staff, other community members, and so on.
Then we put all data in single framework & apply various statistical tools to find out the dynamic on the market.
During the analysis stage, feedback from the stakeholder groups would be compared to determine areas of agreement as well as areas of divergence
