

Key Insights
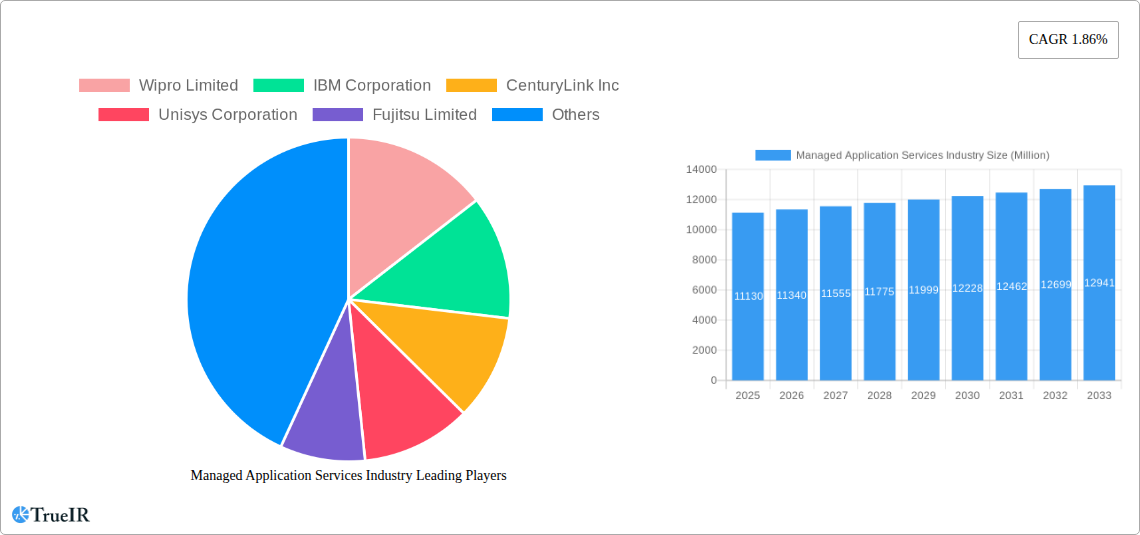
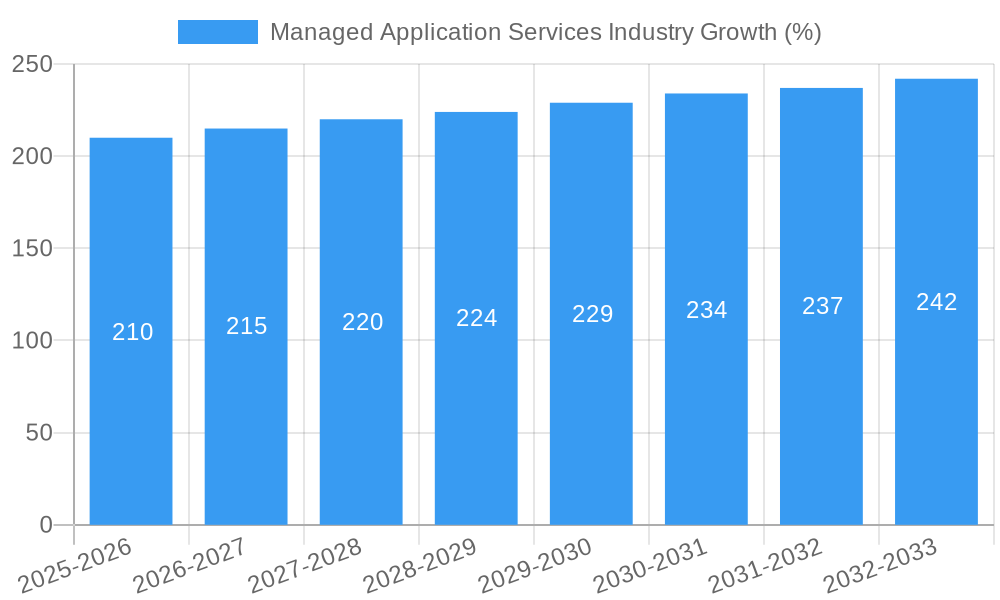
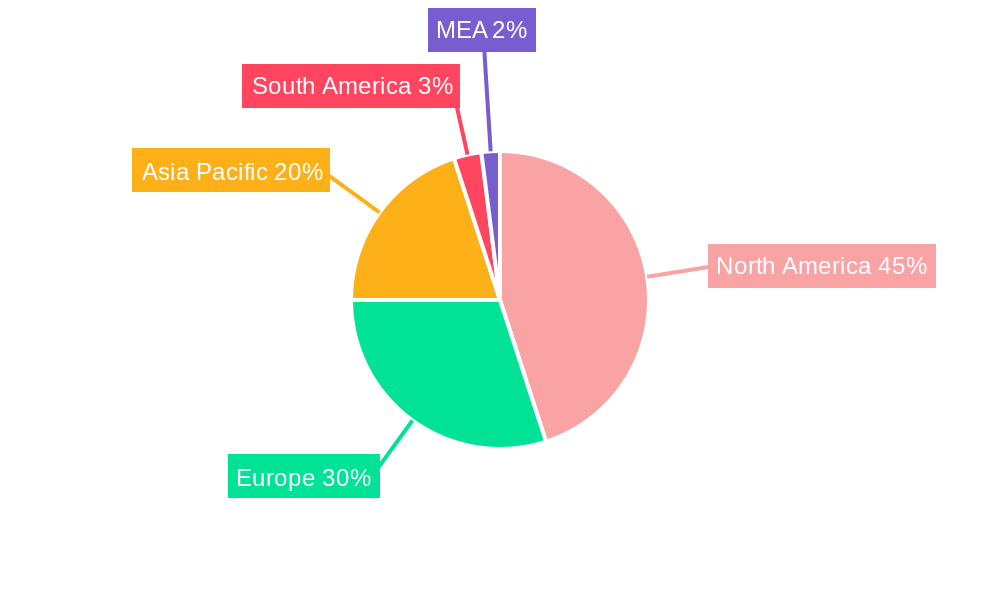
The Managed Application Services (MAS) market, valued at $11.13 billion in 2025, is projected to experience steady growth, exhibiting a Compound Annual Growth Rate (CAGR) of 1.86% from 2025 to 2033. This moderate growth reflects a mature market where businesses increasingly rely on external providers for application management, maintenance, and optimization. Key drivers include the rising complexity of enterprise applications, the escalating demand for digital transformation initiatives, and the growing need for cost optimization through outsourcing. The BFSI (Banking, Financial Services, and Insurance), Retail & E-commerce, and IT & Telecom sectors are major contributors, representing a significant portion of the market demand. Large enterprises constitute a larger segment compared to SMEs, driven by their need for robust and scalable application management solutions. North America currently holds a dominant market share, fueled by robust technological infrastructure and early adoption of cloud-based services. However, regions like Asia-Pacific are showing promising growth potential, driven by increasing digitalization and technological advancements. Competitive pressures amongst established players like Wipro, IBM, and others are likely to intensify, pushing for innovative service offerings and pricing strategies.
Despite the overall positive outlook, the MAS market faces certain restraints. These include concerns regarding data security and compliance, vendor lock-in, and the challenge of integrating legacy systems with modern cloud-based solutions. Future trends indicate a growing focus on Artificial Intelligence (AI) and Machine Learning (ML) integration within MAS, enhancing predictive maintenance and automated incident management. Furthermore, the rise of edge computing and the expanding adoption of serverless architectures are expected to reshape the service landscape, necessitating further adaptation and innovation from MAS providers. The expansion of cloud-native application services and the increasing demand for managed security services will also influence the trajectory of the market. Overall, a strategic approach toward security, innovation, and flexible service delivery will be crucial for vendors to thrive in this competitive and evolving landscape.
Managed Application Services Industry Market Report: 2019-2033
This comprehensive report provides a detailed analysis of the Managed Application Services industry, projecting a market valuation exceeding $XX Million by 2033. The study covers the period 2019-2033, with a base year of 2025 and a forecast period of 2025-2033. It delves into market structure, competitive dynamics, key trends, growth drivers, and challenges, offering invaluable insights for industry stakeholders.
Managed Application Services Industry Market Structure & Competitive Landscape
The Managed Application Services market exhibits a moderately concentrated structure, with a few major players holding significant market share. The Herfindahl-Hirschman Index (HHI) is estimated at xx, indicating a moderately competitive landscape. Innovation is a key driver, fueled by advancements in cloud computing, artificial intelligence (AI), and automation. Regulatory impacts vary across regions, with data privacy regulations (e.g., GDPR) significantly influencing market operations. Product substitutes, such as in-house application management teams, pose a challenge but are often outweighed by the cost and expertise benefits of managed services.
The market is segmented by end-user verticals (BFSI, Retail & E-Commerce, IT & Telecom, Manufacturing, Healthcare) and organization size (Small & Medium-scale Enterprises, Large Enterprises). Mergers and acquisitions (M&A) activity has been relatively high in recent years, with an estimated xx Million USD in M&A volume in 2024. This trend reflects consolidation within the industry and a drive towards acquiring specialized expertise. Key M&A trends include expansion into new geographical markets and the acquisition of smaller companies with specific technological capabilities.
Managed Application Services Industry Market Trends & Opportunities
The Managed Application Services market is experiencing robust growth, with a projected Compound Annual Growth Rate (CAGR) of xx% from 2025 to 2033. This growth is driven by several factors: the increasing adoption of cloud-based applications, the need for enhanced security and compliance, and the rising demand for IT cost optimization. The shift towards hybrid and multi-cloud environments presents significant opportunities, requiring sophisticated managed service providers to navigate complex cloud landscapes.
Consumer preferences are increasingly leaning towards flexible, scalable, and pay-as-you-go service models. The competitive landscape is characterized by intense rivalry among established players and emerging niche providers. Market penetration rates are expected to increase significantly in developing economies as organizations embrace digital transformation initiatives.
Dominant Markets & Segments in Managed Application Services Industry
The North American region currently holds the dominant position in the Managed Application Services market, driven by strong technological advancements and high IT spending. Within the segment breakdown, Large Enterprises are the primary consumers of Managed Application Services due to their complex IT infrastructures and need for robust support. The BFSI and IT & Telecom sectors represent the largest end-user verticals, owing to their high reliance on critical applications and stringent security requirements.
Key Growth Drivers in North America:
- Extensive cloud infrastructure development
- Favorable regulatory environment fostering digital transformation
- High adoption of advanced technologies like AI and automation.
Key Growth Drivers in Large Enterprises:
- Complex IT infrastructures demanding specialized expertise
- Need for high availability and performance of critical applications
- Strong emphasis on security and compliance.
Key Growth Drivers in BFSI & IT & Telecom:
- Stringent data security and regulatory compliance requirements
- Critical dependence on reliable application performance
- High investment in digital transformation initiatives.
Europe and Asia Pacific are also experiencing significant growth, driven by increasing digitalization and government initiatives promoting the adoption of cloud technologies.
Managed Application Services Industry Product Analysis
Product innovation in the Managed Application Services industry is heavily focused on integrating AI and machine learning (ML) to enhance operational efficiency and provide predictive maintenance. The rise of serverless computing and containerization technologies is transforming application architectures, leading to the development of specialized managed services for these environments. The competitive advantage lies in the ability to offer comprehensive solutions encompassing application development, deployment, management, and security, delivered through flexible and scalable service models that align with customer specific needs.
Key Drivers, Barriers & Challenges in Managed Application Services Industry
Key Drivers:
The market is driven by increasing demand for cost optimization, enhanced security, and improved operational efficiency of applications. Technological advancements like AI and cloud computing are key enablers. Government initiatives promoting digital transformation in various sectors also contribute significantly.
Key Challenges:
Challenges include the complexities of integrating diverse systems, stringent security and compliance requirements, and the need for skilled workforce. Supply chain disruptions can impact service delivery, while competitive pressure from both established and emerging players continues. The estimated impact of these challenges on market growth is a reduction of xx% by 2030.
Growth Drivers in the Managed Application Services Industry Market
The key drivers are technological advancements (AI, cloud, automation), rising demand for cost optimization and security, increasing digital transformation initiatives across industries, and government policies promoting digital adoption. Specific examples include the widespread adoption of cloud-native applications and the increasing need for 24/7 application support.
Challenges Impacting Managed Application Services Industry Growth
Challenges include the need for skilled personnel, integration complexities across diverse systems, and rigorous security and compliance standards. Supply chain disruptions and intense competition from established players and emerging niche providers can also impact growth.
Key Players Shaping the Managed Application Services Industry Market
- Wipro Limited
- IBM Corporation
- CenturyLink Inc
- Unisys Corporation
- Fujitsu Limited
- RACKSPACE INC
- DXC Technology Company
- Mindtree Limited
- HCL Technologies Limited
- BMC Software INC
- VIRTUSTREAM INC
Significant Managed Application Services Industry Milestones
- June 2022: AWS launched Managed Services (AMS) Accelerate, a cloud operations offering focusing on operational excellence and cost-effectiveness, enhancing customer experience.
- February 2022: IBM launched its integrated global platform, "Let's create," emphasizing innovation, collaboration, and data-driven solutions to enhance its offerings and competitiveness.
Future Outlook for Managed Application Services Industry Market
The Managed Application Services market is poised for continued growth, driven by ongoing digital transformation, increasing adoption of cloud-native applications, and the rising demand for sophisticated managed services. Strategic opportunities exist in expanding into emerging markets, developing specialized solutions for niche industries, and leveraging AI and automation to enhance service offerings. The market’s potential is significant, with projections indicating substantial growth in the coming years.
Managed Application Services Industry Segmentation
-
1. Organization Size
- 1.1. Small & Medium-scale Enterprises
- 1.2. Large Enterprises
-
2. End-user Verticals
- 2.1. BFSI
- 2.2. Retail & E-Commerce
- 2.3. IT & Telecom
- 2.4. Manufacturing
- 2.5. Healthcare
Managed Application Services Industry Segmentation By Geography
-
1. North America
- 1.1. United States
- 1.2. Canada
- 1.3. Mexico
- 1.4. Rest of North America
-
2. Europe
- 2.1. Germany
- 2.2. United Kingdom
- 2.3. France
- 2.4. Russia
- 2.5. Spain
- 2.6. Rest of Europe
-
3. Asia Pacific
- 3.1. India
- 3.2. China
- 3.3. Japan
- 3.4. Rest of Asia Pacific
-
4. South America
- 4.1. Brazil
- 4.2. Argentina
-
5. Middle East
- 5.1. United Arab Emirates
- 5.2. Saudi Arabia
- 5.3. Rest of Middle East
Managed Application Services Industry REPORT HIGHLIGHTS
| Aspects | Details |
|---|---|
| Study Period | 2019-2033 |
| Base Year | 2024 |
| Estimated Year | 2025 |
| Forecast Period | 2025-2033 |
| Historical Period | 2019-2024 |
| Growth Rate | CAGR of 1.86% from 2019-2033 |
| Segmentation |
|
Table of Contents
- 1. Introduction
- 1.1. Research Scope
- 1.2. Market Segmentation
- 1.3. Research Methodology
- 1.4. Definitions and Assumptions
- 2. Executive Summary
- 2.1. Introduction
- 3. Market Dynamics
- 3.1. Introduction
- 3.2. Market Drivers
- 3.2.1. Increased demand for end-to-end application hosting; The requirement to improve and secure critical business applications; Increase in the level of application infrastructure
- 3.3. Market Restrains
- 3.3.1. Security risks associated with application data
- 3.4. Market Trends
- 3.4.1. IT and Telecom is Expected to Hold Major Share
- 4. Market Factor Analysis
- 4.1. Porters Five Forces
- 4.2. Supply/Value Chain
- 4.3. PESTEL analysis
- 4.4. Market Entropy
- 4.5. Patent/Trademark Analysis
- 5. Global Managed Application Services Industry Analysis, Insights and Forecast, 2019-2031
- 5.1. Market Analysis, Insights and Forecast - by Organization Size
- 5.1.1. Small & Medium-scale Enterprises
- 5.1.2. Large Enterprises
- 5.2. Market Analysis, Insights and Forecast - by End-user Verticals
- 5.2.1. BFSI
- 5.2.2. Retail & E-Commerce
- 5.2.3. IT & Telecom
- 5.2.4. Manufacturing
- 5.2.5. Healthcare
- 5.3. Market Analysis, Insights and Forecast - by Region
- 5.3.1. North America
- 5.3.2. Europe
- 5.3.3. Asia Pacific
- 5.3.4. South America
- 5.3.5. Middle East
- 5.1. Market Analysis, Insights and Forecast - by Organization Size
- 6. North America Managed Application Services Industry Analysis, Insights and Forecast, 2019-2031
- 6.1. Market Analysis, Insights and Forecast - by Organization Size
- 6.1.1. Small & Medium-scale Enterprises
- 6.1.2. Large Enterprises
- 6.2. Market Analysis, Insights and Forecast - by End-user Verticals
- 6.2.1. BFSI
- 6.2.2. Retail & E-Commerce
- 6.2.3. IT & Telecom
- 6.2.4. Manufacturing
- 6.2.5. Healthcare
- 6.1. Market Analysis, Insights and Forecast - by Organization Size
- 7. Europe Managed Application Services Industry Analysis, Insights and Forecast, 2019-2031
- 7.1. Market Analysis, Insights and Forecast - by Organization Size
- 7.1.1. Small & Medium-scale Enterprises
- 7.1.2. Large Enterprises
- 7.2. Market Analysis, Insights and Forecast - by End-user Verticals
- 7.2.1. BFSI
- 7.2.2. Retail & E-Commerce
- 7.2.3. IT & Telecom
- 7.2.4. Manufacturing
- 7.2.5. Healthcare
- 7.1. Market Analysis, Insights and Forecast - by Organization Size
- 8. Asia Pacific Managed Application Services Industry Analysis, Insights and Forecast, 2019-2031
- 8.1. Market Analysis, Insights and Forecast - by Organization Size
- 8.1.1. Small & Medium-scale Enterprises
- 8.1.2. Large Enterprises
- 8.2. Market Analysis, Insights and Forecast - by End-user Verticals
- 8.2.1. BFSI
- 8.2.2. Retail & E-Commerce
- 8.2.3. IT & Telecom
- 8.2.4. Manufacturing
- 8.2.5. Healthcare
- 8.1. Market Analysis, Insights and Forecast - by Organization Size
- 9. South America Managed Application Services Industry Analysis, Insights and Forecast, 2019-2031
- 9.1. Market Analysis, Insights and Forecast - by Organization Size
- 9.1.1. Small & Medium-scale Enterprises
- 9.1.2. Large Enterprises
- 9.2. Market Analysis, Insights and Forecast - by End-user Verticals
- 9.2.1. BFSI
- 9.2.2. Retail & E-Commerce
- 9.2.3. IT & Telecom
- 9.2.4. Manufacturing
- 9.2.5. Healthcare
- 9.1. Market Analysis, Insights and Forecast - by Organization Size
- 10. Middle East Managed Application Services Industry Analysis, Insights and Forecast, 2019-2031
- 10.1. Market Analysis, Insights and Forecast - by Organization Size
- 10.1.1. Small & Medium-scale Enterprises
- 10.1.2. Large Enterprises
- 10.2. Market Analysis, Insights and Forecast - by End-user Verticals
- 10.2.1. BFSI
- 10.2.2. Retail & E-Commerce
- 10.2.3. IT & Telecom
- 10.2.4. Manufacturing
- 10.2.5. Healthcare
- 10.1. Market Analysis, Insights and Forecast - by Organization Size
- 11. North America Managed Application Services Industry Analysis, Insights and Forecast, 2019-2031
- 11.1. Market Analysis, Insights and Forecast - By Country/Sub-region
- 11.1.1 United States
- 11.1.2 Canada
- 11.1.3 Mexico
- 12. Europe Managed Application Services Industry Analysis, Insights and Forecast, 2019-2031
- 12.1. Market Analysis, Insights and Forecast - By Country/Sub-region
- 12.1.1 Germany
- 12.1.2 United Kingdom
- 12.1.3 France
- 12.1.4 Spain
- 12.1.5 Italy
- 12.1.6 Spain
- 12.1.7 Belgium
- 12.1.8 Netherland
- 12.1.9 Nordics
- 12.1.10 Rest of Europe
- 13. Asia Pacific Managed Application Services Industry Analysis, Insights and Forecast, 2019-2031
- 13.1. Market Analysis, Insights and Forecast - By Country/Sub-region
- 13.1.1 China
- 13.1.2 Japan
- 13.1.3 India
- 13.1.4 South Korea
- 13.1.5 Southeast Asia
- 13.1.6 Australia
- 13.1.7 Indonesia
- 13.1.8 Phillipes
- 13.1.9 Singapore
- 13.1.10 Thailandc
- 13.1.11 Rest of Asia Pacific
- 14. South America Managed Application Services Industry Analysis, Insights and Forecast, 2019-2031
- 14.1. Market Analysis, Insights and Forecast - By Country/Sub-region
- 14.1.1 Brazil
- 14.1.2 Argentina
- 14.1.3 Peru
- 14.1.4 Chile
- 14.1.5 Colombia
- 14.1.6 Ecuador
- 14.1.7 Venezuela
- 14.1.8 Rest of South America
- 15. North America Managed Application Services Industry Analysis, Insights and Forecast, 2019-2031
- 15.1. Market Analysis, Insights and Forecast - By Country/Sub-region
- 15.1.1 United States
- 15.1.2 Canada
- 15.1.3 Mexico
- 16. MEA Managed Application Services Industry Analysis, Insights and Forecast, 2019-2031
- 16.1. Market Analysis, Insights and Forecast - By Country/Sub-region
- 16.1.1 United Arab Emirates
- 16.1.2 Saudi Arabia
- 16.1.3 South Africa
- 16.1.4 Rest of Middle East and Africa
- 17. Competitive Analysis
- 17.1. Global Market Share Analysis 2024
- 17.2. Company Profiles
- 17.2.1 Wipro Limited
- 17.2.1.1. Overview
- 17.2.1.2. Products
- 17.2.1.3. SWOT Analysis
- 17.2.1.4. Recent Developments
- 17.2.1.5. Financials (Based on Availability)
- 17.2.2 IBM Corporation
- 17.2.2.1. Overview
- 17.2.2.2. Products
- 17.2.2.3. SWOT Analysis
- 17.2.2.4. Recent Developments
- 17.2.2.5. Financials (Based on Availability)
- 17.2.3 CenturyLink Inc
- 17.2.3.1. Overview
- 17.2.3.2. Products
- 17.2.3.3. SWOT Analysis
- 17.2.3.4. Recent Developments
- 17.2.3.5. Financials (Based on Availability)
- 17.2.4 Unisys Corporation
- 17.2.4.1. Overview
- 17.2.4.2. Products
- 17.2.4.3. SWOT Analysis
- 17.2.4.4. Recent Developments
- 17.2.4.5. Financials (Based on Availability)
- 17.2.5 Fujitsu Limited
- 17.2.5.1. Overview
- 17.2.5.2. Products
- 17.2.5.3. SWOT Analysis
- 17.2.5.4. Recent Developments
- 17.2.5.5. Financials (Based on Availability)
- 17.2.6 RACKSPACE INC
- 17.2.6.1. Overview
- 17.2.6.2. Products
- 17.2.6.3. SWOT Analysis
- 17.2.6.4. Recent Developments
- 17.2.6.5. Financials (Based on Availability)
- 17.2.7 DXC Technology Company
- 17.2.7.1. Overview
- 17.2.7.2. Products
- 17.2.7.3. SWOT Analysis
- 17.2.7.4. Recent Developments
- 17.2.7.5. Financials (Based on Availability)
- 17.2.8 Mindtree Limited
- 17.2.8.1. Overview
- 17.2.8.2. Products
- 17.2.8.3. SWOT Analysis
- 17.2.8.4. Recent Developments
- 17.2.8.5. Financials (Based on Availability)
- 17.2.9 HCL Technologies Limited
- 17.2.9.1. Overview
- 17.2.9.2. Products
- 17.2.9.3. SWOT Analysis
- 17.2.9.4. Recent Developments
- 17.2.9.5. Financials (Based on Availability)
- 17.2.10 BMC Software INC
- 17.2.10.1. Overview
- 17.2.10.2. Products
- 17.2.10.3. SWOT Analysis
- 17.2.10.4. Recent Developments
- 17.2.10.5. Financials (Based on Availability)
- 17.2.11 VIRTUSTREAM INC
- 17.2.11.1. Overview
- 17.2.11.2. Products
- 17.2.11.3. SWOT Analysis
- 17.2.11.4. Recent Developments
- 17.2.11.5. Financials (Based on Availability)
- 17.2.1 Wipro Limited
List of Figures
- Figure 1: Global Managed Application Services Industry Revenue Breakdown (Million, %) by Region 2024 & 2032
- Figure 2: North America Managed Application Services Industry Revenue (Million), by Country 2024 & 2032
- Figure 3: North America Managed Application Services Industry Revenue Share (%), by Country 2024 & 2032
- Figure 4: Europe Managed Application Services Industry Revenue (Million), by Country 2024 & 2032
- Figure 5: Europe Managed Application Services Industry Revenue Share (%), by Country 2024 & 2032
- Figure 6: Asia Pacific Managed Application Services Industry Revenue (Million), by Country 2024 & 2032
- Figure 7: Asia Pacific Managed Application Services Industry Revenue Share (%), by Country 2024 & 2032
- Figure 8: South America Managed Application Services Industry Revenue (Million), by Country 2024 & 2032
- Figure 9: South America Managed Application Services Industry Revenue Share (%), by Country 2024 & 2032
- Figure 10: North America Managed Application Services Industry Revenue (Million), by Country 2024 & 2032
- Figure 11: North America Managed Application Services Industry Revenue Share (%), by Country 2024 & 2032
- Figure 12: MEA Managed Application Services Industry Revenue (Million), by Country 2024 & 2032
- Figure 13: MEA Managed Application Services Industry Revenue Share (%), by Country 2024 & 2032
- Figure 14: North America Managed Application Services Industry Revenue (Million), by Organization Size 2024 & 2032
- Figure 15: North America Managed Application Services Industry Revenue Share (%), by Organization Size 2024 & 2032
- Figure 16: North America Managed Application Services Industry Revenue (Million), by End-user Verticals 2024 & 2032
- Figure 17: North America Managed Application Services Industry Revenue Share (%), by End-user Verticals 2024 & 2032
- Figure 18: North America Managed Application Services Industry Revenue (Million), by Country 2024 & 2032
- Figure 19: North America Managed Application Services Industry Revenue Share (%), by Country 2024 & 2032
- Figure 20: Europe Managed Application Services Industry Revenue (Million), by Organization Size 2024 & 2032
- Figure 21: Europe Managed Application Services Industry Revenue Share (%), by Organization Size 2024 & 2032
- Figure 22: Europe Managed Application Services Industry Revenue (Million), by End-user Verticals 2024 & 2032
- Figure 23: Europe Managed Application Services Industry Revenue Share (%), by End-user Verticals 2024 & 2032
- Figure 24: Europe Managed Application Services Industry Revenue (Million), by Country 2024 & 2032
- Figure 25: Europe Managed Application Services Industry Revenue Share (%), by Country 2024 & 2032
- Figure 26: Asia Pacific Managed Application Services Industry Revenue (Million), by Organization Size 2024 & 2032
- Figure 27: Asia Pacific Managed Application Services Industry Revenue Share (%), by Organization Size 2024 & 2032
- Figure 28: Asia Pacific Managed Application Services Industry Revenue (Million), by End-user Verticals 2024 & 2032
- Figure 29: Asia Pacific Managed Application Services Industry Revenue Share (%), by End-user Verticals 2024 & 2032
- Figure 30: Asia Pacific Managed Application Services Industry Revenue (Million), by Country 2024 & 2032
- Figure 31: Asia Pacific Managed Application Services Industry Revenue Share (%), by Country 2024 & 2032
- Figure 32: South America Managed Application Services Industry Revenue (Million), by Organization Size 2024 & 2032
- Figure 33: South America Managed Application Services Industry Revenue Share (%), by Organization Size 2024 & 2032
- Figure 34: South America Managed Application Services Industry Revenue (Million), by End-user Verticals 2024 & 2032
- Figure 35: South America Managed Application Services Industry Revenue Share (%), by End-user Verticals 2024 & 2032
- Figure 36: South America Managed Application Services Industry Revenue (Million), by Country 2024 & 2032
- Figure 37: South America Managed Application Services Industry Revenue Share (%), by Country 2024 & 2032
- Figure 38: Middle East Managed Application Services Industry Revenue (Million), by Organization Size 2024 & 2032
- Figure 39: Middle East Managed Application Services Industry Revenue Share (%), by Organization Size 2024 & 2032
- Figure 40: Middle East Managed Application Services Industry Revenue (Million), by End-user Verticals 2024 & 2032
- Figure 41: Middle East Managed Application Services Industry Revenue Share (%), by End-user Verticals 2024 & 2032
- Figure 42: Middle East Managed Application Services Industry Revenue (Million), by Country 2024 & 2032
- Figure 43: Middle East Managed Application Services Industry Revenue Share (%), by Country 2024 & 2032
List of Tables
- Table 1: Global Managed Application Services Industry Revenue Million Forecast, by Region 2019 & 2032
- Table 2: Global Managed Application Services Industry Revenue Million Forecast, by Organization Size 2019 & 2032
- Table 3: Global Managed Application Services Industry Revenue Million Forecast, by End-user Verticals 2019 & 2032
- Table 4: Global Managed Application Services Industry Revenue Million Forecast, by Region 2019 & 2032
- Table 5: Global Managed Application Services Industry Revenue Million Forecast, by Country 2019 & 2032
- Table 6: United States Managed Application Services Industry Revenue (Million) Forecast, by Application 2019 & 2032
- Table 7: Canada Managed Application Services Industry Revenue (Million) Forecast, by Application 2019 & 2032
- Table 8: Mexico Managed Application Services Industry Revenue (Million) Forecast, by Application 2019 & 2032
- Table 9: Global Managed Application Services Industry Revenue Million Forecast, by Country 2019 & 2032
- Table 10: Germany Managed Application Services Industry Revenue (Million) Forecast, by Application 2019 & 2032
- Table 11: United Kingdom Managed Application Services Industry Revenue (Million) Forecast, by Application 2019 & 2032
- Table 12: France Managed Application Services Industry Revenue (Million) Forecast, by Application 2019 & 2032
- Table 13: Spain Managed Application Services Industry Revenue (Million) Forecast, by Application 2019 & 2032
- Table 14: Italy Managed Application Services Industry Revenue (Million) Forecast, by Application 2019 & 2032
- Table 15: Spain Managed Application Services Industry Revenue (Million) Forecast, by Application 2019 & 2032
- Table 16: Belgium Managed Application Services Industry Revenue (Million) Forecast, by Application 2019 & 2032
- Table 17: Netherland Managed Application Services Industry Revenue (Million) Forecast, by Application 2019 & 2032
- Table 18: Nordics Managed Application Services Industry Revenue (Million) Forecast, by Application 2019 & 2032
- Table 19: Rest of Europe Managed Application Services Industry Revenue (Million) Forecast, by Application 2019 & 2032
- Table 20: Global Managed Application Services Industry Revenue Million Forecast, by Country 2019 & 2032
- Table 21: China Managed Application Services Industry Revenue (Million) Forecast, by Application 2019 & 2032
- Table 22: Japan Managed Application Services Industry Revenue (Million) Forecast, by Application 2019 & 2032
- Table 23: India Managed Application Services Industry Revenue (Million) Forecast, by Application 2019 & 2032
- Table 24: South Korea Managed Application Services Industry Revenue (Million) Forecast, by Application 2019 & 2032
- Table 25: Southeast Asia Managed Application Services Industry Revenue (Million) Forecast, by Application 2019 & 2032
- Table 26: Australia Managed Application Services Industry Revenue (Million) Forecast, by Application 2019 & 2032
- Table 27: Indonesia Managed Application Services Industry Revenue (Million) Forecast, by Application 2019 & 2032
- Table 28: Phillipes Managed Application Services Industry Revenue (Million) Forecast, by Application 2019 & 2032
- Table 29: Singapore Managed Application Services Industry Revenue (Million) Forecast, by Application 2019 & 2032
- Table 30: Thailandc Managed Application Services Industry Revenue (Million) Forecast, by Application 2019 & 2032
- Table 31: Rest of Asia Pacific Managed Application Services Industry Revenue (Million) Forecast, by Application 2019 & 2032
- Table 32: Global Managed Application Services Industry Revenue Million Forecast, by Country 2019 & 2032
- Table 33: Brazil Managed Application Services Industry Revenue (Million) Forecast, by Application 2019 & 2032
- Table 34: Argentina Managed Application Services Industry Revenue (Million) Forecast, by Application 2019 & 2032
- Table 35: Peru Managed Application Services Industry Revenue (Million) Forecast, by Application 2019 & 2032
- Table 36: Chile Managed Application Services Industry Revenue (Million) Forecast, by Application 2019 & 2032
- Table 37: Colombia Managed Application Services Industry Revenue (Million) Forecast, by Application 2019 & 2032
- Table 38: Ecuador Managed Application Services Industry Revenue (Million) Forecast, by Application 2019 & 2032
- Table 39: Venezuela Managed Application Services Industry Revenue (Million) Forecast, by Application 2019 & 2032
- Table 40: Rest of South America Managed Application Services Industry Revenue (Million) Forecast, by Application 2019 & 2032
- Table 41: Global Managed Application Services Industry Revenue Million Forecast, by Country 2019 & 2032
- Table 42: United States Managed Application Services Industry Revenue (Million) Forecast, by Application 2019 & 2032
- Table 43: Canada Managed Application Services Industry Revenue (Million) Forecast, by Application 2019 & 2032
- Table 44: Mexico Managed Application Services Industry Revenue (Million) Forecast, by Application 2019 & 2032
- Table 45: Global Managed Application Services Industry Revenue Million Forecast, by Country 2019 & 2032
- Table 46: United Arab Emirates Managed Application Services Industry Revenue (Million) Forecast, by Application 2019 & 2032
- Table 47: Saudi Arabia Managed Application Services Industry Revenue (Million) Forecast, by Application 2019 & 2032
- Table 48: South Africa Managed Application Services Industry Revenue (Million) Forecast, by Application 2019 & 2032
- Table 49: Rest of Middle East and Africa Managed Application Services Industry Revenue (Million) Forecast, by Application 2019 & 2032
- Table 50: Global Managed Application Services Industry Revenue Million Forecast, by Organization Size 2019 & 2032
- Table 51: Global Managed Application Services Industry Revenue Million Forecast, by End-user Verticals 2019 & 2032
- Table 52: Global Managed Application Services Industry Revenue Million Forecast, by Country 2019 & 2032
- Table 53: United States Managed Application Services Industry Revenue (Million) Forecast, by Application 2019 & 2032
- Table 54: Canada Managed Application Services Industry Revenue (Million) Forecast, by Application 2019 & 2032
- Table 55: Mexico Managed Application Services Industry Revenue (Million) Forecast, by Application 2019 & 2032
- Table 56: Rest of North America Managed Application Services Industry Revenue (Million) Forecast, by Application 2019 & 2032
- Table 57: Global Managed Application Services Industry Revenue Million Forecast, by Organization Size 2019 & 2032
- Table 58: Global Managed Application Services Industry Revenue Million Forecast, by End-user Verticals 2019 & 2032
- Table 59: Global Managed Application Services Industry Revenue Million Forecast, by Country 2019 & 2032
- Table 60: Germany Managed Application Services Industry Revenue (Million) Forecast, by Application 2019 & 2032
- Table 61: United Kingdom Managed Application Services Industry Revenue (Million) Forecast, by Application 2019 & 2032
- Table 62: France Managed Application Services Industry Revenue (Million) Forecast, by Application 2019 & 2032
- Table 63: Russia Managed Application Services Industry Revenue (Million) Forecast, by Application 2019 & 2032
- Table 64: Spain Managed Application Services Industry Revenue (Million) Forecast, by Application 2019 & 2032
- Table 65: Rest of Europe Managed Application Services Industry Revenue (Million) Forecast, by Application 2019 & 2032
- Table 66: Global Managed Application Services Industry Revenue Million Forecast, by Organization Size 2019 & 2032
- Table 67: Global Managed Application Services Industry Revenue Million Forecast, by End-user Verticals 2019 & 2032
- Table 68: Global Managed Application Services Industry Revenue Million Forecast, by Country 2019 & 2032
- Table 69: India Managed Application Services Industry Revenue (Million) Forecast, by Application 2019 & 2032
- Table 70: China Managed Application Services Industry Revenue (Million) Forecast, by Application 2019 & 2032
- Table 71: Japan Managed Application Services Industry Revenue (Million) Forecast, by Application 2019 & 2032
- Table 72: Rest of Asia Pacific Managed Application Services Industry Revenue (Million) Forecast, by Application 2019 & 2032
- Table 73: Global Managed Application Services Industry Revenue Million Forecast, by Organization Size 2019 & 2032
- Table 74: Global Managed Application Services Industry Revenue Million Forecast, by End-user Verticals 2019 & 2032
- Table 75: Global Managed Application Services Industry Revenue Million Forecast, by Country 2019 & 2032
- Table 76: Brazil Managed Application Services Industry Revenue (Million) Forecast, by Application 2019 & 2032
- Table 77: Argentina Managed Application Services Industry Revenue (Million) Forecast, by Application 2019 & 2032
- Table 78: Global Managed Application Services Industry Revenue Million Forecast, by Organization Size 2019 & 2032
- Table 79: Global Managed Application Services Industry Revenue Million Forecast, by End-user Verticals 2019 & 2032
- Table 80: Global Managed Application Services Industry Revenue Million Forecast, by Country 2019 & 2032
- Table 81: United Arab Emirates Managed Application Services Industry Revenue (Million) Forecast, by Application 2019 & 2032
- Table 82: Saudi Arabia Managed Application Services Industry Revenue (Million) Forecast, by Application 2019 & 2032
- Table 83: Rest of Middle East Managed Application Services Industry Revenue (Million) Forecast, by Application 2019 & 2032
Frequently Asked Questions
1. What is the projected Compound Annual Growth Rate (CAGR) of the Managed Application Services Industry?
The projected CAGR is approximately 1.86%.
2. Which companies are prominent players in the Managed Application Services Industry?
Key companies in the market include Wipro Limited, IBM Corporation, CenturyLink Inc, Unisys Corporation, Fujitsu Limited, RACKSPACE INC, DXC Technology Company, Mindtree Limited, HCL Technologies Limited, BMC Software INC, VIRTUSTREAM INC.
3. What are the main segments of the Managed Application Services Industry?
The market segments include Organization Size, End-user Verticals.
4. Can you provide details about the market size?
The market size is estimated to be USD 11.13 Million as of 2022.
5. What are some drivers contributing to market growth?
Increased demand for end-to-end application hosting; The requirement to improve and secure critical business applications; Increase in the level of application infrastructure.
6. What are the notable trends driving market growth?
IT and Telecom is Expected to Hold Major Share.
7. Are there any restraints impacting market growth?
Security risks associated with application data.
8. Can you provide examples of recent developments in the market?
June 2022 - AWS Managed Services (AMS) Accelerate a new cloud operations offering that assists customers in achieving operational excellence regardless of their cloud journey. Accelerate can run any workload on Amazon Web Services (AWS) while giving customers complete access to all AWS services. AWS services such as AWS Systems Manager, Amazon CloudWatch, Amazon GuardDuty, and AWS Config are used by Accelerate for operations and security.
9. What pricing options are available for accessing the report?
Pricing options include single-user, multi-user, and enterprise licenses priced at USD 4750, USD 5250, and USD 8750 respectively.
10. Is the market size provided in terms of value or volume?
The market size is provided in terms of value, measured in Million.
11. Are there any specific market keywords associated with the report?
Yes, the market keyword associated with the report is "Managed Application Services Industry," which aids in identifying and referencing the specific market segment covered.
12. How do I determine which pricing option suits my needs best?
The pricing options vary based on user requirements and access needs. Individual users may opt for single-user licenses, while businesses requiring broader access may choose multi-user or enterprise licenses for cost-effective access to the report.
13. Are there any additional resources or data provided in the Managed Application Services Industry report?
While the report offers comprehensive insights, it's advisable to review the specific contents or supplementary materials provided to ascertain if additional resources or data are available.
14. How can I stay updated on further developments or reports in the Managed Application Services Industry?
To stay informed about further developments, trends, and reports in the Managed Application Services Industry, consider subscribing to industry newsletters, following relevant companies and organizations, or regularly checking reputable industry news sources and publications.
Methodology
Step 1 - Identification of Relevant Samples Size from Population Database


Step 2 - Approaches for Defining Global Market Size (Value, Volume* & Price*)

Note*: In applicable scenarios
Step 3 - Data Sources
Primary Research
- Web Analytics
- Survey Reports
- Research Institute
- Latest Research Reports
- Opinion Leaders
Secondary Research
- Annual Reports
- White Paper
- Latest Press Release
- Industry Association
- Paid Database
- Investor Presentations

Step 4 - Data Triangulation
Involves using different sources of information in order to increase the validity of a study
These sources are likely to be stakeholders in a program - participants, other researchers, program staff, other community members, and so on.
Then we put all data in single framework & apply various statistical tools to find out the dynamic on the market.
During the analysis stage, feedback from the stakeholder groups would be compared to determine areas of agreement as well as areas of divergence
