

Key Insights
The global glass prepreg market is poised for significant expansion, projected to reach 8.89 billion by 2025 and grow at a Compound Annual Growth Rate (CAGR) of 13.72% from 2025 to 2033. This robust growth is underpinned by several key market drivers. The aerospace and defense sector's increasing demand for lightweight, high-strength materials, driven by advancements in aircraft design and the pursuit of fuel efficiency, is a primary contributor. Concurrently, the automotive industry's transition towards electric vehicles (EVs) and hybrid models is fueling demand for components with enhanced thermal management and durability. The expanding wind turbine sector, focused on optimizing renewable energy generation, also significantly bolsters market growth due to glass prepreg's suitability for blade construction. Furthermore, the adoption of glass prepregs in sports and leisure equipment, where their lightweight and high-strength properties are paramount, contributes to overall market expansion. Despite potential challenges such as fluctuating raw material costs and stringent regulatory landscapes, the market outlook remains highly positive, propelled by ongoing technological innovations and sustained growth across its core end-use industries.
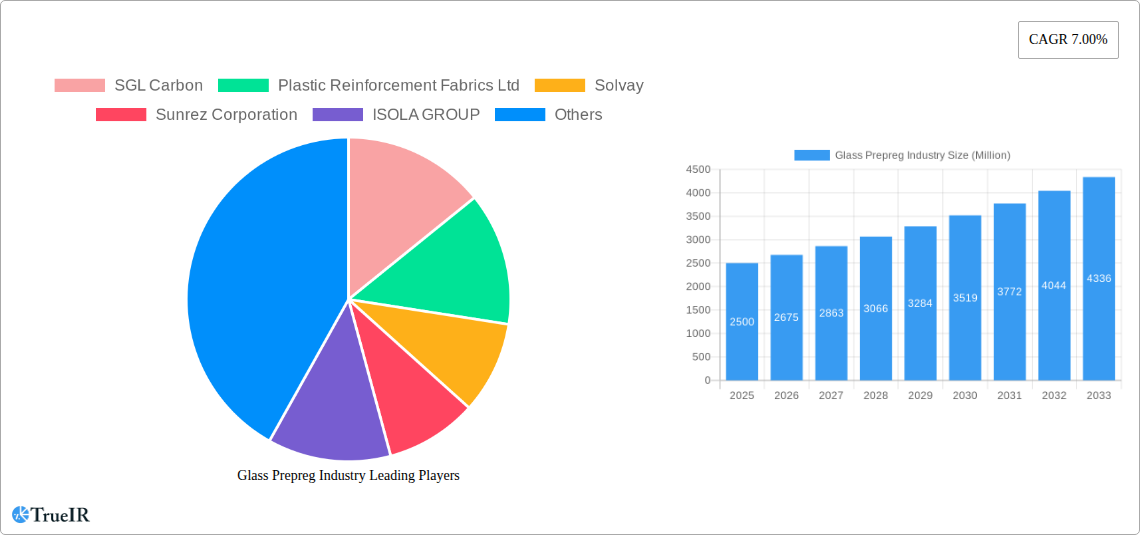
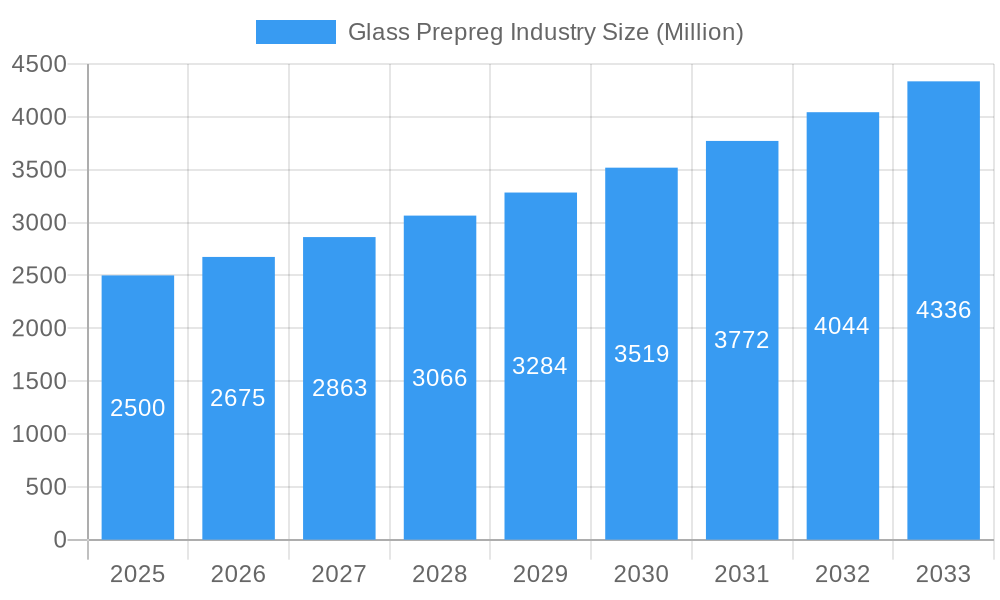
Glass Prepreg Industry Market Size (In Billion)
Market segmentation highlights a dynamic competitive environment. Thermosetting resins currently lead the resin type segment, valued for their superior heat resistance and mechanical properties essential for high-performance applications. However, thermoplastic resins are experiencing increasing adoption due to their recyclability and simplified processing, indicating potential for future market share growth. Geographically, the Asia-Pacific region, particularly China and India, is expected to be a major growth engine, driven by rapid industrialization and infrastructure development. North America and Europe maintain substantial market positions, supported by the strong presence of established aerospace, automotive, and wind energy sectors. Key industry players, including SGL Carbon, Solvay, and Hexcel Corporation, are actively pursuing strategic partnerships and research and development investments to secure a competitive advantage in this rapidly evolving market. The forecast period (2025-2033) anticipates a consistent growth trajectory, influenced by continuous technological advancements, the increasing adoption of sustainable materials, and the expanding scope of end-use industries.
Glass Prepreg Industry Company Market Share
Glass Prepreg Industry Market Report: 2019-2033
This comprehensive report provides an in-depth analysis of the global Glass Prepreg industry, offering invaluable insights for stakeholders seeking to navigate this dynamic market. With a detailed examination spanning from 2019 to 2033 (Study Period), including a Base Year of 2025 and a Forecast Period of 2025-2033, this report leverages historical data (2019-2024) to project future trends and market opportunities. The report is meticulously structured to deliver a clear and concise understanding of market dynamics, competitive landscapes, and growth prospects. The market is projected to reach xx Million by 2033, exhibiting a significant CAGR of xx% during the forecast period.
Glass Prepreg Industry Market Structure & Competitive Landscape
The global glass prepreg market exhibits a moderately concentrated structure, with a few major players holding significant market share. The Herfindahl-Hirschman Index (HHI) is estimated at xx in 2025, suggesting a moderately competitive landscape. Innovation is a key driver, with companies continuously developing new materials and processes to enhance performance and reduce costs. Regulatory pressures, particularly concerning environmental compliance and safety, are shaping industry practices. Product substitutes, such as carbon fiber prepregs, present a competitive challenge, though glass prepregs maintain a cost advantage in many applications.
- Market Concentration: HHI estimated at xx in 2025.
- Innovation Drivers: Development of high-strength, lightweight materials; improved processing techniques.
- Regulatory Impacts: Stringent environmental regulations and safety standards.
- Product Substitutes: Carbon fiber prepregs, other composite materials.
- End-User Segmentation: Aerospace & Defense, Automotive, Wind Energy, Sports & Leisure dominate.
- M&A Trends: xx M&A deals recorded between 2019 and 2024, with a total transaction value of approximately xx Million. Consolidation is expected to continue.
Glass Prepreg Industry Market Trends & Opportunities
The glass prepreg market is experiencing robust growth, driven by increasing demand from key end-user industries. The market size is projected to reach xx Million by 2033, demonstrating a substantial CAGR. This expansion is fueled by several factors, including the rising adoption of lightweight materials in the automotive and aerospace sectors, the burgeoning wind energy industry, and the growing popularity of composite materials in sporting goods. Technological advancements, such as the development of high-performance resins and improved manufacturing processes, are further enhancing market growth. However, competitive pressures and fluctuating raw material prices present ongoing challenges. Market penetration rates are steadily increasing in developing economies, driven by infrastructure development projects and government initiatives promoting renewable energy.
Dominant Markets & Segments in Glass Prepreg Industry
The aerospace and defense segment currently holds the largest market share, driven by stringent requirements for lightweight, high-strength materials in aircraft and defense applications. Within resin types, thermosetting resins dominate due to their superior performance characteristics. Geographically, North America and Europe currently lead the market, but Asia-Pacific is expected to experience the fastest growth rate during the forecast period.
- Leading Region: North America
- Leading Segment (Resin Type): Thermosetting
- Leading Segment (End-user Industry): Aerospace and Defense
Key Growth Drivers:
- Aerospace & Defense: Increased aircraft production and military spending.
- Automotive: Lightweighting initiatives to improve fuel efficiency.
- Wind Turbine: Growth of renewable energy sector.
- Asia-Pacific Growth: Rapid infrastructure development and industrialization.
Glass Prepreg Industry Product Analysis
Glass prepreg products are characterized by a diverse range of fiber types, resin systems, and manufacturing processes. Innovations focus on improving mechanical properties, such as tensile strength and impact resistance, while also enhancing processability and reducing costs. This includes the development of novel resin systems with improved temperature resistance and durability, and the incorporation of advanced fiber architectures to optimize performance. The market fit for various glass prepreg products depends heavily on the specific application requirements and cost considerations.
Key Drivers, Barriers & Challenges in Glass Prepreg Industry
Key Drivers:
The increasing demand for lightweight and high-strength materials in various industries is a major driver. Government regulations promoting renewable energy and fuel-efficient vehicles further stimulate growth. Technological advancements in resin formulations and manufacturing processes continue to enhance product performance and reduce costs.
Challenges:
Fluctuations in raw material prices pose a significant challenge. Stringent environmental regulations and safety standards necessitate compliance costs. Intense competition from alternative materials like carbon fiber prepregs creates pressure on pricing and margins. Supply chain disruptions, particularly during periods of geopolitical instability, can also impact production and profitability. Estimated impact of supply chain issues on market growth is approximately xx% in 2025.
Growth Drivers in the Glass Prepreg Industry Market
The market's growth is fueled by increasing demand across various sectors, primarily aerospace and automotive. Technological advancements leading to stronger and lighter materials are crucial. Government support for renewable energy and infrastructure projects, particularly in emerging economies, further boosts demand.
Challenges Impacting Glass Prepreg Industry Growth
Raw material price volatility and supply chain disruptions pose significant challenges. Competition from alternative materials necessitates continuous innovation. Stricter environmental regulations increase compliance costs.
Key Players Shaping the Glass Prepreg Industry Market
- SGL Carbon
- Plastic Reinforcement Fabrics Ltd
- Solvay
- Sunrez Corporation
- ISOLA GROUP
- TEIJIN LIMITED
- KREMPEL GmbH
- Hexcel Corporation
- Gurit
- Axiom Materials Inc
Significant Glass Prepreg Industry Industry Milestones
- 2020: Introduction of a new high-temperature resin by Solvay.
- 2021: Acquisition of a smaller prepreg manufacturer by Hexcel Corporation.
- 2022: Launch of a new lightweight glass prepreg by SGL Carbon.
- 2023: Significant investment in R&D by TEIJIN LIMITED to develop sustainable prepreg solutions.
- 2024: New environmental regulations implemented in the EU impacting prepreg manufacturing processes.
Future Outlook for Glass Prepreg Industry Market
The glass prepreg market is poised for continued growth, driven by increasing demand from key sectors and ongoing technological advancements. Strategic partnerships and collaborations will likely shape industry dynamics. The focus on sustainability and the development of eco-friendly materials will present significant opportunities for companies. Market expansion into emerging economies is anticipated to contribute significantly to future growth.
Glass Prepreg Industry Segmentation
-
1. Resin Type
- 1.1. Thermosetting
- 1.2. Thermoplastic
-
2. End-user Industry
- 2.1. Aerospace and Defense
- 2.2. Automotive
- 2.3. Wind Turbine
- 2.4. Sports and Leisure
- 2.5. Other End-user Industries
Glass Prepreg Industry Segmentation By Geography
-
1. Asia Pacific
- 1.1. China
- 1.2. India
- 1.3. Japan
- 1.4. South Korea
- 1.5. ASEAN Countries
- 1.6. Rest of Asia Pacific
-
2. North America
- 2.1. United States
- 2.2. Canada
- 2.3. Mexico
-
3. Europe
- 3.1. Germany
- 3.2. United Kingdom
- 3.3. Italy
- 3.4. France
- 3.5. Rest of Europe
-
4. South America
- 4.1. Brazil
- 4.2. Argentina
- 4.3. Rest of South America
-
5. Middle East and Africa
- 5.1. Saudi Arabia
- 5.2. South Africa
- 5.3. Rest of Middle East and Africa
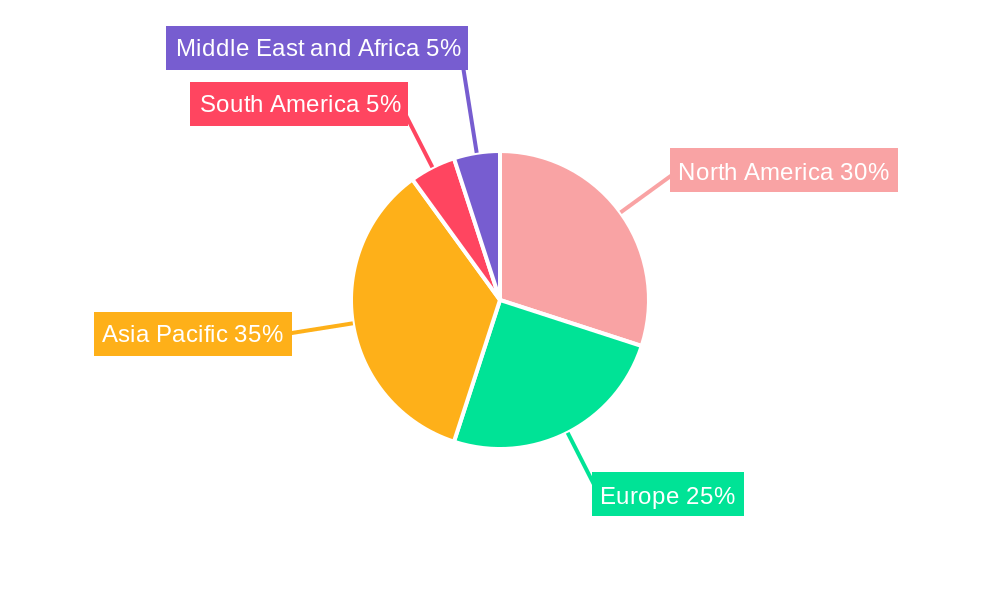
Glass Prepreg Industry Regional Market Share
Geographic Coverage of Glass Prepreg Industry
Glass Prepreg Industry REPORT HIGHLIGHTS
| Aspects | Details |
|---|---|
| Study Period | 2020-2034 |
| Base Year | 2025 |
| Estimated Year | 2026 |
| Forecast Period | 2026-2034 |
| Historical Period | 2020-2025 |
| Growth Rate | CAGR of 13.72% from 2020-2034 |
| Segmentation |
|
Table of Contents
- 1. Introduction
- 1.1. Research Scope
- 1.2. Market Segmentation
- 1.3. Research Objective
- 1.4. Definitions and Assumptions
- 2. Executive Summary
- 2.1. Market Snapshot
- 3. Market Dynamics
- 3.1. Market Drivers
- 3.2. Market Restrains
- 3.3. Market Trends
- 3.4. Market Opportunities
- 4. Market Factor Analysis
- 4.1. Porters Five Forces
- 4.1.1. Bargaining Power of Suppliers
- 4.1.2. Bargaining Power of Buyers
- 4.1.3. Threat of New Entrants
- 4.1.4. Threat of Substitutes
- 4.1.5. Competitive Rivalry
- 4.2. PESTEL analysis
- 4.3. BCG Analysis
- 4.3.1. Stars (High Growth, High Market Share)
- 4.3.2. Cash Cows (Low Growth, High Market Share)
- 4.3.3. Question Mark (High Growth, Low Market Share)
- 4.3.4. Dogs (Low Growth, Low Market Share)
- 4.4. Ansoff Matrix Analysis
- 4.5. Supply Chain Analysis
- 4.6. Regulatory Landscape
- 4.7. Current Market Potential and Opportunity Assessment (TAM–SAM–SOM Framework)
- 4.8. TIR Analyst Note
- 4.1. Porters Five Forces
- 5. Market Analysis, Insights and Forecast 2021-2033
- 5.1. Market Analysis, Insights and Forecast - by Resin Type
- 5.1.1. Thermosetting
- 5.1.2. Thermoplastic
- 5.2. Market Analysis, Insights and Forecast - by End-user Industry
- 5.2.1. Aerospace and Defense
- 5.2.2. Automotive
- 5.2.3. Wind Turbine
- 5.2.4. Sports and Leisure
- 5.2.5. Other End-user Industries
- 5.3. Market Analysis, Insights and Forecast - by Region
- 5.3.1. Asia Pacific
- 5.3.2. North America
- 5.3.3. Europe
- 5.3.4. South America
- 5.3.5. Middle East and Africa
- 5.1. Market Analysis, Insights and Forecast - by Resin Type
- 6. Global Glass Prepreg Industry Analysis, Insights and Forecast, 2021-2033
- 6.1. Market Analysis, Insights and Forecast - by Resin Type
- 6.1.1. Thermosetting
- 6.1.2. Thermoplastic
- 6.2. Market Analysis, Insights and Forecast - by End-user Industry
- 6.2.1. Aerospace and Defense
- 6.2.2. Automotive
- 6.2.3. Wind Turbine
- 6.2.4. Sports and Leisure
- 6.2.5. Other End-user Industries
- 6.1. Market Analysis, Insights and Forecast - by Resin Type
- 7. Asia Pacific Glass Prepreg Industry Analysis, Insights and Forecast, 2020-2032
- 7.1. Market Analysis, Insights and Forecast - by Resin Type
- 7.1.1. Thermosetting
- 7.1.2. Thermoplastic
- 7.2. Market Analysis, Insights and Forecast - by End-user Industry
- 7.2.1. Aerospace and Defense
- 7.2.2. Automotive
- 7.2.3. Wind Turbine
- 7.2.4. Sports and Leisure
- 7.2.5. Other End-user Industries
- 7.1. Market Analysis, Insights and Forecast - by Resin Type
- 8. North America Glass Prepreg Industry Analysis, Insights and Forecast, 2020-2032
- 8.1. Market Analysis, Insights and Forecast - by Resin Type
- 8.1.1. Thermosetting
- 8.1.2. Thermoplastic
- 8.2. Market Analysis, Insights and Forecast - by End-user Industry
- 8.2.1. Aerospace and Defense
- 8.2.2. Automotive
- 8.2.3. Wind Turbine
- 8.2.4. Sports and Leisure
- 8.2.5. Other End-user Industries
- 8.1. Market Analysis, Insights and Forecast - by Resin Type
- 9. Europe Glass Prepreg Industry Analysis, Insights and Forecast, 2020-2032
- 9.1. Market Analysis, Insights and Forecast - by Resin Type
- 9.1.1. Thermosetting
- 9.1.2. Thermoplastic
- 9.2. Market Analysis, Insights and Forecast - by End-user Industry
- 9.2.1. Aerospace and Defense
- 9.2.2. Automotive
- 9.2.3. Wind Turbine
- 9.2.4. Sports and Leisure
- 9.2.5. Other End-user Industries
- 9.1. Market Analysis, Insights and Forecast - by Resin Type
- 10. South America Glass Prepreg Industry Analysis, Insights and Forecast, 2020-2032
- 10.1. Market Analysis, Insights and Forecast - by Resin Type
- 10.1.1. Thermosetting
- 10.1.2. Thermoplastic
- 10.2. Market Analysis, Insights and Forecast - by End-user Industry
- 10.2.1. Aerospace and Defense
- 10.2.2. Automotive
- 10.2.3. Wind Turbine
- 10.2.4. Sports and Leisure
- 10.2.5. Other End-user Industries
- 10.1. Market Analysis, Insights and Forecast - by Resin Type
- 11. Middle East and Africa Glass Prepreg Industry Analysis, Insights and Forecast, 2020-2032
- 11.1. Market Analysis, Insights and Forecast - by Resin Type
- 11.1.1. Thermosetting
- 11.1.2. Thermoplastic
- 11.2. Market Analysis, Insights and Forecast - by End-user Industry
- 11.2.1. Aerospace and Defense
- 11.2.2. Automotive
- 11.2.3. Wind Turbine
- 11.2.4. Sports and Leisure
- 11.2.5. Other End-user Industries
- 11.1. Market Analysis, Insights and Forecast - by Resin Type
- 12. Competitive Analysis
- 12.1. Company Profiles
- 12.1.1 SGL Carbon
- 12.1.1.1. Company Overview
- 12.1.1.2. Products
- 12.1.1.3. Company Financials
- 12.1.1.4. SWOT Analysis
- 12.1.2 Plastic Reinforcement Fabrics Ltd
- 12.1.2.1. Company Overview
- 12.1.2.2. Products
- 12.1.2.3. Company Financials
- 12.1.2.4. SWOT Analysis
- 12.1.3 Solvay
- 12.1.3.1. Company Overview
- 12.1.3.2. Products
- 12.1.3.3. Company Financials
- 12.1.3.4. SWOT Analysis
- 12.1.4 Sunrez Corporation
- 12.1.4.1. Company Overview
- 12.1.4.2. Products
- 12.1.4.3. Company Financials
- 12.1.4.4. SWOT Analysis
- 12.1.5 ISOLA GROUP
- 12.1.5.1. Company Overview
- 12.1.5.2. Products
- 12.1.5.3. Company Financials
- 12.1.5.4. SWOT Analysis
- 12.1.6 TEIJIN LIMITED
- 12.1.6.1. Company Overview
- 12.1.6.2. Products
- 12.1.6.3. Company Financials
- 12.1.6.4. SWOT Analysis
- 12.1.7 KREMPEL GmbH
- 12.1.7.1. Company Overview
- 12.1.7.2. Products
- 12.1.7.3. Company Financials
- 12.1.7.4. SWOT Analysis
- 12.1.8 Hexcel Corporation
- 12.1.8.1. Company Overview
- 12.1.8.2. Products
- 12.1.8.3. Company Financials
- 12.1.8.4. SWOT Analysis
- 12.1.9 Gurit
- 12.1.9.1. Company Overview
- 12.1.9.2. Products
- 12.1.9.3. Company Financials
- 12.1.9.4. SWOT Analysis
- 12.1.10 Axiom Materials Inc
- 12.1.10.1. Company Overview
- 12.1.10.2. Products
- 12.1.10.3. Company Financials
- 12.1.10.4. SWOT Analysis
- 12.1.1 SGL Carbon
- 12.2. Market Entropy
- 12.2.1 Company's Key Areas Served
- 12.2.2 Recent Developments
- 12.3. Company Market Share Analysis 2025
- 12.3.1 Top 5 Companies Market Share Analysis
- 12.3.2 Top 3 Companies Market Share Analysis
- 12.4. List of Potential Customers
- 13. Research Methodology
List of Figures
- Figure 1: Global Glass Prepreg Industry Revenue Breakdown (billion, %) by Region 2025 & 2033
- Figure 2: Global Glass Prepreg Industry Volume Breakdown (K Tons, %) by Region 2025 & 2033
- Figure 3: Asia Pacific Glass Prepreg Industry Revenue (billion), by Resin Type 2025 & 2033
- Figure 4: Asia Pacific Glass Prepreg Industry Volume (K Tons), by Resin Type 2025 & 2033
- Figure 5: Asia Pacific Glass Prepreg Industry Revenue Share (%), by Resin Type 2025 & 2033
- Figure 6: Asia Pacific Glass Prepreg Industry Volume Share (%), by Resin Type 2025 & 2033
- Figure 7: Asia Pacific Glass Prepreg Industry Revenue (billion), by End-user Industry 2025 & 2033
- Figure 8: Asia Pacific Glass Prepreg Industry Volume (K Tons), by End-user Industry 2025 & 2033
- Figure 9: Asia Pacific Glass Prepreg Industry Revenue Share (%), by End-user Industry 2025 & 2033
- Figure 10: Asia Pacific Glass Prepreg Industry Volume Share (%), by End-user Industry 2025 & 2033
- Figure 11: Asia Pacific Glass Prepreg Industry Revenue (billion), by Country 2025 & 2033
- Figure 12: Asia Pacific Glass Prepreg Industry Volume (K Tons), by Country 2025 & 2033
- Figure 13: Asia Pacific Glass Prepreg Industry Revenue Share (%), by Country 2025 & 2033
- Figure 14: Asia Pacific Glass Prepreg Industry Volume Share (%), by Country 2025 & 2033
- Figure 15: North America Glass Prepreg Industry Revenue (billion), by Resin Type 2025 & 2033
- Figure 16: North America Glass Prepreg Industry Volume (K Tons), by Resin Type 2025 & 2033
- Figure 17: North America Glass Prepreg Industry Revenue Share (%), by Resin Type 2025 & 2033
- Figure 18: North America Glass Prepreg Industry Volume Share (%), by Resin Type 2025 & 2033
- Figure 19: North America Glass Prepreg Industry Revenue (billion), by End-user Industry 2025 & 2033
- Figure 20: North America Glass Prepreg Industry Volume (K Tons), by End-user Industry 2025 & 2033
- Figure 21: North America Glass Prepreg Industry Revenue Share (%), by End-user Industry 2025 & 2033
- Figure 22: North America Glass Prepreg Industry Volume Share (%), by End-user Industry 2025 & 2033
- Figure 23: North America Glass Prepreg Industry Revenue (billion), by Country 2025 & 2033
- Figure 24: North America Glass Prepreg Industry Volume (K Tons), by Country 2025 & 2033
- Figure 25: North America Glass Prepreg Industry Revenue Share (%), by Country 2025 & 2033
- Figure 26: North America Glass Prepreg Industry Volume Share (%), by Country 2025 & 2033
- Figure 27: Europe Glass Prepreg Industry Revenue (billion), by Resin Type 2025 & 2033
- Figure 28: Europe Glass Prepreg Industry Volume (K Tons), by Resin Type 2025 & 2033
- Figure 29: Europe Glass Prepreg Industry Revenue Share (%), by Resin Type 2025 & 2033
- Figure 30: Europe Glass Prepreg Industry Volume Share (%), by Resin Type 2025 & 2033
- Figure 31: Europe Glass Prepreg Industry Revenue (billion), by End-user Industry 2025 & 2033
- Figure 32: Europe Glass Prepreg Industry Volume (K Tons), by End-user Industry 2025 & 2033
- Figure 33: Europe Glass Prepreg Industry Revenue Share (%), by End-user Industry 2025 & 2033
- Figure 34: Europe Glass Prepreg Industry Volume Share (%), by End-user Industry 2025 & 2033
- Figure 35: Europe Glass Prepreg Industry Revenue (billion), by Country 2025 & 2033
- Figure 36: Europe Glass Prepreg Industry Volume (K Tons), by Country 2025 & 2033
- Figure 37: Europe Glass Prepreg Industry Revenue Share (%), by Country 2025 & 2033
- Figure 38: Europe Glass Prepreg Industry Volume Share (%), by Country 2025 & 2033
- Figure 39: South America Glass Prepreg Industry Revenue (billion), by Resin Type 2025 & 2033
- Figure 40: South America Glass Prepreg Industry Volume (K Tons), by Resin Type 2025 & 2033
- Figure 41: South America Glass Prepreg Industry Revenue Share (%), by Resin Type 2025 & 2033
- Figure 42: South America Glass Prepreg Industry Volume Share (%), by Resin Type 2025 & 2033
- Figure 43: South America Glass Prepreg Industry Revenue (billion), by End-user Industry 2025 & 2033
- Figure 44: South America Glass Prepreg Industry Volume (K Tons), by End-user Industry 2025 & 2033
- Figure 45: South America Glass Prepreg Industry Revenue Share (%), by End-user Industry 2025 & 2033
- Figure 46: South America Glass Prepreg Industry Volume Share (%), by End-user Industry 2025 & 2033
- Figure 47: South America Glass Prepreg Industry Revenue (billion), by Country 2025 & 2033
- Figure 48: South America Glass Prepreg Industry Volume (K Tons), by Country 2025 & 2033
- Figure 49: South America Glass Prepreg Industry Revenue Share (%), by Country 2025 & 2033
- Figure 50: South America Glass Prepreg Industry Volume Share (%), by Country 2025 & 2033
- Figure 51: Middle East and Africa Glass Prepreg Industry Revenue (billion), by Resin Type 2025 & 2033
- Figure 52: Middle East and Africa Glass Prepreg Industry Volume (K Tons), by Resin Type 2025 & 2033
- Figure 53: Middle East and Africa Glass Prepreg Industry Revenue Share (%), by Resin Type 2025 & 2033
- Figure 54: Middle East and Africa Glass Prepreg Industry Volume Share (%), by Resin Type 2025 & 2033
- Figure 55: Middle East and Africa Glass Prepreg Industry Revenue (billion), by End-user Industry 2025 & 2033
- Figure 56: Middle East and Africa Glass Prepreg Industry Volume (K Tons), by End-user Industry 2025 & 2033
- Figure 57: Middle East and Africa Glass Prepreg Industry Revenue Share (%), by End-user Industry 2025 & 2033
- Figure 58: Middle East and Africa Glass Prepreg Industry Volume Share (%), by End-user Industry 2025 & 2033
- Figure 59: Middle East and Africa Glass Prepreg Industry Revenue (billion), by Country 2025 & 2033
- Figure 60: Middle East and Africa Glass Prepreg Industry Volume (K Tons), by Country 2025 & 2033
- Figure 61: Middle East and Africa Glass Prepreg Industry Revenue Share (%), by Country 2025 & 2033
- Figure 62: Middle East and Africa Glass Prepreg Industry Volume Share (%), by Country 2025 & 2033
List of Tables
- Table 1: Global Glass Prepreg Industry Revenue billion Forecast, by Resin Type 2020 & 2033
- Table 2: Global Glass Prepreg Industry Volume K Tons Forecast, by Resin Type 2020 & 2033
- Table 3: Global Glass Prepreg Industry Revenue billion Forecast, by End-user Industry 2020 & 2033
- Table 4: Global Glass Prepreg Industry Volume K Tons Forecast, by End-user Industry 2020 & 2033
- Table 5: Global Glass Prepreg Industry Revenue billion Forecast, by Region 2020 & 2033
- Table 6: Global Glass Prepreg Industry Volume K Tons Forecast, by Region 2020 & 2033
- Table 7: Global Glass Prepreg Industry Revenue billion Forecast, by Resin Type 2020 & 2033
- Table 8: Global Glass Prepreg Industry Volume K Tons Forecast, by Resin Type 2020 & 2033
- Table 9: Global Glass Prepreg Industry Revenue billion Forecast, by End-user Industry 2020 & 2033
- Table 10: Global Glass Prepreg Industry Volume K Tons Forecast, by End-user Industry 2020 & 2033
- Table 11: Global Glass Prepreg Industry Revenue billion Forecast, by Country 2020 & 2033
- Table 12: Global Glass Prepreg Industry Volume K Tons Forecast, by Country 2020 & 2033
- Table 13: China Glass Prepreg Industry Revenue (billion) Forecast, by Application 2020 & 2033
- Table 14: China Glass Prepreg Industry Volume (K Tons) Forecast, by Application 2020 & 2033
- Table 15: India Glass Prepreg Industry Revenue (billion) Forecast, by Application 2020 & 2033
- Table 16: India Glass Prepreg Industry Volume (K Tons) Forecast, by Application 2020 & 2033
- Table 17: Japan Glass Prepreg Industry Revenue (billion) Forecast, by Application 2020 & 2033
- Table 18: Japan Glass Prepreg Industry Volume (K Tons) Forecast, by Application 2020 & 2033
- Table 19: South Korea Glass Prepreg Industry Revenue (billion) Forecast, by Application 2020 & 2033
- Table 20: South Korea Glass Prepreg Industry Volume (K Tons) Forecast, by Application 2020 & 2033
- Table 21: ASEAN Countries Glass Prepreg Industry Revenue (billion) Forecast, by Application 2020 & 2033
- Table 22: ASEAN Countries Glass Prepreg Industry Volume (K Tons) Forecast, by Application 2020 & 2033
- Table 23: Rest of Asia Pacific Glass Prepreg Industry Revenue (billion) Forecast, by Application 2020 & 2033
- Table 24: Rest of Asia Pacific Glass Prepreg Industry Volume (K Tons) Forecast, by Application 2020 & 2033
- Table 25: Global Glass Prepreg Industry Revenue billion Forecast, by Resin Type 2020 & 2033
- Table 26: Global Glass Prepreg Industry Volume K Tons Forecast, by Resin Type 2020 & 2033
- Table 27: Global Glass Prepreg Industry Revenue billion Forecast, by End-user Industry 2020 & 2033
- Table 28: Global Glass Prepreg Industry Volume K Tons Forecast, by End-user Industry 2020 & 2033
- Table 29: Global Glass Prepreg Industry Revenue billion Forecast, by Country 2020 & 2033
- Table 30: Global Glass Prepreg Industry Volume K Tons Forecast, by Country 2020 & 2033
- Table 31: United States Glass Prepreg Industry Revenue (billion) Forecast, by Application 2020 & 2033
- Table 32: United States Glass Prepreg Industry Volume (K Tons) Forecast, by Application 2020 & 2033
- Table 33: Canada Glass Prepreg Industry Revenue (billion) Forecast, by Application 2020 & 2033
- Table 34: Canada Glass Prepreg Industry Volume (K Tons) Forecast, by Application 2020 & 2033
- Table 35: Mexico Glass Prepreg Industry Revenue (billion) Forecast, by Application 2020 & 2033
- Table 36: Mexico Glass Prepreg Industry Volume (K Tons) Forecast, by Application 2020 & 2033
- Table 37: Global Glass Prepreg Industry Revenue billion Forecast, by Resin Type 2020 & 2033
- Table 38: Global Glass Prepreg Industry Volume K Tons Forecast, by Resin Type 2020 & 2033
- Table 39: Global Glass Prepreg Industry Revenue billion Forecast, by End-user Industry 2020 & 2033
- Table 40: Global Glass Prepreg Industry Volume K Tons Forecast, by End-user Industry 2020 & 2033
- Table 41: Global Glass Prepreg Industry Revenue billion Forecast, by Country 2020 & 2033
- Table 42: Global Glass Prepreg Industry Volume K Tons Forecast, by Country 2020 & 2033
- Table 43: Germany Glass Prepreg Industry Revenue (billion) Forecast, by Application 2020 & 2033
- Table 44: Germany Glass Prepreg Industry Volume (K Tons) Forecast, by Application 2020 & 2033
- Table 45: United Kingdom Glass Prepreg Industry Revenue (billion) Forecast, by Application 2020 & 2033
- Table 46: United Kingdom Glass Prepreg Industry Volume (K Tons) Forecast, by Application 2020 & 2033
- Table 47: Italy Glass Prepreg Industry Revenue (billion) Forecast, by Application 2020 & 2033
- Table 48: Italy Glass Prepreg Industry Volume (K Tons) Forecast, by Application 2020 & 2033
- Table 49: France Glass Prepreg Industry Revenue (billion) Forecast, by Application 2020 & 2033
- Table 50: France Glass Prepreg Industry Volume (K Tons) Forecast, by Application 2020 & 2033
- Table 51: Rest of Europe Glass Prepreg Industry Revenue (billion) Forecast, by Application 2020 & 2033
- Table 52: Rest of Europe Glass Prepreg Industry Volume (K Tons) Forecast, by Application 2020 & 2033
- Table 53: Global Glass Prepreg Industry Revenue billion Forecast, by Resin Type 2020 & 2033
- Table 54: Global Glass Prepreg Industry Volume K Tons Forecast, by Resin Type 2020 & 2033
- Table 55: Global Glass Prepreg Industry Revenue billion Forecast, by End-user Industry 2020 & 2033
- Table 56: Global Glass Prepreg Industry Volume K Tons Forecast, by End-user Industry 2020 & 2033
- Table 57: Global Glass Prepreg Industry Revenue billion Forecast, by Country 2020 & 2033
- Table 58: Global Glass Prepreg Industry Volume K Tons Forecast, by Country 2020 & 2033
- Table 59: Brazil Glass Prepreg Industry Revenue (billion) Forecast, by Application 2020 & 2033
- Table 60: Brazil Glass Prepreg Industry Volume (K Tons) Forecast, by Application 2020 & 2033
- Table 61: Argentina Glass Prepreg Industry Revenue (billion) Forecast, by Application 2020 & 2033
- Table 62: Argentina Glass Prepreg Industry Volume (K Tons) Forecast, by Application 2020 & 2033
- Table 63: Rest of South America Glass Prepreg Industry Revenue (billion) Forecast, by Application 2020 & 2033
- Table 64: Rest of South America Glass Prepreg Industry Volume (K Tons) Forecast, by Application 2020 & 2033
- Table 65: Global Glass Prepreg Industry Revenue billion Forecast, by Resin Type 2020 & 2033
- Table 66: Global Glass Prepreg Industry Volume K Tons Forecast, by Resin Type 2020 & 2033
- Table 67: Global Glass Prepreg Industry Revenue billion Forecast, by End-user Industry 2020 & 2033
- Table 68: Global Glass Prepreg Industry Volume K Tons Forecast, by End-user Industry 2020 & 2033
- Table 69: Global Glass Prepreg Industry Revenue billion Forecast, by Country 2020 & 2033
- Table 70: Global Glass Prepreg Industry Volume K Tons Forecast, by Country 2020 & 2033
- Table 71: Saudi Arabia Glass Prepreg Industry Revenue (billion) Forecast, by Application 2020 & 2033
- Table 72: Saudi Arabia Glass Prepreg Industry Volume (K Tons) Forecast, by Application 2020 & 2033
- Table 73: South Africa Glass Prepreg Industry Revenue (billion) Forecast, by Application 2020 & 2033
- Table 74: South Africa Glass Prepreg Industry Volume (K Tons) Forecast, by Application 2020 & 2033
- Table 75: Rest of Middle East and Africa Glass Prepreg Industry Revenue (billion) Forecast, by Application 2020 & 2033
- Table 76: Rest of Middle East and Africa Glass Prepreg Industry Volume (K Tons) Forecast, by Application 2020 & 2033
Frequently Asked Questions
1. What is the projected Compound Annual Growth Rate (CAGR) of the Glass Prepreg Industry?
The projected CAGR is approximately 13.72%.
2. Which companies are prominent players in the Glass Prepreg Industry?
Key companies in the market include SGL Carbon, Plastic Reinforcement Fabrics Ltd, Solvay, Sunrez Corporation, ISOLA GROUP, TEIJIN LIMITED, KREMPEL GmbH, Hexcel Corporation, Gurit, Axiom Materials Inc.
3. What are the main segments of the Glass Prepreg Industry?
The market segments include Resin Type, End-user Industry.
4. Can you provide details about the market size?
The market size is estimated to be USD 8.89 billion as of 2022.
5. What are some drivers contributing to market growth?
; Increasing Demand for Airplanes in the Asia-Pacific Region; Growing Usage as a Substitute for Asbestos; Others Drivers.
6. What are the notable trends driving market growth?
Aerospace and Defense Industry to Dominate the Market.
7. Are there any restraints impacting market growth?
; Carcinogenic Effect of Glass Prepreg; Impact of COVID-19 Pandemic; Other Restraints.
8. Can you provide examples of recent developments in the market?
N/A
9. What pricing options are available for accessing the report?
Pricing options include single-user, multi-user, and enterprise licenses priced at USD 4750, USD 5250, and USD 8750 respectively.
10. Is the market size provided in terms of value or volume?
The market size is provided in terms of value, measured in billion and volume, measured in K Tons.
11. Are there any specific market keywords associated with the report?
Yes, the market keyword associated with the report is "Glass Prepreg Industry," which aids in identifying and referencing the specific market segment covered.
12. How do I determine which pricing option suits my needs best?
The pricing options vary based on user requirements and access needs. Individual users may opt for single-user licenses, while businesses requiring broader access may choose multi-user or enterprise licenses for cost-effective access to the report.
13. Are there any additional resources or data provided in the Glass Prepreg Industry report?
While the report offers comprehensive insights, it's advisable to review the specific contents or supplementary materials provided to ascertain if additional resources or data are available.
14. How can I stay updated on further developments or reports in the Glass Prepreg Industry?
To stay informed about further developments, trends, and reports in the Glass Prepreg Industry, consider subscribing to industry newsletters, following relevant companies and organizations, or regularly checking reputable industry news sources and publications.
Methodology
Step 1 - Identification of Relevant Samples Size from Population Database


Step 2 - Approaches for Defining Global Market Size (Value, Volume* & Price*)

Note*: In applicable scenarios
Step 3 - Data Sources
Primary Research
- Web Analytics
- Survey Reports
- Research Institute
- Latest Research Reports
- Opinion Leaders
Secondary Research
- Annual Reports
- White Paper
- Latest Press Release
- Industry Association
- Paid Database
- Investor Presentations

Step 4 - Data Triangulation
Involves using different sources of information in order to increase the validity of a study
These sources are likely to be stakeholders in a program - participants, other researchers, program staff, other community members, and so on.
Then we put all data in single framework & apply various statistical tools to find out the dynamic on the market.
During the analysis stage, feedback from the stakeholder groups would be compared to determine areas of agreement as well as areas of divergence