

Key Insights
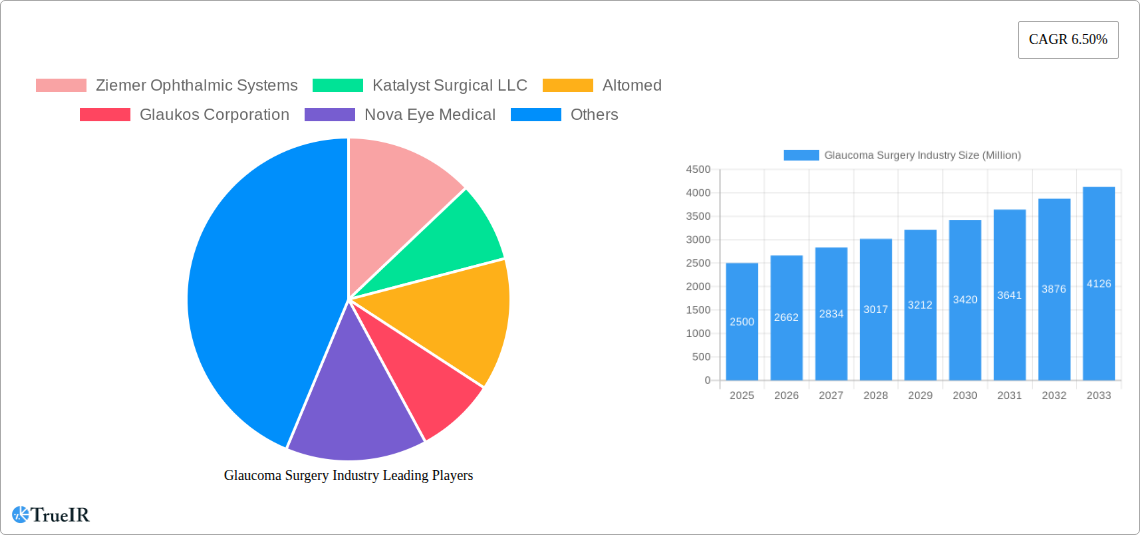
The glaucoma surgery market, valued at approximately $2.5 billion in 2025, is projected to experience robust growth, driven by rising glaucoma prevalence globally, an aging population, and technological advancements in minimally invasive surgical techniques. The market's Compound Annual Growth Rate (CAGR) of 6.50% from 2025 to 2033 indicates significant expansion opportunities. Key growth drivers include the increasing adoption of laser-based surgeries like Selective Laser Trabeculoplasty (SLT) and micropulse laser therapy, offering less invasive and faster recovery options compared to traditional surgical methods. The segment of minimally invasive glaucoma surgery (MIGS) is anticipated to witness the fastest growth due to its advantages in terms of reduced surgical trauma and improved patient outcomes. Furthermore, continuous innovation in glaucoma drainage devices and advanced diagnostic tools is expected to fuel market expansion. However, the high cost of advanced surgical procedures and equipment, along with the need for skilled ophthalmologists, may pose some challenges to market growth in certain regions. The market is segmented by product type (Glaucoma Drainage Devices, Laser Systems, Punches, Probes, Other Products), surgical method (Traditional, MIGS, Laser Surgery), and end-user (Hospitals, Ophthalmic Clinics, Other End Users). North America and Europe currently hold significant market shares, but the Asia Pacific region is poised for substantial growth due to increasing healthcare expenditure and rising awareness of glaucoma.
The competitive landscape is characterized by the presence of established players like Alcon, Johnson & Johnson, and Abbott Laboratories, alongside specialized companies like Glaukos Corporation and Ziemer Ophthalmic Systems. These companies are focused on developing innovative products, expanding their geographic reach, and forging strategic partnerships to consolidate their market position. The increasing adoption of telemedicine and remote patient monitoring technologies is expected to further influence market growth by improving access to glaucoma care, particularly in underserved areas. The forecast period (2025-2033) anticipates a continued upward trajectory, with a significant increase in the market size driven by factors mentioned above and fueled by the successful adoption of technological advancements that enhance the patient experience and effectiveness of glaucoma treatment.
Glaucoma Surgery Industry Market Report: 2019-2033
This comprehensive report provides a detailed analysis of the Glaucoma Surgery industry, covering market size, growth trends, competitive landscape, and future outlook from 2019 to 2033. The study period is 2019-2033, with 2025 as the base and estimated year. The forecast period is 2025-2033, and the historical period is 2019-2024. This report is essential for industry stakeholders, investors, and researchers seeking insights into this dynamic market. The global Glaucoma Surgery market is projected to reach USD xx Million by 2033.
Glaucoma Surgery Industry Market Structure & Competitive Landscape
The glaucoma surgery market is characterized by a moderately concentrated structure with several key players dominating the landscape. The Herfindahl-Hirschman Index (HHI) is estimated at xx, indicating a moderately competitive environment. Innovation is a key driver, with companies continuously developing new products and surgical techniques to improve patient outcomes and market share. Regulatory approvals play a significant role, impacting market entry and product adoption. The industry also faces competitive pressure from substitute therapies, such as medication management. The market is segmented by product (Glaucoma Drainage Devices, Laser Systems, Punches, Probes, Other Products), surgery method (Traditional, Minimally Invasive, Laser Surgery), and end-user (Hospitals, Ophthalmic Clinics, Other End Users). Significant M&A activity reflects the industry's pursuit of growth and technological advancements; recent years have seen approximately xx Million USD in M&A volume.
- Market Concentration: Moderately concentrated, with HHI estimated at xx.
- Innovation Drivers: Development of minimally invasive techniques, advanced laser systems, and improved drainage devices.
- Regulatory Impacts: Stringent regulatory approvals influence market entry and product adoption.
- Product Substitutes: Medication management poses a competitive challenge.
- End-User Segmentation: Hospitals and ophthalmic clinics represent the majority of end-users.
- M&A Trends: Significant activity, with approximately xx Million USD in M&A volume in recent years.
Glaucoma Surgery Industry Market Trends & Opportunities
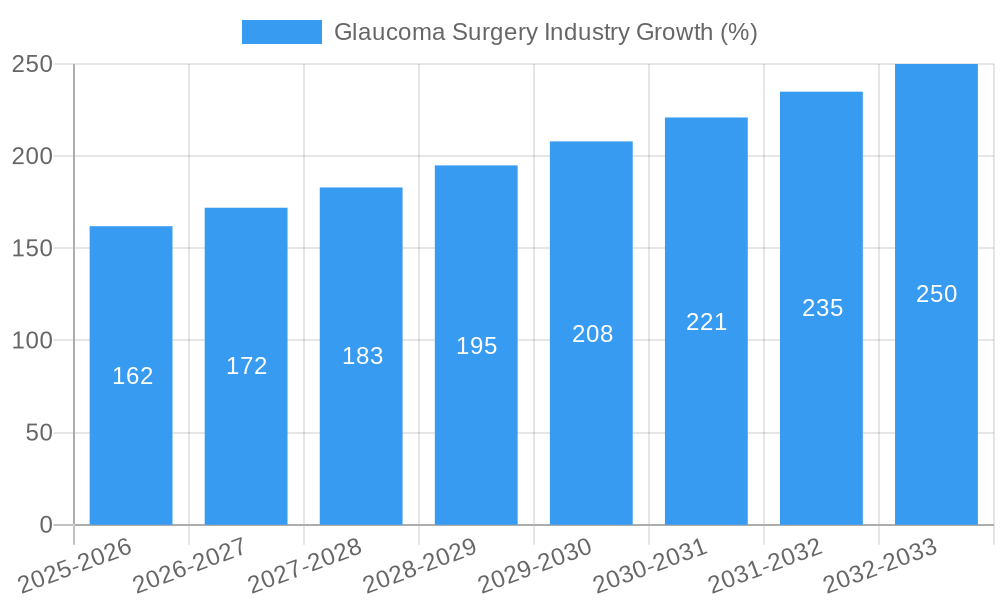
The glaucoma surgery market exhibits robust growth, driven by increasing prevalence of glaucoma, advancements in surgical techniques, and rising healthcare expenditure. The market is projected to experience a Compound Annual Growth Rate (CAGR) of xx% during the forecast period (2025-2033). Technological advancements, including minimally invasive glaucoma surgery (MIGS), are gaining traction, increasing market penetration rates. Consumer preferences are shifting towards less invasive procedures with faster recovery times. Competitive dynamics are shaped by continuous product innovation and strategic partnerships. Market penetration of MIGS procedures is estimated at xx% in 2025, projected to reach xx% by 2033. Emerging markets present significant growth opportunities due to rising awareness and increasing access to healthcare.
Dominant Markets & Segments in Glaucoma Surgery Industry
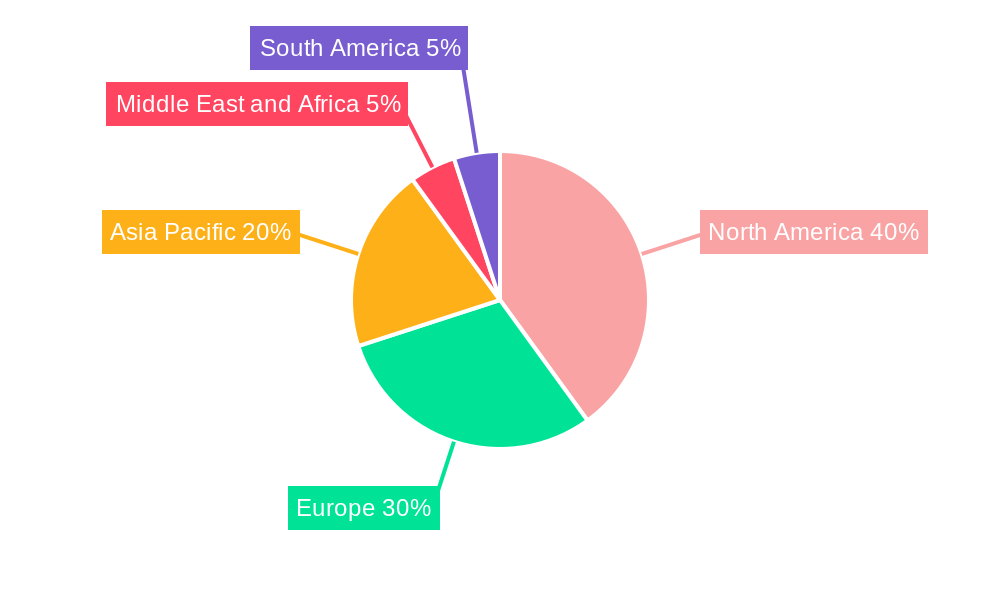
The North American region currently dominates the glaucoma surgery market, followed by Europe and Asia Pacific. Within product segments, Glaucoma Drainage Devices hold the largest market share, driven by their effectiveness in managing severe glaucoma. Minimally Invasive Glaucoma Surgery (MIGS) is the fastest-growing surgical method segment due to its advantages in terms of reduced invasiveness and shorter recovery times. Hospitals represent the largest end-user segment due to their greater capacity and specialized infrastructure.
- Key Growth Drivers:
- North America: High prevalence of glaucoma, advanced healthcare infrastructure, and high healthcare spending.
- Europe: Growing aging population and increasing adoption of advanced surgical techniques.
- Asia Pacific: Rising prevalence of glaucoma, increasing healthcare awareness, and expanding healthcare infrastructure.
- Market Dominance: North America holds the largest market share, with the United States being a key driver.
Glaucoma Surgery Industry Product Analysis
The glaucoma surgery market offers a diverse range of products, including drainage devices, laser systems, and surgical instruments. Technological advancements are focused on improving surgical precision, minimizing invasiveness, and enhancing patient outcomes. The development of minimally invasive glaucoma surgery (MIGS) devices represents a significant product innovation, offering advantages over traditional surgical procedures. The competitive advantage lies in offering superior efficacy, safety, and ease of use, coupled with strong regulatory approvals and market access strategies.
Key Drivers, Barriers & Challenges in Glaucoma Surgery Industry
Key Drivers: The increasing prevalence of glaucoma globally, coupled with technological advancements in minimally invasive surgical techniques and the rising demand for better patient outcomes are major growth drivers. Favorable regulatory environments in certain regions and increasing healthcare expenditure also play a role.
Challenges: High costs associated with surgical procedures and advanced devices may limit access to treatment in some regions. Stringent regulatory approvals and potential supply chain disruptions pose significant challenges. Intense competition among established players and emerging companies also creates a dynamic and challenging market landscape. The estimated impact of regulatory hurdles on market growth is xx%.
Growth Drivers in the Glaucoma Surgery Industry Market
Technological advancements in minimally invasive glaucoma surgery (MIGS), coupled with an increasing prevalence of glaucoma and rising healthcare expenditure, are significant growth drivers. Government initiatives promoting eye care and favorable regulatory environments further fuel market expansion.
Challenges Impacting Glaucoma Surgery Industry Growth
High procedure costs and device prices limit accessibility, while stringent regulatory approvals and potential supply chain disruptions create market entry barriers. Intense competition and the availability of alternative treatment options pose significant challenges to market growth.
Key Players Shaping the Glaucoma Surgery Industry Market
- Ziemer Ophthalmic Systems
- Katalyst Surgical LLC
- Altomed
- Glaukos Corporation
- Nova Eye Medical
- Lumenis
- ASICO LLC
- Johnson and Johnson
- Allergan
- Abbott Laboratories Inc
- Alcon
- Carl Zeiss Meditec
Significant Glaucoma Surgery Industry Milestones
- June 2022: AbbVie announced a USD 60 Million acquisition of iSTAR Medical's minimally invasive glaucoma device, currently undergoing premarket approval in the US.
- June 2022: Iridex Corporation received regulatory approval (NMPA) to market its Cyclo G6 glaucoma treatment platform in China.
Future Outlook for Glaucoma Surgery Industry Market
The glaucoma surgery market is poised for continued growth, driven by technological innovation, increasing prevalence of glaucoma, and expanding access to healthcare. Strategic partnerships, product diversification, and expansion into emerging markets represent key opportunities. The market is expected to experience significant growth in the coming years, fueled by these factors and an increasing focus on minimally invasive procedures.
Glaucoma Surgery Industry Segmentation
-
1. Product
- 1.1. Glaucoma Drainage Device
- 1.2. Laser system
- 1.3. Punches
- 1.4. Probes
- 1.5. Other Products
-
2. Surgery Method
- 2.1. Traditional glaucoma surgery
- 2.2. Minimal invasive glaucoma surgery
- 2.3. Laser Surgery
-
3. End User
- 3.1. Hospitals
- 3.2. Ophtalmic Clinics
- 3.3. Other End Users
Glaucoma Surgery Industry Segmentation By Geography
-
1. North America
- 1.1. United States
- 1.2. Canada
- 1.3. Mexico
-
2. Europe
- 2.1. Germany
- 2.2. United Kingdom
- 2.3. France
- 2.4. Italy
- 2.5. Spain
- 2.6. Rest of Europe
-
3. Asia Pacific
- 3.1. China
- 3.2. Japan
- 3.3. India
- 3.4. Australia
- 3.5. South Korea
- 3.6. Rest of Asia Pacific
-
4. Middle East and Africa
- 4.1. GCC
- 4.2. South Africa
- 4.3. Rest of Middle East and Africa
-
5. South America
- 5.1. Brazil
- 5.2. Argentina
- 5.3. Rest of South America
Glaucoma Surgery Industry REPORT HIGHLIGHTS
| Aspects | Details |
|---|---|
| Study Period | 2019-2033 |
| Base Year | 2024 |
| Estimated Year | 2025 |
| Forecast Period | 2025-2033 |
| Historical Period | 2019-2024 |
| Growth Rate | CAGR of 6.50% from 2019-2033 |
| Segmentation |
|
Table of Contents
- 1. Introduction
- 1.1. Research Scope
- 1.2. Market Segmentation
- 1.3. Research Methodology
- 1.4. Definitions and Assumptions
- 2. Executive Summary
- 2.1. Introduction
- 3. Market Dynamics
- 3.1. Introduction
- 3.2. Market Drivers
- 3.2.1. Rising Prevalence of Glaucoma; Increasing Geriatric Population; Growing Adoption of Surgical Treatments for Glaucoma
- 3.3. Market Restrains
- 3.3.1. Availability of Alternative Treatment Methods
- 3.4. Market Trends
- 3.4.1. Minimal Invasive Glaucoma Surgery is Expected to Witness Growth Over The Forecast Period
- 4. Market Factor Analysis
- 4.1. Porters Five Forces
- 4.2. Supply/Value Chain
- 4.3. PESTEL analysis
- 4.4. Market Entropy
- 4.5. Patent/Trademark Analysis
- 5. Global Glaucoma Surgery Industry Analysis, Insights and Forecast, 2019-2031
- 5.1. Market Analysis, Insights and Forecast - by Product
- 5.1.1. Glaucoma Drainage Device
- 5.1.2. Laser system
- 5.1.3. Punches
- 5.1.4. Probes
- 5.1.5. Other Products
- 5.2. Market Analysis, Insights and Forecast - by Surgery Method
- 5.2.1. Traditional glaucoma surgery
- 5.2.2. Minimal invasive glaucoma surgery
- 5.2.3. Laser Surgery
- 5.3. Market Analysis, Insights and Forecast - by End User
- 5.3.1. Hospitals
- 5.3.2. Ophtalmic Clinics
- 5.3.3. Other End Users
- 5.4. Market Analysis, Insights and Forecast - by Region
- 5.4.1. North America
- 5.4.2. Europe
- 5.4.3. Asia Pacific
- 5.4.4. Middle East and Africa
- 5.4.5. South America
- 5.1. Market Analysis, Insights and Forecast - by Product
- 6. North America Glaucoma Surgery Industry Analysis, Insights and Forecast, 2019-2031
- 6.1. Market Analysis, Insights and Forecast - by Product
- 6.1.1. Glaucoma Drainage Device
- 6.1.2. Laser system
- 6.1.3. Punches
- 6.1.4. Probes
- 6.1.5. Other Products
- 6.2. Market Analysis, Insights and Forecast - by Surgery Method
- 6.2.1. Traditional glaucoma surgery
- 6.2.2. Minimal invasive glaucoma surgery
- 6.2.3. Laser Surgery
- 6.3. Market Analysis, Insights and Forecast - by End User
- 6.3.1. Hospitals
- 6.3.2. Ophtalmic Clinics
- 6.3.3. Other End Users
- 6.1. Market Analysis, Insights and Forecast - by Product
- 7. Europe Glaucoma Surgery Industry Analysis, Insights and Forecast, 2019-2031
- 7.1. Market Analysis, Insights and Forecast - by Product
- 7.1.1. Glaucoma Drainage Device
- 7.1.2. Laser system
- 7.1.3. Punches
- 7.1.4. Probes
- 7.1.5. Other Products
- 7.2. Market Analysis, Insights and Forecast - by Surgery Method
- 7.2.1. Traditional glaucoma surgery
- 7.2.2. Minimal invasive glaucoma surgery
- 7.2.3. Laser Surgery
- 7.3. Market Analysis, Insights and Forecast - by End User
- 7.3.1. Hospitals
- 7.3.2. Ophtalmic Clinics
- 7.3.3. Other End Users
- 7.1. Market Analysis, Insights and Forecast - by Product
- 8. Asia Pacific Glaucoma Surgery Industry Analysis, Insights and Forecast, 2019-2031
- 8.1. Market Analysis, Insights and Forecast - by Product
- 8.1.1. Glaucoma Drainage Device
- 8.1.2. Laser system
- 8.1.3. Punches
- 8.1.4. Probes
- 8.1.5. Other Products
- 8.2. Market Analysis, Insights and Forecast - by Surgery Method
- 8.2.1. Traditional glaucoma surgery
- 8.2.2. Minimal invasive glaucoma surgery
- 8.2.3. Laser Surgery
- 8.3. Market Analysis, Insights and Forecast - by End User
- 8.3.1. Hospitals
- 8.3.2. Ophtalmic Clinics
- 8.3.3. Other End Users
- 8.1. Market Analysis, Insights and Forecast - by Product
- 9. Middle East and Africa Glaucoma Surgery Industry Analysis, Insights and Forecast, 2019-2031
- 9.1. Market Analysis, Insights and Forecast - by Product
- 9.1.1. Glaucoma Drainage Device
- 9.1.2. Laser system
- 9.1.3. Punches
- 9.1.4. Probes
- 9.1.5. Other Products
- 9.2. Market Analysis, Insights and Forecast - by Surgery Method
- 9.2.1. Traditional glaucoma surgery
- 9.2.2. Minimal invasive glaucoma surgery
- 9.2.3. Laser Surgery
- 9.3. Market Analysis, Insights and Forecast - by End User
- 9.3.1. Hospitals
- 9.3.2. Ophtalmic Clinics
- 9.3.3. Other End Users
- 9.1. Market Analysis, Insights and Forecast - by Product
- 10. South America Glaucoma Surgery Industry Analysis, Insights and Forecast, 2019-2031
- 10.1. Market Analysis, Insights and Forecast - by Product
- 10.1.1. Glaucoma Drainage Device
- 10.1.2. Laser system
- 10.1.3. Punches
- 10.1.4. Probes
- 10.1.5. Other Products
- 10.2. Market Analysis, Insights and Forecast - by Surgery Method
- 10.2.1. Traditional glaucoma surgery
- 10.2.2. Minimal invasive glaucoma surgery
- 10.2.3. Laser Surgery
- 10.3. Market Analysis, Insights and Forecast - by End User
- 10.3.1. Hospitals
- 10.3.2. Ophtalmic Clinics
- 10.3.3. Other End Users
- 10.1. Market Analysis, Insights and Forecast - by Product
- 11. North America Glaucoma Surgery Industry Analysis, Insights and Forecast, 2019-2031
- 11.1. Market Analysis, Insights and Forecast - By Country/Sub-region
- 11.1.1. undefined
- 12. Europe Glaucoma Surgery Industry Analysis, Insights and Forecast, 2019-2031
- 12.1. Market Analysis, Insights and Forecast - By Country/Sub-region
- 12.1.1. undefined
- 13. Asia Pacific Glaucoma Surgery Industry Analysis, Insights and Forecast, 2019-2031
- 13.1. Market Analysis, Insights and Forecast - By Country/Sub-region
- 13.1.1. undefined
- 14. Middle East and Africa Glaucoma Surgery Industry Analysis, Insights and Forecast, 2019-2031
- 14.1. Market Analysis, Insights and Forecast - By Country/Sub-region
- 14.1.1. undefined
- 15. South America Glaucoma Surgery Industry Analysis, Insights and Forecast, 2019-2031
- 15.1. Market Analysis, Insights and Forecast - By Country/Sub-region
- 15.1.1. undefined
- 16. Competitive Analysis
- 16.1. Global Market Share Analysis 2024
- 16.2. Company Profiles
- 16.2.1 Ziemer Ophthalmic Systems
- 16.2.1.1. Overview
- 16.2.1.2. Products
- 16.2.1.3. SWOT Analysis
- 16.2.1.4. Recent Developments
- 16.2.1.5. Financials (Based on Availability)
- 16.2.2 Katalyst Surgical LLC
- 16.2.2.1. Overview
- 16.2.2.2. Products
- 16.2.2.3. SWOT Analysis
- 16.2.2.4. Recent Developments
- 16.2.2.5. Financials (Based on Availability)
- 16.2.3 Altomed
- 16.2.3.1. Overview
- 16.2.3.2. Products
- 16.2.3.3. SWOT Analysis
- 16.2.3.4. Recent Developments
- 16.2.3.5. Financials (Based on Availability)
- 16.2.4 Glaukos Corporation
- 16.2.4.1. Overview
- 16.2.4.2. Products
- 16.2.4.3. SWOT Analysis
- 16.2.4.4. Recent Developments
- 16.2.4.5. Financials (Based on Availability)
- 16.2.5 Nova Eye Medical
- 16.2.5.1. Overview
- 16.2.5.2. Products
- 16.2.5.3. SWOT Analysis
- 16.2.5.4. Recent Developments
- 16.2.5.5. Financials (Based on Availability)
- 16.2.6 Lumenis
- 16.2.6.1. Overview
- 16.2.6.2. Products
- 16.2.6.3. SWOT Analysis
- 16.2.6.4. Recent Developments
- 16.2.6.5. Financials (Based on Availability)
- 16.2.7 ASICO LLC
- 16.2.7.1. Overview
- 16.2.7.2. Products
- 16.2.7.3. SWOT Analysis
- 16.2.7.4. Recent Developments
- 16.2.7.5. Financials (Based on Availability)
- 16.2.8 Johnson and Johnson
- 16.2.8.1. Overview
- 16.2.8.2. Products
- 16.2.8.3. SWOT Analysis
- 16.2.8.4. Recent Developments
- 16.2.8.5. Financials (Based on Availability)
- 16.2.9 Allergan
- 16.2.9.1. Overview
- 16.2.9.2. Products
- 16.2.9.3. SWOT Analysis
- 16.2.9.4. Recent Developments
- 16.2.9.5. Financials (Based on Availability)
- 16.2.10 Abbott Laboratories Inc
- 16.2.10.1. Overview
- 16.2.10.2. Products
- 16.2.10.3. SWOT Analysis
- 16.2.10.4. Recent Developments
- 16.2.10.5. Financials (Based on Availability)
- 16.2.11 Alcon
- 16.2.11.1. Overview
- 16.2.11.2. Products
- 16.2.11.3. SWOT Analysis
- 16.2.11.4. Recent Developments
- 16.2.11.5. Financials (Based on Availability)
- 16.2.12 Carl Zeiss Meditec
- 16.2.12.1. Overview
- 16.2.12.2. Products
- 16.2.12.3. SWOT Analysis
- 16.2.12.4. Recent Developments
- 16.2.12.5. Financials (Based on Availability)
- 16.2.1 Ziemer Ophthalmic Systems
List of Figures
- Figure 1: Global Glaucoma Surgery Industry Revenue Breakdown (Million, %) by Region 2024 & 2032
- Figure 2: Global Glaucoma Surgery Industry Volume Breakdown (K Unit, %) by Region 2024 & 2032
- Figure 3: North America Glaucoma Surgery Industry Revenue (Million), by Country 2024 & 2032
- Figure 4: North America Glaucoma Surgery Industry Volume (K Unit), by Country 2024 & 2032
- Figure 5: North America Glaucoma Surgery Industry Revenue Share (%), by Country 2024 & 2032
- Figure 6: North America Glaucoma Surgery Industry Volume Share (%), by Country 2024 & 2032
- Figure 7: Europe Glaucoma Surgery Industry Revenue (Million), by Country 2024 & 2032
- Figure 8: Europe Glaucoma Surgery Industry Volume (K Unit), by Country 2024 & 2032
- Figure 9: Europe Glaucoma Surgery Industry Revenue Share (%), by Country 2024 & 2032
- Figure 10: Europe Glaucoma Surgery Industry Volume Share (%), by Country 2024 & 2032
- Figure 11: Asia Pacific Glaucoma Surgery Industry Revenue (Million), by Country 2024 & 2032
- Figure 12: Asia Pacific Glaucoma Surgery Industry Volume (K Unit), by Country 2024 & 2032
- Figure 13: Asia Pacific Glaucoma Surgery Industry Revenue Share (%), by Country 2024 & 2032
- Figure 14: Asia Pacific Glaucoma Surgery Industry Volume Share (%), by Country 2024 & 2032
- Figure 15: Middle East and Africa Glaucoma Surgery Industry Revenue (Million), by Country 2024 & 2032
- Figure 16: Middle East and Africa Glaucoma Surgery Industry Volume (K Unit), by Country 2024 & 2032
- Figure 17: Middle East and Africa Glaucoma Surgery Industry Revenue Share (%), by Country 2024 & 2032
- Figure 18: Middle East and Africa Glaucoma Surgery Industry Volume Share (%), by Country 2024 & 2032
- Figure 19: South America Glaucoma Surgery Industry Revenue (Million), by Country 2024 & 2032
- Figure 20: South America Glaucoma Surgery Industry Volume (K Unit), by Country 2024 & 2032
- Figure 21: South America Glaucoma Surgery Industry Revenue Share (%), by Country 2024 & 2032
- Figure 22: South America Glaucoma Surgery Industry Volume Share (%), by Country 2024 & 2032
- Figure 23: North America Glaucoma Surgery Industry Revenue (Million), by Product 2024 & 2032
- Figure 24: North America Glaucoma Surgery Industry Volume (K Unit), by Product 2024 & 2032
- Figure 25: North America Glaucoma Surgery Industry Revenue Share (%), by Product 2024 & 2032
- Figure 26: North America Glaucoma Surgery Industry Volume Share (%), by Product 2024 & 2032
- Figure 27: North America Glaucoma Surgery Industry Revenue (Million), by Surgery Method 2024 & 2032
- Figure 28: North America Glaucoma Surgery Industry Volume (K Unit), by Surgery Method 2024 & 2032
- Figure 29: North America Glaucoma Surgery Industry Revenue Share (%), by Surgery Method 2024 & 2032
- Figure 30: North America Glaucoma Surgery Industry Volume Share (%), by Surgery Method 2024 & 2032
- Figure 31: North America Glaucoma Surgery Industry Revenue (Million), by End User 2024 & 2032
- Figure 32: North America Glaucoma Surgery Industry Volume (K Unit), by End User 2024 & 2032
- Figure 33: North America Glaucoma Surgery Industry Revenue Share (%), by End User 2024 & 2032
- Figure 34: North America Glaucoma Surgery Industry Volume Share (%), by End User 2024 & 2032
- Figure 35: North America Glaucoma Surgery Industry Revenue (Million), by Country 2024 & 2032
- Figure 36: North America Glaucoma Surgery Industry Volume (K Unit), by Country 2024 & 2032
- Figure 37: North America Glaucoma Surgery Industry Revenue Share (%), by Country 2024 & 2032
- Figure 38: North America Glaucoma Surgery Industry Volume Share (%), by Country 2024 & 2032
- Figure 39: Europe Glaucoma Surgery Industry Revenue (Million), by Product 2024 & 2032
- Figure 40: Europe Glaucoma Surgery Industry Volume (K Unit), by Product 2024 & 2032
- Figure 41: Europe Glaucoma Surgery Industry Revenue Share (%), by Product 2024 & 2032
- Figure 42: Europe Glaucoma Surgery Industry Volume Share (%), by Product 2024 & 2032
- Figure 43: Europe Glaucoma Surgery Industry Revenue (Million), by Surgery Method 2024 & 2032
- Figure 44: Europe Glaucoma Surgery Industry Volume (K Unit), by Surgery Method 2024 & 2032
- Figure 45: Europe Glaucoma Surgery Industry Revenue Share (%), by Surgery Method 2024 & 2032
- Figure 46: Europe Glaucoma Surgery Industry Volume Share (%), by Surgery Method 2024 & 2032
- Figure 47: Europe Glaucoma Surgery Industry Revenue (Million), by End User 2024 & 2032
- Figure 48: Europe Glaucoma Surgery Industry Volume (K Unit), by End User 2024 & 2032
- Figure 49: Europe Glaucoma Surgery Industry Revenue Share (%), by End User 2024 & 2032
- Figure 50: Europe Glaucoma Surgery Industry Volume Share (%), by End User 2024 & 2032
- Figure 51: Europe Glaucoma Surgery Industry Revenue (Million), by Country 2024 & 2032
- Figure 52: Europe Glaucoma Surgery Industry Volume (K Unit), by Country 2024 & 2032
- Figure 53: Europe Glaucoma Surgery Industry Revenue Share (%), by Country 2024 & 2032
- Figure 54: Europe Glaucoma Surgery Industry Volume Share (%), by Country 2024 & 2032
- Figure 55: Asia Pacific Glaucoma Surgery Industry Revenue (Million), by Product 2024 & 2032
- Figure 56: Asia Pacific Glaucoma Surgery Industry Volume (K Unit), by Product 2024 & 2032
- Figure 57: Asia Pacific Glaucoma Surgery Industry Revenue Share (%), by Product 2024 & 2032
- Figure 58: Asia Pacific Glaucoma Surgery Industry Volume Share (%), by Product 2024 & 2032
- Figure 59: Asia Pacific Glaucoma Surgery Industry Revenue (Million), by Surgery Method 2024 & 2032
- Figure 60: Asia Pacific Glaucoma Surgery Industry Volume (K Unit), by Surgery Method 2024 & 2032
- Figure 61: Asia Pacific Glaucoma Surgery Industry Revenue Share (%), by Surgery Method 2024 & 2032
- Figure 62: Asia Pacific Glaucoma Surgery Industry Volume Share (%), by Surgery Method 2024 & 2032
- Figure 63: Asia Pacific Glaucoma Surgery Industry Revenue (Million), by End User 2024 & 2032
- Figure 64: Asia Pacific Glaucoma Surgery Industry Volume (K Unit), by End User 2024 & 2032
- Figure 65: Asia Pacific Glaucoma Surgery Industry Revenue Share (%), by End User 2024 & 2032
- Figure 66: Asia Pacific Glaucoma Surgery Industry Volume Share (%), by End User 2024 & 2032
- Figure 67: Asia Pacific Glaucoma Surgery Industry Revenue (Million), by Country 2024 & 2032
- Figure 68: Asia Pacific Glaucoma Surgery Industry Volume (K Unit), by Country 2024 & 2032
- Figure 69: Asia Pacific Glaucoma Surgery Industry Revenue Share (%), by Country 2024 & 2032
- Figure 70: Asia Pacific Glaucoma Surgery Industry Volume Share (%), by Country 2024 & 2032
- Figure 71: Middle East and Africa Glaucoma Surgery Industry Revenue (Million), by Product 2024 & 2032
- Figure 72: Middle East and Africa Glaucoma Surgery Industry Volume (K Unit), by Product 2024 & 2032
- Figure 73: Middle East and Africa Glaucoma Surgery Industry Revenue Share (%), by Product 2024 & 2032
- Figure 74: Middle East and Africa Glaucoma Surgery Industry Volume Share (%), by Product 2024 & 2032
- Figure 75: Middle East and Africa Glaucoma Surgery Industry Revenue (Million), by Surgery Method 2024 & 2032
- Figure 76: Middle East and Africa Glaucoma Surgery Industry Volume (K Unit), by Surgery Method 2024 & 2032
- Figure 77: Middle East and Africa Glaucoma Surgery Industry Revenue Share (%), by Surgery Method 2024 & 2032
- Figure 78: Middle East and Africa Glaucoma Surgery Industry Volume Share (%), by Surgery Method 2024 & 2032
- Figure 79: Middle East and Africa Glaucoma Surgery Industry Revenue (Million), by End User 2024 & 2032
- Figure 80: Middle East and Africa Glaucoma Surgery Industry Volume (K Unit), by End User 2024 & 2032
- Figure 81: Middle East and Africa Glaucoma Surgery Industry Revenue Share (%), by End User 2024 & 2032
- Figure 82: Middle East and Africa Glaucoma Surgery Industry Volume Share (%), by End User 2024 & 2032
- Figure 83: Middle East and Africa Glaucoma Surgery Industry Revenue (Million), by Country 2024 & 2032
- Figure 84: Middle East and Africa Glaucoma Surgery Industry Volume (K Unit), by Country 2024 & 2032
- Figure 85: Middle East and Africa Glaucoma Surgery Industry Revenue Share (%), by Country 2024 & 2032
- Figure 86: Middle East and Africa Glaucoma Surgery Industry Volume Share (%), by Country 2024 & 2032
- Figure 87: South America Glaucoma Surgery Industry Revenue (Million), by Product 2024 & 2032
- Figure 88: South America Glaucoma Surgery Industry Volume (K Unit), by Product 2024 & 2032
- Figure 89: South America Glaucoma Surgery Industry Revenue Share (%), by Product 2024 & 2032
- Figure 90: South America Glaucoma Surgery Industry Volume Share (%), by Product 2024 & 2032
- Figure 91: South America Glaucoma Surgery Industry Revenue (Million), by Surgery Method 2024 & 2032
- Figure 92: South America Glaucoma Surgery Industry Volume (K Unit), by Surgery Method 2024 & 2032
- Figure 93: South America Glaucoma Surgery Industry Revenue Share (%), by Surgery Method 2024 & 2032
- Figure 94: South America Glaucoma Surgery Industry Volume Share (%), by Surgery Method 2024 & 2032
- Figure 95: South America Glaucoma Surgery Industry Revenue (Million), by End User 2024 & 2032
- Figure 96: South America Glaucoma Surgery Industry Volume (K Unit), by End User 2024 & 2032
- Figure 97: South America Glaucoma Surgery Industry Revenue Share (%), by End User 2024 & 2032
- Figure 98: South America Glaucoma Surgery Industry Volume Share (%), by End User 2024 & 2032
- Figure 99: South America Glaucoma Surgery Industry Revenue (Million), by Country 2024 & 2032
- Figure 100: South America Glaucoma Surgery Industry Volume (K Unit), by Country 2024 & 2032
- Figure 101: South America Glaucoma Surgery Industry Revenue Share (%), by Country 2024 & 2032
- Figure 102: South America Glaucoma Surgery Industry Volume Share (%), by Country 2024 & 2032
List of Tables
- Table 1: Global Glaucoma Surgery Industry Revenue Million Forecast, by Region 2019 & 2032
- Table 2: Global Glaucoma Surgery Industry Volume K Unit Forecast, by Region 2019 & 2032
- Table 3: Global Glaucoma Surgery Industry Revenue Million Forecast, by Product 2019 & 2032
- Table 4: Global Glaucoma Surgery Industry Volume K Unit Forecast, by Product 2019 & 2032
- Table 5: Global Glaucoma Surgery Industry Revenue Million Forecast, by Surgery Method 2019 & 2032
- Table 6: Global Glaucoma Surgery Industry Volume K Unit Forecast, by Surgery Method 2019 & 2032
- Table 7: Global Glaucoma Surgery Industry Revenue Million Forecast, by End User 2019 & 2032
- Table 8: Global Glaucoma Surgery Industry Volume K Unit Forecast, by End User 2019 & 2032
- Table 9: Global Glaucoma Surgery Industry Revenue Million Forecast, by Region 2019 & 2032
- Table 10: Global Glaucoma Surgery Industry Volume K Unit Forecast, by Region 2019 & 2032
- Table 11: Global Glaucoma Surgery Industry Revenue Million Forecast, by Country 2019 & 2032
- Table 12: Global Glaucoma Surgery Industry Volume K Unit Forecast, by Country 2019 & 2032
- Table 13: Global Glaucoma Surgery Industry Revenue Million Forecast, by Country 2019 & 2032
- Table 14: Global Glaucoma Surgery Industry Volume K Unit Forecast, by Country 2019 & 2032
- Table 15: Global Glaucoma Surgery Industry Revenue Million Forecast, by Country 2019 & 2032
- Table 16: Global Glaucoma Surgery Industry Volume K Unit Forecast, by Country 2019 & 2032
- Table 17: Global Glaucoma Surgery Industry Revenue Million Forecast, by Country 2019 & 2032
- Table 18: Global Glaucoma Surgery Industry Volume K Unit Forecast, by Country 2019 & 2032
- Table 19: Global Glaucoma Surgery Industry Revenue Million Forecast, by Country 2019 & 2032
- Table 20: Global Glaucoma Surgery Industry Volume K Unit Forecast, by Country 2019 & 2032
- Table 21: Global Glaucoma Surgery Industry Revenue Million Forecast, by Product 2019 & 2032
- Table 22: Global Glaucoma Surgery Industry Volume K Unit Forecast, by Product 2019 & 2032
- Table 23: Global Glaucoma Surgery Industry Revenue Million Forecast, by Surgery Method 2019 & 2032
- Table 24: Global Glaucoma Surgery Industry Volume K Unit Forecast, by Surgery Method 2019 & 2032
- Table 25: Global Glaucoma Surgery Industry Revenue Million Forecast, by End User 2019 & 2032
- Table 26: Global Glaucoma Surgery Industry Volume K Unit Forecast, by End User 2019 & 2032
- Table 27: Global Glaucoma Surgery Industry Revenue Million Forecast, by Country 2019 & 2032
- Table 28: Global Glaucoma Surgery Industry Volume K Unit Forecast, by Country 2019 & 2032
- Table 29: United States Glaucoma Surgery Industry Revenue (Million) Forecast, by Application 2019 & 2032
- Table 30: United States Glaucoma Surgery Industry Volume (K Unit) Forecast, by Application 2019 & 2032
- Table 31: Canada Glaucoma Surgery Industry Revenue (Million) Forecast, by Application 2019 & 2032
- Table 32: Canada Glaucoma Surgery Industry Volume (K Unit) Forecast, by Application 2019 & 2032
- Table 33: Mexico Glaucoma Surgery Industry Revenue (Million) Forecast, by Application 2019 & 2032
- Table 34: Mexico Glaucoma Surgery Industry Volume (K Unit) Forecast, by Application 2019 & 2032
- Table 35: Global Glaucoma Surgery Industry Revenue Million Forecast, by Product 2019 & 2032
- Table 36: Global Glaucoma Surgery Industry Volume K Unit Forecast, by Product 2019 & 2032
- Table 37: Global Glaucoma Surgery Industry Revenue Million Forecast, by Surgery Method 2019 & 2032
- Table 38: Global Glaucoma Surgery Industry Volume K Unit Forecast, by Surgery Method 2019 & 2032
- Table 39: Global Glaucoma Surgery Industry Revenue Million Forecast, by End User 2019 & 2032
- Table 40: Global Glaucoma Surgery Industry Volume K Unit Forecast, by End User 2019 & 2032
- Table 41: Global Glaucoma Surgery Industry Revenue Million Forecast, by Country 2019 & 2032
- Table 42: Global Glaucoma Surgery Industry Volume K Unit Forecast, by Country 2019 & 2032
- Table 43: Germany Glaucoma Surgery Industry Revenue (Million) Forecast, by Application 2019 & 2032
- Table 44: Germany Glaucoma Surgery Industry Volume (K Unit) Forecast, by Application 2019 & 2032
- Table 45: United Kingdom Glaucoma Surgery Industry Revenue (Million) Forecast, by Application 2019 & 2032
- Table 46: United Kingdom Glaucoma Surgery Industry Volume (K Unit) Forecast, by Application 2019 & 2032
- Table 47: France Glaucoma Surgery Industry Revenue (Million) Forecast, by Application 2019 & 2032
- Table 48: France Glaucoma Surgery Industry Volume (K Unit) Forecast, by Application 2019 & 2032
- Table 49: Italy Glaucoma Surgery Industry Revenue (Million) Forecast, by Application 2019 & 2032
- Table 50: Italy Glaucoma Surgery Industry Volume (K Unit) Forecast, by Application 2019 & 2032
- Table 51: Spain Glaucoma Surgery Industry Revenue (Million) Forecast, by Application 2019 & 2032
- Table 52: Spain Glaucoma Surgery Industry Volume (K Unit) Forecast, by Application 2019 & 2032
- Table 53: Rest of Europe Glaucoma Surgery Industry Revenue (Million) Forecast, by Application 2019 & 2032
- Table 54: Rest of Europe Glaucoma Surgery Industry Volume (K Unit) Forecast, by Application 2019 & 2032
- Table 55: Global Glaucoma Surgery Industry Revenue Million Forecast, by Product 2019 & 2032
- Table 56: Global Glaucoma Surgery Industry Volume K Unit Forecast, by Product 2019 & 2032
- Table 57: Global Glaucoma Surgery Industry Revenue Million Forecast, by Surgery Method 2019 & 2032
- Table 58: Global Glaucoma Surgery Industry Volume K Unit Forecast, by Surgery Method 2019 & 2032
- Table 59: Global Glaucoma Surgery Industry Revenue Million Forecast, by End User 2019 & 2032
- Table 60: Global Glaucoma Surgery Industry Volume K Unit Forecast, by End User 2019 & 2032
- Table 61: Global Glaucoma Surgery Industry Revenue Million Forecast, by Country 2019 & 2032
- Table 62: Global Glaucoma Surgery Industry Volume K Unit Forecast, by Country 2019 & 2032
- Table 63: China Glaucoma Surgery Industry Revenue (Million) Forecast, by Application 2019 & 2032
- Table 64: China Glaucoma Surgery Industry Volume (K Unit) Forecast, by Application 2019 & 2032
- Table 65: Japan Glaucoma Surgery Industry Revenue (Million) Forecast, by Application 2019 & 2032
- Table 66: Japan Glaucoma Surgery Industry Volume (K Unit) Forecast, by Application 2019 & 2032
- Table 67: India Glaucoma Surgery Industry Revenue (Million) Forecast, by Application 2019 & 2032
- Table 68: India Glaucoma Surgery Industry Volume (K Unit) Forecast, by Application 2019 & 2032
- Table 69: Australia Glaucoma Surgery Industry Revenue (Million) Forecast, by Application 2019 & 2032
- Table 70: Australia Glaucoma Surgery Industry Volume (K Unit) Forecast, by Application 2019 & 2032
- Table 71: South Korea Glaucoma Surgery Industry Revenue (Million) Forecast, by Application 2019 & 2032
- Table 72: South Korea Glaucoma Surgery Industry Volume (K Unit) Forecast, by Application 2019 & 2032
- Table 73: Rest of Asia Pacific Glaucoma Surgery Industry Revenue (Million) Forecast, by Application 2019 & 2032
- Table 74: Rest of Asia Pacific Glaucoma Surgery Industry Volume (K Unit) Forecast, by Application 2019 & 2032
- Table 75: Global Glaucoma Surgery Industry Revenue Million Forecast, by Product 2019 & 2032
- Table 76: Global Glaucoma Surgery Industry Volume K Unit Forecast, by Product 2019 & 2032
- Table 77: Global Glaucoma Surgery Industry Revenue Million Forecast, by Surgery Method 2019 & 2032
- Table 78: Global Glaucoma Surgery Industry Volume K Unit Forecast, by Surgery Method 2019 & 2032
- Table 79: Global Glaucoma Surgery Industry Revenue Million Forecast, by End User 2019 & 2032
- Table 80: Global Glaucoma Surgery Industry Volume K Unit Forecast, by End User 2019 & 2032
- Table 81: Global Glaucoma Surgery Industry Revenue Million Forecast, by Country 2019 & 2032
- Table 82: Global Glaucoma Surgery Industry Volume K Unit Forecast, by Country 2019 & 2032
- Table 83: GCC Glaucoma Surgery Industry Revenue (Million) Forecast, by Application 2019 & 2032
- Table 84: GCC Glaucoma Surgery Industry Volume (K Unit) Forecast, by Application 2019 & 2032
- Table 85: South Africa Glaucoma Surgery Industry Revenue (Million) Forecast, by Application 2019 & 2032
- Table 86: South Africa Glaucoma Surgery Industry Volume (K Unit) Forecast, by Application 2019 & 2032
- Table 87: Rest of Middle East and Africa Glaucoma Surgery Industry Revenue (Million) Forecast, by Application 2019 & 2032
- Table 88: Rest of Middle East and Africa Glaucoma Surgery Industry Volume (K Unit) Forecast, by Application 2019 & 2032
- Table 89: Global Glaucoma Surgery Industry Revenue Million Forecast, by Product 2019 & 2032
- Table 90: Global Glaucoma Surgery Industry Volume K Unit Forecast, by Product 2019 & 2032
- Table 91: Global Glaucoma Surgery Industry Revenue Million Forecast, by Surgery Method 2019 & 2032
- Table 92: Global Glaucoma Surgery Industry Volume K Unit Forecast, by Surgery Method 2019 & 2032
- Table 93: Global Glaucoma Surgery Industry Revenue Million Forecast, by End User 2019 & 2032
- Table 94: Global Glaucoma Surgery Industry Volume K Unit Forecast, by End User 2019 & 2032
- Table 95: Global Glaucoma Surgery Industry Revenue Million Forecast, by Country 2019 & 2032
- Table 96: Global Glaucoma Surgery Industry Volume K Unit Forecast, by Country 2019 & 2032
- Table 97: Brazil Glaucoma Surgery Industry Revenue (Million) Forecast, by Application 2019 & 2032
- Table 98: Brazil Glaucoma Surgery Industry Volume (K Unit) Forecast, by Application 2019 & 2032
- Table 99: Argentina Glaucoma Surgery Industry Revenue (Million) Forecast, by Application 2019 & 2032
- Table 100: Argentina Glaucoma Surgery Industry Volume (K Unit) Forecast, by Application 2019 & 2032
- Table 101: Rest of South America Glaucoma Surgery Industry Revenue (Million) Forecast, by Application 2019 & 2032
- Table 102: Rest of South America Glaucoma Surgery Industry Volume (K Unit) Forecast, by Application 2019 & 2032
Frequently Asked Questions
1. What is the projected Compound Annual Growth Rate (CAGR) of the Glaucoma Surgery Industry?
The projected CAGR is approximately 6.50%.
2. Which companies are prominent players in the Glaucoma Surgery Industry?
Key companies in the market include Ziemer Ophthalmic Systems, Katalyst Surgical LLC, Altomed, Glaukos Corporation, Nova Eye Medical, Lumenis, ASICO LLC, Johnson and Johnson, Allergan, Abbott Laboratories Inc, Alcon, Carl Zeiss Meditec.
3. What are the main segments of the Glaucoma Surgery Industry?
The market segments include Product, Surgery Method, End User.
4. Can you provide details about the market size?
The market size is estimated to be USD XX Million as of 2022.
5. What are some drivers contributing to market growth?
Rising Prevalence of Glaucoma; Increasing Geriatric Population; Growing Adoption of Surgical Treatments for Glaucoma.
6. What are the notable trends driving market growth?
Minimal Invasive Glaucoma Surgery is Expected to Witness Growth Over The Forecast Period.
7. Are there any restraints impacting market growth?
Availability of Alternative Treatment Methods.
8. Can you provide examples of recent developments in the market?
June 2022: AbbVie announced it would pay USD 60 million for the rights to acquire iSTAR Medical, a Belgian company developing a minimally invasive glaucoma implantable surgery device. In order to market the device in the United States, iSTAR is now enrolling in a premarket approval study. AbbVie is assisting in developing and commercializing the MINIject device until this study is completed.
9. What pricing options are available for accessing the report?
Pricing options include single-user, multi-user, and enterprise licenses priced at USD 4750, USD 5250, and USD 8750 respectively.
10. Is the market size provided in terms of value or volume?
The market size is provided in terms of value, measured in Million and volume, measured in K Unit.
11. Are there any specific market keywords associated with the report?
Yes, the market keyword associated with the report is "Glaucoma Surgery Industry," which aids in identifying and referencing the specific market segment covered.
12. How do I determine which pricing option suits my needs best?
The pricing options vary based on user requirements and access needs. Individual users may opt for single-user licenses, while businesses requiring broader access may choose multi-user or enterprise licenses for cost-effective access to the report.
13. Are there any additional resources or data provided in the Glaucoma Surgery Industry report?
While the report offers comprehensive insights, it's advisable to review the specific contents or supplementary materials provided to ascertain if additional resources or data are available.
14. How can I stay updated on further developments or reports in the Glaucoma Surgery Industry?
To stay informed about further developments, trends, and reports in the Glaucoma Surgery Industry, consider subscribing to industry newsletters, following relevant companies and organizations, or regularly checking reputable industry news sources and publications.
Methodology
Step 1 - Identification of Relevant Samples Size from Population Database


Step 2 - Approaches for Defining Global Market Size (Value, Volume* & Price*)

Note*: In applicable scenarios
Step 3 - Data Sources
Primary Research
- Web Analytics
- Survey Reports
- Research Institute
- Latest Research Reports
- Opinion Leaders
Secondary Research
- Annual Reports
- White Paper
- Latest Press Release
- Industry Association
- Paid Database
- Investor Presentations

Step 4 - Data Triangulation
Involves using different sources of information in order to increase the validity of a study
These sources are likely to be stakeholders in a program - participants, other researchers, program staff, other community members, and so on.
Then we put all data in single framework & apply various statistical tools to find out the dynamic on the market.
During the analysis stage, feedback from the stakeholder groups would be compared to determine areas of agreement as well as areas of divergence
