

Key Insights
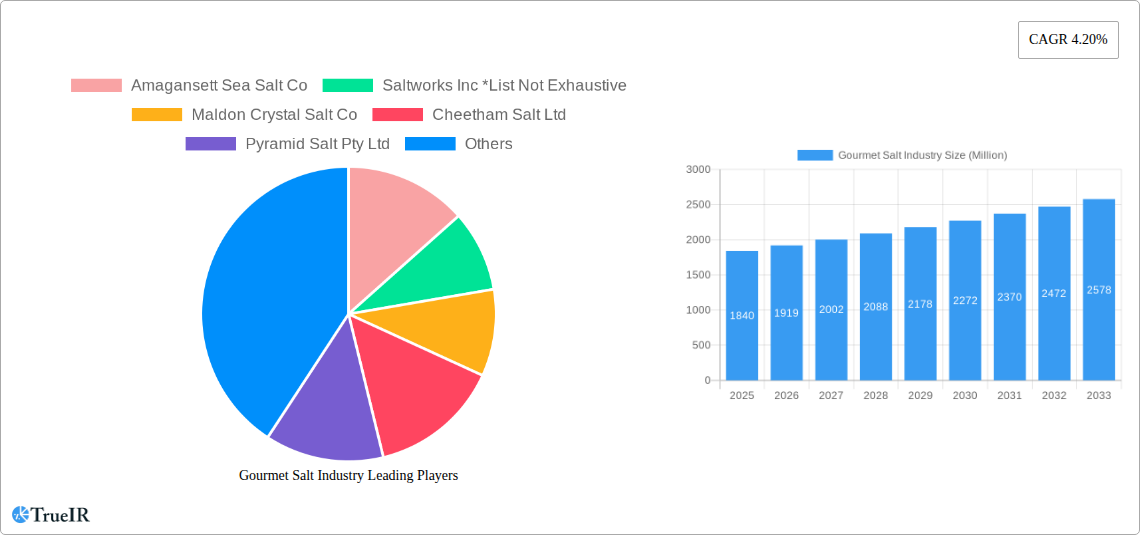
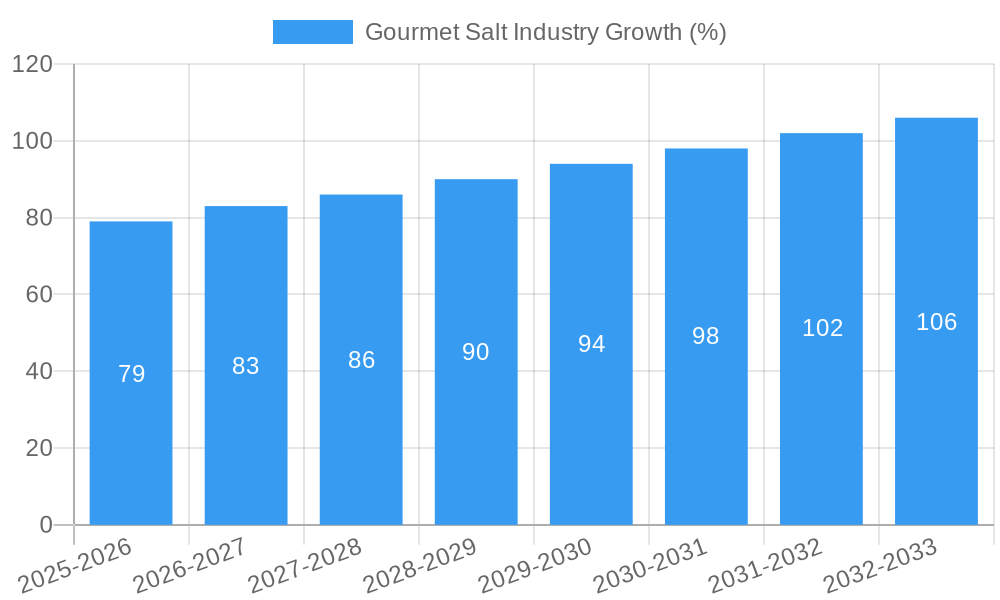
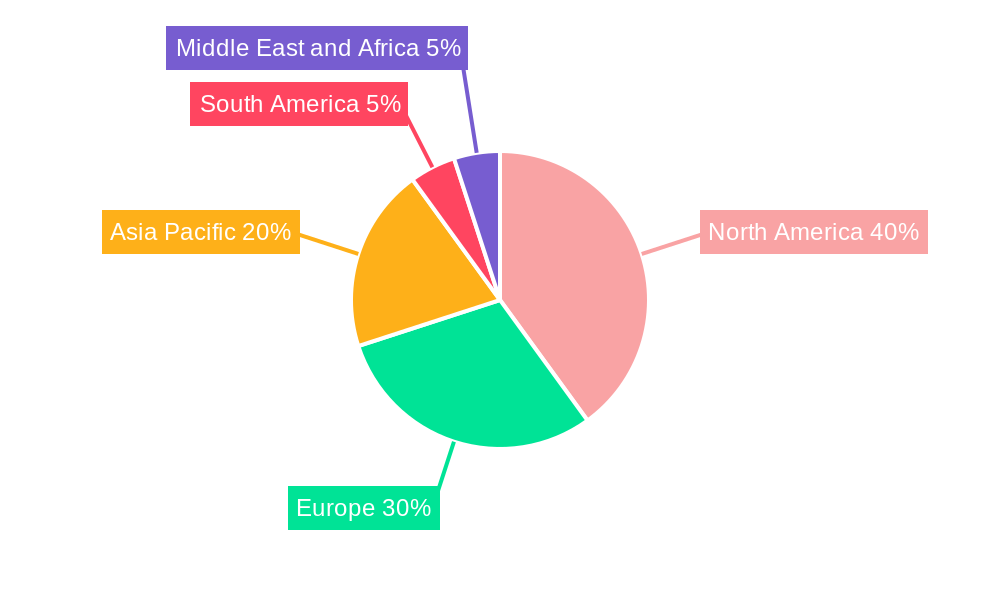
The gourmet salt market, valued at $1.84 billion in 2025, is projected to experience steady growth, driven by increasing consumer demand for premium and specialty food products. The rising popularity of gourmet cooking, along with health and wellness trends emphasizing mineral-rich diets, fuels this market expansion. Consumers are increasingly seeking out unique flavors and textures, leading to higher demand for specialty salts like Himalayan pink salt, fleur de sel, and sel gris, which offer distinct taste profiles and visual appeal compared to standard table salt. The market is segmented by type (Sel Gris, Flakey Salt, Himalayan Salt, Fleur de sel, Specialty Salt, Other Types) and application (Confectionary, Bakery, Meat and Poultry, Seafood, Sauces and Savories, Other Applications), reflecting the diverse usage of gourmet salt in various culinary sectors. The North American market, particularly the United States, currently holds a significant share, driven by strong consumer spending and established gourmet food culture. However, Asia-Pacific is anticipated to exhibit robust growth due to rising disposable incomes and changing culinary preferences. Competition within the market is dynamic, with established players like Cargill and Morton Salt alongside smaller, artisanal brands focusing on unique sourcing and production methods. This blend of large-scale producers and niche brands caters to diverse consumer segments and market needs. The consistent 4.20% CAGR indicates a stable and predictable market trajectory for the foreseeable future.
The continued growth hinges on factors like product innovation, premium pricing strategies, and effective marketing that highlight the culinary and health benefits of gourmet salts. Expanding distribution channels through specialty food stores, online platforms, and partnerships with restaurants will further contribute to market expansion. However, challenges exist in maintaining consistent supply chains, given that some specialty salts depend on specific geographic sources and environmental conditions. Furthermore, pricing pressures and the potential for substitution with less expensive alternatives require careful management. Overall, the gourmet salt market shows promising growth potential, driven by evolving consumer preferences, culinary trends, and the consistent appeal of high-quality, flavorful ingredients. Maintaining a balance between premium pricing and accessible market reach will be crucial for sustained success within this sector.
Gourmet Salt Industry Market Report: 2019-2033
This comprehensive report provides a detailed analysis of the global gourmet salt market, projecting a robust growth trajectory driven by evolving consumer preferences and innovative product offerings. With a focus on the period 2019-2033, this report offers invaluable insights for industry stakeholders, investors, and businesses seeking to navigate this expanding market segment. The market is expected to reach xx Million by 2033.
Gourmet Salt Industry Market Structure & Competitive Landscape
The gourmet salt market exhibits a moderately concentrated structure, with a few major players alongside numerous smaller, niche producers. Concentration ratios are estimated at xx% for the top 5 players in 2025. Innovation is a key driver, with companies constantly introducing new flavors, textures, and sourcing methods (e.g., Himalayan pink salt, sea salts from specific regions). Regulatory changes, primarily concerning food safety and labeling, exert significant influence, leading to stricter quality control measures. Product substitutes, such as other seasonings and flavor enhancers, present a moderate competitive pressure. End-user segmentation across various food and beverage categories (confectionery, bakery, etc.) further shapes market dynamics. M&A activity within the gourmet salt industry has been relatively low in recent years, with an estimated xx number of deals during 2019-2024. This points to organic growth as the primary expansion strategy for many companies. Future acquisitions are predicted to center around companies specializing in unique salt varieties or those with strong regional market presence.
Gourmet Salt Industry Market Trends & Opportunities
The gourmet salt market exhibits strong growth potential, projected to reach xx Million by 2033, with a CAGR of xx% during the forecast period (2025-2033). This growth is fueled by several factors: increasing consumer awareness of food quality and origin, a rise in health-conscious consumers seeking natural alternatives, and the ongoing culinary exploration of diverse salt varieties. Technological advancements are enhancing production efficiency, including automation in harvesting and processing, which improves consistency and reduces costs. Consumer preferences are shifting towards premium, specialty salts, leading to increased demand for products with unique flavor profiles and geographic origins. This growth is supported by an increase in market penetration across various applications and regions, particularly in developed markets with established food cultures. Competitive dynamics are marked by product differentiation, branding, and effective distribution strategies. The gourmet market shows increased penetration in online sales channels, with major players adopting sophisticated e-commerce solutions to streamline B2B sales.
Dominant Markets & Segments in Gourmet Salt Industry
Based on our analysis, the North American and European markets currently dominate the gourmet salt industry. Within these regions, strong demand comes from food service and consumer segments. The Asia-Pacific region is also exhibiting significant growth, fueled by rising disposable incomes and increased adoption of Western culinary trends.
By Type: Himalayan pink salt and Fleur de sel commands the highest premium price points and are experiencing substantial growth.
- Key Growth Drivers for Himalayan Salt: Increasing consumer demand for natural and healthy food products.
- Key Growth Drivers for Fleur de sel: High perceived value and use in high-end culinary applications.
By Application: The confectionery and bakery segments are major users of gourmet salt, driven by their contribution to taste and texture enhancement. The meat and poultry industry is also significant, with salt playing a crucial role in preserving and flavoring.
- Key Growth Drivers for Confectionary: Growing demand for artisanal sweets and high-end confectioneries.
- Key Growth Drivers for Bakery: Rising popularity of artisan breads and gourmet pastries.
Gourmet Salt Industry Product Analysis
The gourmet salt market showcases a diverse range of products, from traditional sea salts and rock salts to specialty salts infused with herbs, spices, and other flavor enhancers. Technological advancements have led to innovations like ultra-fine salt powders, suitable for various applications (Cargill's purified sea salt flour). The key competitive advantage lies in sourcing, quality control, unique flavor profiles, and packaging that highlights the product's origin and premium nature.
Key Drivers, Barriers & Challenges in Gourmet Salt Industry
Key Drivers: Rising consumer demand for premium and specialty food items, increasing health consciousness leading to interest in natural alternatives to processed foods, and technological advancements improving salt production efficiency are main drivers.
Challenges: Supply chain disruptions (e.g., weather events impacting harvesting), regulatory changes concerning food safety and labeling, and intense competition amongst producers for shelf space and market share are significant obstacles. Changes in consumer preferences and rising raw material costs further create challenges for price stability and profitability.
Growth Drivers in the Gourmet Salt Industry Market
The gourmet salt market is experiencing growth fueled by increasing demand for natural and high-quality food ingredients. Technological advancements, specifically in efficient harvesting and processing, are enhancing production capabilities and broadening the range of gourmet salt products available. Consumer preferences for specialty and artisanal food items, combined with rising disposable incomes in emerging economies, significantly contribute to market expansion. Furthermore, the burgeoning food service industry, including upscale restaurants and gourmet food stores, creates a larger demand for specialty salts.
Challenges Impacting Gourmet Salt Industry Growth
Significant challenges facing the gourmet salt industry include fluctuating raw material costs, environmental concerns related to salt production's impact on ecosystems, and the increasing complexity of global supply chains. Regulatory hurdles associated with food safety and labeling requirements impose additional costs and complexities for manufacturers. Competitive pressures are intensified by the increasing number of both large and small specialty salt producers entering the market. These challenges necessitate strategic adaptations in procurement, logistics, and product diversification to maintain profitability and market competitiveness.
Key Players Shaping the Gourmet Salt Industry Market
- Amagansett Sea Salt Co
- Saltworks Inc
- Maldon Crystal Salt Co
- Cheetham Salt Ltd
- Pyramid Salt Pty Ltd
- Alaska Pure Sea Salt Co
- Murray River Salt
- Cargill Inc
- Morton Salt Inc
- Kalahari Pristine Salt Worx
Significant Gourmet Salt Industry Industry Milestones
- September 2019: Morton Salt launched All-Natural Himalayan Pink Salt, expanding its product line and tapping into the growing demand for specialty salts.
- April 2020: SaltWorks implemented advanced B2B eCommerce tools, enhancing its customer experience and boosting sales growth through improved online infrastructure.
- January 2021: Cargill Salt introduced purified sea salt flour, a novel ingredient ideal for various food applications requiring ultra-fine salt particles. This innovation broadened the application of sea salt and positions Cargill as a leader in salt innovation.
Future Outlook for Gourmet Salt Industry Market
The gourmet salt market is poised for sustained growth, driven by evolving consumer preferences towards healthier, natural food options. Strategic opportunities lie in expanding into emerging markets, developing innovative product formulations (e.g., infused salts, flavored salts), and leveraging e-commerce to reach wider customer bases. The market's potential is significant, with continued growth projected across various segments and regions. The focus on product differentiation, sustainability initiatives, and targeted marketing campaigns will be key factors in determining the future success of market players.
Gourmet Salt Industry Segmentation
-
1. Type
- 1.1. Sel Gris
- 1.2. Flakey Salt
- 1.3. Himalayan Salt
- 1.4. Fleur de sel
- 1.5. Specialty Salt
- 1.6. Other Types
-
2. Application
- 2.1. Confectionary
- 2.2. Bakery
- 2.3. Meat and Poultry
- 2.4. Sea Food
- 2.5. Sauces and Savories
- 2.6. Other Applications
Gourmet Salt Industry Segmentation By Geography
-
1. North America
- 1.1. United States
- 1.2. Canada
- 1.3. Mexico
- 1.4. Rest of North America
-
2. Europe
- 2.1. United Kingdom
- 2.2. Germany
- 2.3. France
- 2.4. Russia
- 2.5. Italy
- 2.6. Spain
- 2.7. Rest of Europe
-
3. Asia Pacific
- 3.1. India
- 3.2. China
- 3.3. Japan
- 3.4. Australia
- 3.5. Rest of Asia Pacific
-
4. South America
- 4.1. Brazil
- 4.2. Argentina
- 4.3. Rest of South America
-
5. Middle East and Africa
- 5.1. South Africa
- 5.2. United Arab Emirates
- 5.3. Rest of Middle East and Africa
Gourmet Salt Industry REPORT HIGHLIGHTS
| Aspects | Details |
|---|---|
| Study Period | 2019-2033 |
| Base Year | 2024 |
| Estimated Year | 2025 |
| Forecast Period | 2025-2033 |
| Historical Period | 2019-2024 |
| Growth Rate | CAGR of 4.20% from 2019-2033 |
| Segmentation |
|
Table of Contents
- 1. Introduction
- 1.1. Research Scope
- 1.2. Market Segmentation
- 1.3. Research Methodology
- 1.4. Definitions and Assumptions
- 2. Executive Summary
- 2.1. Introduction
- 3. Market Dynamics
- 3.1. Introduction
- 3.2. Market Drivers
- 3.2.1. Escalating Demand for Processed Poultry Products; Favorable Government Initiatives to Boost Production
- 3.3. Market Restrains
- 3.3.1. Rising Vegan Trend among Young Consumers; Deeper Penetration of Red Meat Across Saudi Arabia
- 3.4. Market Trends
- 3.4.1. Growing Demand from the Food Service Industry
- 4. Market Factor Analysis
- 4.1. Porters Five Forces
- 4.2. Supply/Value Chain
- 4.3. PESTEL analysis
- 4.4. Market Entropy
- 4.5. Patent/Trademark Analysis
- 5. Global Gourmet Salt Industry Analysis, Insights and Forecast, 2019-2031
- 5.1. Market Analysis, Insights and Forecast - by Type
- 5.1.1. Sel Gris
- 5.1.2. Flakey Salt
- 5.1.3. Himalayan Salt
- 5.1.4. Fleur de sel
- 5.1.5. Specialty Salt
- 5.1.6. Other Types
- 5.2. Market Analysis, Insights and Forecast - by Application
- 5.2.1. Confectionary
- 5.2.2. Bakery
- 5.2.3. Meat and Poultry
- 5.2.4. Sea Food
- 5.2.5. Sauces and Savories
- 5.2.6. Other Applications
- 5.3. Market Analysis, Insights and Forecast - by Region
- 5.3.1. North America
- 5.3.2. Europe
- 5.3.3. Asia Pacific
- 5.3.4. South America
- 5.3.5. Middle East and Africa
- 5.1. Market Analysis, Insights and Forecast - by Type
- 6. North America Gourmet Salt Industry Analysis, Insights and Forecast, 2019-2031
- 6.1. Market Analysis, Insights and Forecast - by Type
- 6.1.1. Sel Gris
- 6.1.2. Flakey Salt
- 6.1.3. Himalayan Salt
- 6.1.4. Fleur de sel
- 6.1.5. Specialty Salt
- 6.1.6. Other Types
- 6.2. Market Analysis, Insights and Forecast - by Application
- 6.2.1. Confectionary
- 6.2.2. Bakery
- 6.2.3. Meat and Poultry
- 6.2.4. Sea Food
- 6.2.5. Sauces and Savories
- 6.2.6. Other Applications
- 6.1. Market Analysis, Insights and Forecast - by Type
- 7. Europe Gourmet Salt Industry Analysis, Insights and Forecast, 2019-2031
- 7.1. Market Analysis, Insights and Forecast - by Type
- 7.1.1. Sel Gris
- 7.1.2. Flakey Salt
- 7.1.3. Himalayan Salt
- 7.1.4. Fleur de sel
- 7.1.5. Specialty Salt
- 7.1.6. Other Types
- 7.2. Market Analysis, Insights and Forecast - by Application
- 7.2.1. Confectionary
- 7.2.2. Bakery
- 7.2.3. Meat and Poultry
- 7.2.4. Sea Food
- 7.2.5. Sauces and Savories
- 7.2.6. Other Applications
- 7.1. Market Analysis, Insights and Forecast - by Type
- 8. Asia Pacific Gourmet Salt Industry Analysis, Insights and Forecast, 2019-2031
- 8.1. Market Analysis, Insights and Forecast - by Type
- 8.1.1. Sel Gris
- 8.1.2. Flakey Salt
- 8.1.3. Himalayan Salt
- 8.1.4. Fleur de sel
- 8.1.5. Specialty Salt
- 8.1.6. Other Types
- 8.2. Market Analysis, Insights and Forecast - by Application
- 8.2.1. Confectionary
- 8.2.2. Bakery
- 8.2.3. Meat and Poultry
- 8.2.4. Sea Food
- 8.2.5. Sauces and Savories
- 8.2.6. Other Applications
- 8.1. Market Analysis, Insights and Forecast - by Type
- 9. South America Gourmet Salt Industry Analysis, Insights and Forecast, 2019-2031
- 9.1. Market Analysis, Insights and Forecast - by Type
- 9.1.1. Sel Gris
- 9.1.2. Flakey Salt
- 9.1.3. Himalayan Salt
- 9.1.4. Fleur de sel
- 9.1.5. Specialty Salt
- 9.1.6. Other Types
- 9.2. Market Analysis, Insights and Forecast - by Application
- 9.2.1. Confectionary
- 9.2.2. Bakery
- 9.2.3. Meat and Poultry
- 9.2.4. Sea Food
- 9.2.5. Sauces and Savories
- 9.2.6. Other Applications
- 9.1. Market Analysis, Insights and Forecast - by Type
- 10. Middle East and Africa Gourmet Salt Industry Analysis, Insights and Forecast, 2019-2031
- 10.1. Market Analysis, Insights and Forecast - by Type
- 10.1.1. Sel Gris
- 10.1.2. Flakey Salt
- 10.1.3. Himalayan Salt
- 10.1.4. Fleur de sel
- 10.1.5. Specialty Salt
- 10.1.6. Other Types
- 10.2. Market Analysis, Insights and Forecast - by Application
- 10.2.1. Confectionary
- 10.2.2. Bakery
- 10.2.3. Meat and Poultry
- 10.2.4. Sea Food
- 10.2.5. Sauces and Savories
- 10.2.6. Other Applications
- 10.1. Market Analysis, Insights and Forecast - by Type
- 11. North America Gourmet Salt Industry Analysis, Insights and Forecast, 2019-2031
- 11.1. Market Analysis, Insights and Forecast - By Country/Sub-region
- 11.1.1 United States
- 11.1.2 Canada
- 11.1.3 Mexico
- 11.1.4 Rest of North America
- 12. Europe Gourmet Salt Industry Analysis, Insights and Forecast, 2019-2031
- 12.1. Market Analysis, Insights and Forecast - By Country/Sub-region
- 12.1.1 United Kingdom
- 12.1.2 Germany
- 12.1.3 France
- 12.1.4 Russia
- 12.1.5 Italy
- 12.1.6 Spain
- 12.1.7 Rest of Europe
- 13. Asia Pacific Gourmet Salt Industry Analysis, Insights and Forecast, 2019-2031
- 13.1. Market Analysis, Insights and Forecast - By Country/Sub-region
- 13.1.1 India
- 13.1.2 China
- 13.1.3 Japan
- 13.1.4 Australia
- 13.1.5 Rest of Asia Pacific
- 14. South America Gourmet Salt Industry Analysis, Insights and Forecast, 2019-2031
- 14.1. Market Analysis, Insights and Forecast - By Country/Sub-region
- 14.1.1 Brazil
- 14.1.2 Argentina
- 14.1.3 Rest of South America
- 15. Middle East and Africa Gourmet Salt Industry Analysis, Insights and Forecast, 2019-2031
- 15.1. Market Analysis, Insights and Forecast - By Country/Sub-region
- 15.1.1 South Africa
- 15.1.2 United Arab Emirates
- 15.1.3 Rest of Middle East and Africa
- 16. Competitive Analysis
- 16.1. Global Market Share Analysis 2024
- 16.2. Company Profiles
- 16.2.1 Amagansett Sea Salt Co
- 16.2.1.1. Overview
- 16.2.1.2. Products
- 16.2.1.3. SWOT Analysis
- 16.2.1.4. Recent Developments
- 16.2.1.5. Financials (Based on Availability)
- 16.2.2 Saltworks Inc *List Not Exhaustive
- 16.2.2.1. Overview
- 16.2.2.2. Products
- 16.2.2.3. SWOT Analysis
- 16.2.2.4. Recent Developments
- 16.2.2.5. Financials (Based on Availability)
- 16.2.3 Maldon Crystal Salt Co
- 16.2.3.1. Overview
- 16.2.3.2. Products
- 16.2.3.3. SWOT Analysis
- 16.2.3.4. Recent Developments
- 16.2.3.5. Financials (Based on Availability)
- 16.2.4 Cheetham Salt Ltd
- 16.2.4.1. Overview
- 16.2.4.2. Products
- 16.2.4.3. SWOT Analysis
- 16.2.4.4. Recent Developments
- 16.2.4.5. Financials (Based on Availability)
- 16.2.5 Pyramid Salt Pty Ltd
- 16.2.5.1. Overview
- 16.2.5.2. Products
- 16.2.5.3. SWOT Analysis
- 16.2.5.4. Recent Developments
- 16.2.5.5. Financials (Based on Availability)
- 16.2.6 Alaska Pure Sea Salt Co
- 16.2.6.1. Overview
- 16.2.6.2. Products
- 16.2.6.3. SWOT Analysis
- 16.2.6.4. Recent Developments
- 16.2.6.5. Financials (Based on Availability)
- 16.2.7 Murray River Salt
- 16.2.7.1. Overview
- 16.2.7.2. Products
- 16.2.7.3. SWOT Analysis
- 16.2.7.4. Recent Developments
- 16.2.7.5. Financials (Based on Availability)
- 16.2.8 Cargill Inc
- 16.2.8.1. Overview
- 16.2.8.2. Products
- 16.2.8.3. SWOT Analysis
- 16.2.8.4. Recent Developments
- 16.2.8.5. Financials (Based on Availability)
- 16.2.9 Morton Salt Inc
- 16.2.9.1. Overview
- 16.2.9.2. Products
- 16.2.9.3. SWOT Analysis
- 16.2.9.4. Recent Developments
- 16.2.9.5. Financials (Based on Availability)
- 16.2.10 Kalahari Pristine Salt Worx
- 16.2.10.1. Overview
- 16.2.10.2. Products
- 16.2.10.3. SWOT Analysis
- 16.2.10.4. Recent Developments
- 16.2.10.5. Financials (Based on Availability)
- 16.2.1 Amagansett Sea Salt Co
List of Figures
- Figure 1: Global Gourmet Salt Industry Revenue Breakdown (Million, %) by Region 2024 & 2032
- Figure 2: North America Gourmet Salt Industry Revenue (Million), by Country 2024 & 2032
- Figure 3: North America Gourmet Salt Industry Revenue Share (%), by Country 2024 & 2032
- Figure 4: Europe Gourmet Salt Industry Revenue (Million), by Country 2024 & 2032
- Figure 5: Europe Gourmet Salt Industry Revenue Share (%), by Country 2024 & 2032
- Figure 6: Asia Pacific Gourmet Salt Industry Revenue (Million), by Country 2024 & 2032
- Figure 7: Asia Pacific Gourmet Salt Industry Revenue Share (%), by Country 2024 & 2032
- Figure 8: South America Gourmet Salt Industry Revenue (Million), by Country 2024 & 2032
- Figure 9: South America Gourmet Salt Industry Revenue Share (%), by Country 2024 & 2032
- Figure 10: Middle East and Africa Gourmet Salt Industry Revenue (Million), by Country 2024 & 2032
- Figure 11: Middle East and Africa Gourmet Salt Industry Revenue Share (%), by Country 2024 & 2032
- Figure 12: North America Gourmet Salt Industry Revenue (Million), by Type 2024 & 2032
- Figure 13: North America Gourmet Salt Industry Revenue Share (%), by Type 2024 & 2032
- Figure 14: North America Gourmet Salt Industry Revenue (Million), by Application 2024 & 2032
- Figure 15: North America Gourmet Salt Industry Revenue Share (%), by Application 2024 & 2032
- Figure 16: North America Gourmet Salt Industry Revenue (Million), by Country 2024 & 2032
- Figure 17: North America Gourmet Salt Industry Revenue Share (%), by Country 2024 & 2032
- Figure 18: Europe Gourmet Salt Industry Revenue (Million), by Type 2024 & 2032
- Figure 19: Europe Gourmet Salt Industry Revenue Share (%), by Type 2024 & 2032
- Figure 20: Europe Gourmet Salt Industry Revenue (Million), by Application 2024 & 2032
- Figure 21: Europe Gourmet Salt Industry Revenue Share (%), by Application 2024 & 2032
- Figure 22: Europe Gourmet Salt Industry Revenue (Million), by Country 2024 & 2032
- Figure 23: Europe Gourmet Salt Industry Revenue Share (%), by Country 2024 & 2032
- Figure 24: Asia Pacific Gourmet Salt Industry Revenue (Million), by Type 2024 & 2032
- Figure 25: Asia Pacific Gourmet Salt Industry Revenue Share (%), by Type 2024 & 2032
- Figure 26: Asia Pacific Gourmet Salt Industry Revenue (Million), by Application 2024 & 2032
- Figure 27: Asia Pacific Gourmet Salt Industry Revenue Share (%), by Application 2024 & 2032
- Figure 28: Asia Pacific Gourmet Salt Industry Revenue (Million), by Country 2024 & 2032
- Figure 29: Asia Pacific Gourmet Salt Industry Revenue Share (%), by Country 2024 & 2032
- Figure 30: South America Gourmet Salt Industry Revenue (Million), by Type 2024 & 2032
- Figure 31: South America Gourmet Salt Industry Revenue Share (%), by Type 2024 & 2032
- Figure 32: South America Gourmet Salt Industry Revenue (Million), by Application 2024 & 2032
- Figure 33: South America Gourmet Salt Industry Revenue Share (%), by Application 2024 & 2032
- Figure 34: South America Gourmet Salt Industry Revenue (Million), by Country 2024 & 2032
- Figure 35: South America Gourmet Salt Industry Revenue Share (%), by Country 2024 & 2032
- Figure 36: Middle East and Africa Gourmet Salt Industry Revenue (Million), by Type 2024 & 2032
- Figure 37: Middle East and Africa Gourmet Salt Industry Revenue Share (%), by Type 2024 & 2032
- Figure 38: Middle East and Africa Gourmet Salt Industry Revenue (Million), by Application 2024 & 2032
- Figure 39: Middle East and Africa Gourmet Salt Industry Revenue Share (%), by Application 2024 & 2032
- Figure 40: Middle East and Africa Gourmet Salt Industry Revenue (Million), by Country 2024 & 2032
- Figure 41: Middle East and Africa Gourmet Salt Industry Revenue Share (%), by Country 2024 & 2032
List of Tables
- Table 1: Global Gourmet Salt Industry Revenue Million Forecast, by Region 2019 & 2032
- Table 2: Global Gourmet Salt Industry Revenue Million Forecast, by Type 2019 & 2032
- Table 3: Global Gourmet Salt Industry Revenue Million Forecast, by Application 2019 & 2032
- Table 4: Global Gourmet Salt Industry Revenue Million Forecast, by Region 2019 & 2032
- Table 5: Global Gourmet Salt Industry Revenue Million Forecast, by Country 2019 & 2032
- Table 6: United States Gourmet Salt Industry Revenue (Million) Forecast, by Application 2019 & 2032
- Table 7: Canada Gourmet Salt Industry Revenue (Million) Forecast, by Application 2019 & 2032
- Table 8: Mexico Gourmet Salt Industry Revenue (Million) Forecast, by Application 2019 & 2032
- Table 9: Rest of North America Gourmet Salt Industry Revenue (Million) Forecast, by Application 2019 & 2032
- Table 10: Global Gourmet Salt Industry Revenue Million Forecast, by Country 2019 & 2032
- Table 11: United Kingdom Gourmet Salt Industry Revenue (Million) Forecast, by Application 2019 & 2032
- Table 12: Germany Gourmet Salt Industry Revenue (Million) Forecast, by Application 2019 & 2032
- Table 13: France Gourmet Salt Industry Revenue (Million) Forecast, by Application 2019 & 2032
- Table 14: Russia Gourmet Salt Industry Revenue (Million) Forecast, by Application 2019 & 2032
- Table 15: Italy Gourmet Salt Industry Revenue (Million) Forecast, by Application 2019 & 2032
- Table 16: Spain Gourmet Salt Industry Revenue (Million) Forecast, by Application 2019 & 2032
- Table 17: Rest of Europe Gourmet Salt Industry Revenue (Million) Forecast, by Application 2019 & 2032
- Table 18: Global Gourmet Salt Industry Revenue Million Forecast, by Country 2019 & 2032
- Table 19: India Gourmet Salt Industry Revenue (Million) Forecast, by Application 2019 & 2032
- Table 20: China Gourmet Salt Industry Revenue (Million) Forecast, by Application 2019 & 2032
- Table 21: Japan Gourmet Salt Industry Revenue (Million) Forecast, by Application 2019 & 2032
- Table 22: Australia Gourmet Salt Industry Revenue (Million) Forecast, by Application 2019 & 2032
- Table 23: Rest of Asia Pacific Gourmet Salt Industry Revenue (Million) Forecast, by Application 2019 & 2032
- Table 24: Global Gourmet Salt Industry Revenue Million Forecast, by Country 2019 & 2032
- Table 25: Brazil Gourmet Salt Industry Revenue (Million) Forecast, by Application 2019 & 2032
- Table 26: Argentina Gourmet Salt Industry Revenue (Million) Forecast, by Application 2019 & 2032
- Table 27: Rest of South America Gourmet Salt Industry Revenue (Million) Forecast, by Application 2019 & 2032
- Table 28: Global Gourmet Salt Industry Revenue Million Forecast, by Country 2019 & 2032
- Table 29: South Africa Gourmet Salt Industry Revenue (Million) Forecast, by Application 2019 & 2032
- Table 30: United Arab Emirates Gourmet Salt Industry Revenue (Million) Forecast, by Application 2019 & 2032
- Table 31: Rest of Middle East and Africa Gourmet Salt Industry Revenue (Million) Forecast, by Application 2019 & 2032
- Table 32: Global Gourmet Salt Industry Revenue Million Forecast, by Type 2019 & 2032
- Table 33: Global Gourmet Salt Industry Revenue Million Forecast, by Application 2019 & 2032
- Table 34: Global Gourmet Salt Industry Revenue Million Forecast, by Country 2019 & 2032
- Table 35: United States Gourmet Salt Industry Revenue (Million) Forecast, by Application 2019 & 2032
- Table 36: Canada Gourmet Salt Industry Revenue (Million) Forecast, by Application 2019 & 2032
- Table 37: Mexico Gourmet Salt Industry Revenue (Million) Forecast, by Application 2019 & 2032
- Table 38: Rest of North America Gourmet Salt Industry Revenue (Million) Forecast, by Application 2019 & 2032
- Table 39: Global Gourmet Salt Industry Revenue Million Forecast, by Type 2019 & 2032
- Table 40: Global Gourmet Salt Industry Revenue Million Forecast, by Application 2019 & 2032
- Table 41: Global Gourmet Salt Industry Revenue Million Forecast, by Country 2019 & 2032
- Table 42: United Kingdom Gourmet Salt Industry Revenue (Million) Forecast, by Application 2019 & 2032
- Table 43: Germany Gourmet Salt Industry Revenue (Million) Forecast, by Application 2019 & 2032
- Table 44: France Gourmet Salt Industry Revenue (Million) Forecast, by Application 2019 & 2032
- Table 45: Russia Gourmet Salt Industry Revenue (Million) Forecast, by Application 2019 & 2032
- Table 46: Italy Gourmet Salt Industry Revenue (Million) Forecast, by Application 2019 & 2032
- Table 47: Spain Gourmet Salt Industry Revenue (Million) Forecast, by Application 2019 & 2032
- Table 48: Rest of Europe Gourmet Salt Industry Revenue (Million) Forecast, by Application 2019 & 2032
- Table 49: Global Gourmet Salt Industry Revenue Million Forecast, by Type 2019 & 2032
- Table 50: Global Gourmet Salt Industry Revenue Million Forecast, by Application 2019 & 2032
- Table 51: Global Gourmet Salt Industry Revenue Million Forecast, by Country 2019 & 2032
- Table 52: India Gourmet Salt Industry Revenue (Million) Forecast, by Application 2019 & 2032
- Table 53: China Gourmet Salt Industry Revenue (Million) Forecast, by Application 2019 & 2032
- Table 54: Japan Gourmet Salt Industry Revenue (Million) Forecast, by Application 2019 & 2032
- Table 55: Australia Gourmet Salt Industry Revenue (Million) Forecast, by Application 2019 & 2032
- Table 56: Rest of Asia Pacific Gourmet Salt Industry Revenue (Million) Forecast, by Application 2019 & 2032
- Table 57: Global Gourmet Salt Industry Revenue Million Forecast, by Type 2019 & 2032
- Table 58: Global Gourmet Salt Industry Revenue Million Forecast, by Application 2019 & 2032
- Table 59: Global Gourmet Salt Industry Revenue Million Forecast, by Country 2019 & 2032
- Table 60: Brazil Gourmet Salt Industry Revenue (Million) Forecast, by Application 2019 & 2032
- Table 61: Argentina Gourmet Salt Industry Revenue (Million) Forecast, by Application 2019 & 2032
- Table 62: Rest of South America Gourmet Salt Industry Revenue (Million) Forecast, by Application 2019 & 2032
- Table 63: Global Gourmet Salt Industry Revenue Million Forecast, by Type 2019 & 2032
- Table 64: Global Gourmet Salt Industry Revenue Million Forecast, by Application 2019 & 2032
- Table 65: Global Gourmet Salt Industry Revenue Million Forecast, by Country 2019 & 2032
- Table 66: South Africa Gourmet Salt Industry Revenue (Million) Forecast, by Application 2019 & 2032
- Table 67: United Arab Emirates Gourmet Salt Industry Revenue (Million) Forecast, by Application 2019 & 2032
- Table 68: Rest of Middle East and Africa Gourmet Salt Industry Revenue (Million) Forecast, by Application 2019 & 2032
Frequently Asked Questions
1. What is the projected Compound Annual Growth Rate (CAGR) of the Gourmet Salt Industry?
The projected CAGR is approximately 4.20%.
2. Which companies are prominent players in the Gourmet Salt Industry?
Key companies in the market include Amagansett Sea Salt Co, Saltworks Inc *List Not Exhaustive, Maldon Crystal Salt Co, Cheetham Salt Ltd, Pyramid Salt Pty Ltd, Alaska Pure Sea Salt Co, Murray River Salt, Cargill Inc, Morton Salt Inc, Kalahari Pristine Salt Worx.
3. What are the main segments of the Gourmet Salt Industry?
The market segments include Type, Application.
4. Can you provide details about the market size?
The market size is estimated to be USD 1.84 Million as of 2022.
5. What are some drivers contributing to market growth?
Escalating Demand for Processed Poultry Products; Favorable Government Initiatives to Boost Production.
6. What are the notable trends driving market growth?
Growing Demand from the Food Service Industry.
7. Are there any restraints impacting market growth?
Rising Vegan Trend among Young Consumers; Deeper Penetration of Red Meat Across Saudi Arabia.
8. Can you provide examples of recent developments in the market?
In January 2021, Cargill Salt launched a new purified sea salt flour. The ingredient is a unique type of ultra-fine cut, powder-like sodium chloride. It is suitable for applications that require extremely fine sizing for blending, including dry soup, cereal, flour, and spice mixes, as well as for topping snack foods.
9. What pricing options are available for accessing the report?
Pricing options include single-user, multi-user, and enterprise licenses priced at USD 4750, USD 5250, and USD 8750 respectively.
10. Is the market size provided in terms of value or volume?
The market size is provided in terms of value, measured in Million.
11. Are there any specific market keywords associated with the report?
Yes, the market keyword associated with the report is "Gourmet Salt Industry," which aids in identifying and referencing the specific market segment covered.
12. How do I determine which pricing option suits my needs best?
The pricing options vary based on user requirements and access needs. Individual users may opt for single-user licenses, while businesses requiring broader access may choose multi-user or enterprise licenses for cost-effective access to the report.
13. Are there any additional resources or data provided in the Gourmet Salt Industry report?
While the report offers comprehensive insights, it's advisable to review the specific contents or supplementary materials provided to ascertain if additional resources or data are available.
14. How can I stay updated on further developments or reports in the Gourmet Salt Industry?
To stay informed about further developments, trends, and reports in the Gourmet Salt Industry, consider subscribing to industry newsletters, following relevant companies and organizations, or regularly checking reputable industry news sources and publications.
Methodology
Step 1 - Identification of Relevant Samples Size from Population Database


Step 2 - Approaches for Defining Global Market Size (Value, Volume* & Price*)

Note*: In applicable scenarios
Step 3 - Data Sources
Primary Research
- Web Analytics
- Survey Reports
- Research Institute
- Latest Research Reports
- Opinion Leaders
Secondary Research
- Annual Reports
- White Paper
- Latest Press Release
- Industry Association
- Paid Database
- Investor Presentations

Step 4 - Data Triangulation
Involves using different sources of information in order to increase the validity of a study
These sources are likely to be stakeholders in a program - participants, other researchers, program staff, other community members, and so on.
Then we put all data in single framework & apply various statistical tools to find out the dynamic on the market.
During the analysis stage, feedback from the stakeholder groups would be compared to determine areas of agreement as well as areas of divergence
