

Key Insights
The global gum rosin market, valued at $2632.6 million in 2025, is projected to experience robust growth with a compound annual growth rate (CAGR) of 4.4% from 2025 to 2033. This expansion is propelled by increasing demand across key applications, including paper sizing, printing inks, and adhesives & sealants. Thriving construction and packaging industries significantly contribute to this demand. The growing preference for eco-friendly and bio-based materials further supports gum rosin adoption due to its inherent sustainability. Challenges include raw material price volatility and the rise of synthetic alternatives. Asia-Pacific, led by China and India, is expected to dominate growth due to industrialization. North America and Europe will retain substantial market shares from established industries. The competitive environment features major corporations and regional players, fostering price competition and innovation.
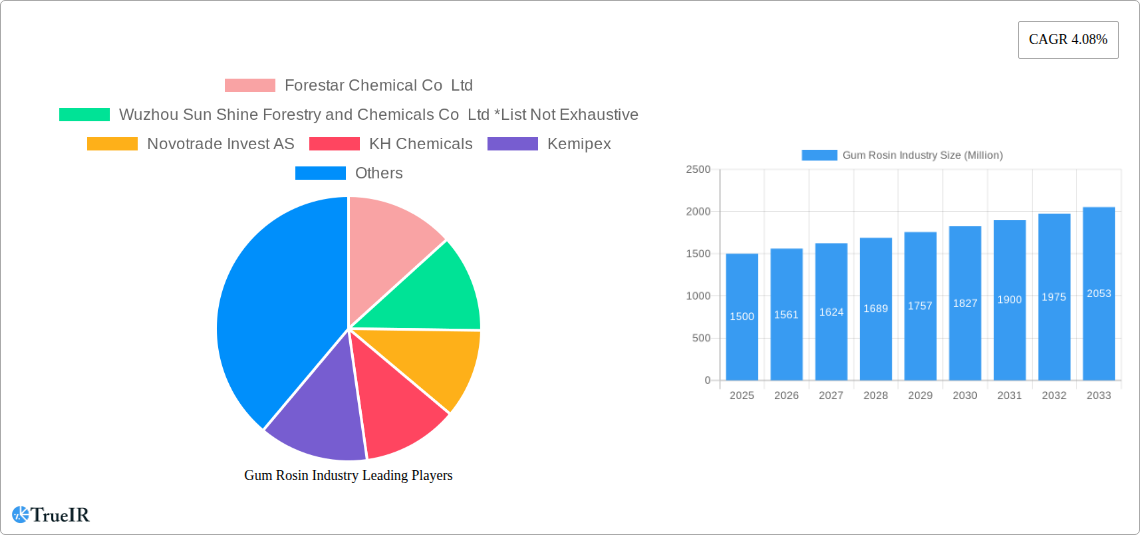
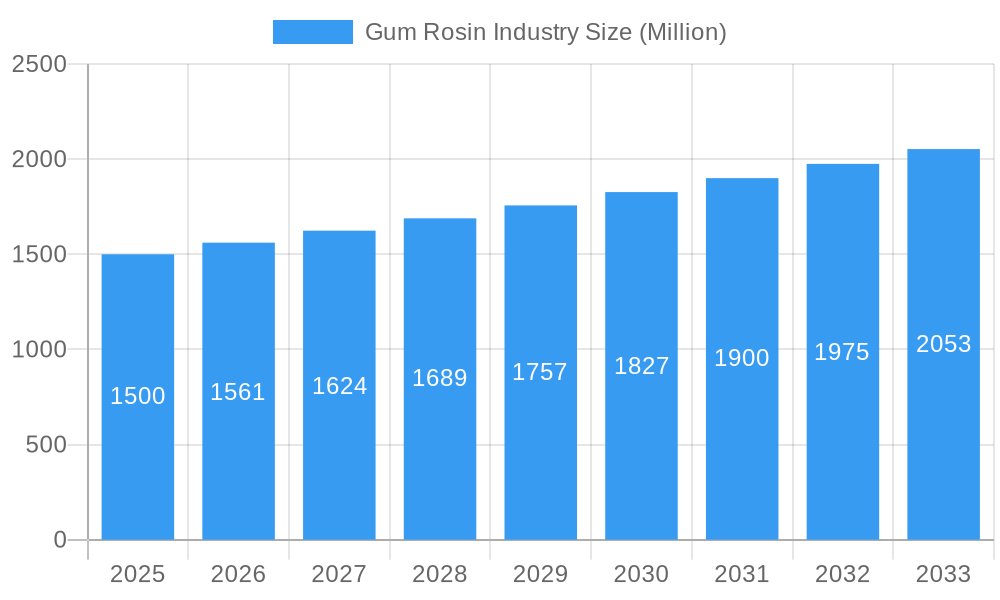
Gum Rosin Industry Market Size (In Billion)
Segment analysis highlights paper sizing as a dominant application, with adhesives and sealants showing particularly strong growth potential, driven by construction and packaging. Companies are pursuing product diversification and strategic alliances. Advancements in rosin extraction, processing, and sustainable sourcing will shape the market's future. Ongoing R&D to enhance rosin-based product performance is anticipated to unlock new applications and drive market expansion.
Gum Rosin Industry Company Market Share
This comprehensive report offers deep insights into the Gum Rosin industry, covering 2019-2033 with a focus on 2025. It provides a thorough understanding of market trends, competitive dynamics, and future growth prospects. The global Gum Rosin market is poised for significant expansion, presenting considerable investment opportunities.
Gum Rosin Industry Market Structure & Competitive Landscape
The Gum Rosin industry exhibits a moderately concentrated market structure, with several key players commanding significant market share. The market concentration ratio (CR4) is estimated at xx% in 2025. Innovation is primarily driven by the development of new resin grades tailored to specific applications, focusing on improved performance and sustainability. Regulatory changes concerning environmental protection and chemical safety significantly impact industry operations, necessitating compliance with stringent regulations. Substitute products, such as synthetic resins and bio-based alternatives, pose a moderate competitive threat, particularly in price-sensitive segments. End-user segmentation is diverse, with significant demand from the paper sizing, adhesives & sealants, and paints & coatings sectors. M&A activity has been relatively modest in recent years, with a total M&A volume of approximately xx Million USD between 2019-2024. Key aspects include:
- Market Concentration: CR4 estimated at xx% in 2025.
- Innovation: Focus on new resin grades with improved performance and sustainability.
- Regulatory Impacts: Stringent environmental and safety regulations drive compliance costs.
- Product Substitutes: Synthetic resins and bio-based alternatives pose a moderate threat.
- End-User Segmentation: Dominant segments include paper sizing, adhesives & sealants, and paints & coatings.
- M&A Trends: Relatively low activity, with approximately xx Million USD in volume (2019-2024).
Gum Rosin Industry Market Trends & Opportunities
The global Gum Rosin market is experiencing steady growth, driven by increasing demand from key end-use sectors and ongoing technological advancements. The market size reached xx Million in 2024 and is projected to reach xx Million by 2033, exhibiting a CAGR of xx% during the forecast period (2025-2033). This growth is fueled by several key factors: the expansion of the packaging industry (particularly in developing economies), the growing adoption of sustainable packaging solutions, and the increasing use of Gum Rosin in specialized applications requiring high-performance resins. Technological advancements, such as the development of modified Gum Rosin with enhanced properties, are further driving market expansion. The market penetration rate for Gum Rosin in key application areas is expected to increase steadily over the forecast period. Competitive dynamics remain intense, with companies focusing on product differentiation, cost optimization, and strategic partnerships to gain market share.
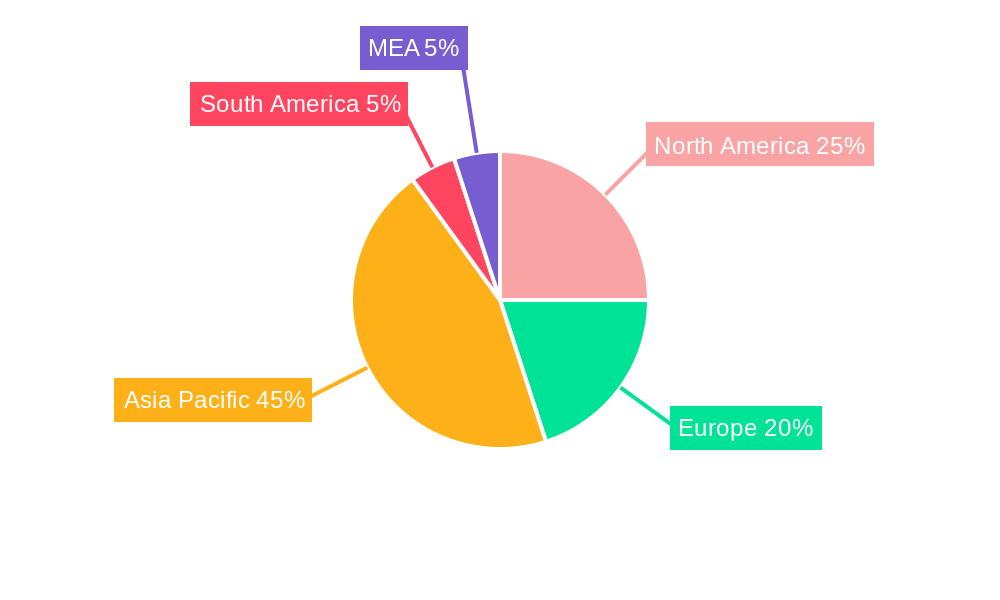
Dominant Markets & Segments in Gum Rosin Industry
The Asia-Pacific region dominates the Gum Rosin market, accounting for approximately xx% of global demand in 2025. China and India are the leading national markets within this region. Among applications, Paper Sizing remains the largest segment, holding xx% market share in 2025, followed by Adhesives and Sealants and Paints and Coatings.
- Key Growth Drivers in Asia-Pacific:
- Rapid industrialization and infrastructure development.
- Growing demand for paper and packaging materials.
- Favorable government policies supporting the forestry sector.
- Dominant Segment: Paper Sizing: Driven by high demand from the packaging and printing industries.
- Other Significant Segments: Adhesives & Sealants, Paints & Coatings, exhibiting steady growth rates.
Gum Rosin Industry Product Analysis
Product innovation focuses on developing modified Gum Rosin with enhanced properties, such as improved tack, adhesion, and durability. These modifications cater to the evolving needs of diverse applications, offering competitive advantages. The market is witnessing the introduction of bio-based Gum Rosin alternatives, driven by increasing environmental concerns and sustainable sourcing initiatives.
Key Drivers, Barriers & Challenges in Gum Rosin Industry
Key Drivers: Growing demand from the packaging industry, technological advancements leading to improved resin properties, government support for sustainable forestry practices.
Challenges: Fluctuations in raw material prices, stringent environmental regulations, competition from synthetic alternatives. The impact of these challenges is estimated to reduce the market CAGR by approximately xx% over the forecast period.
Growth Drivers in the Gum Rosin Industry Market
The growth of the Gum Rosin industry is primarily driven by the increasing demand for paper and packaging materials globally. Technological advancements leading to the development of modified resins with enhanced properties are also key drivers. Government policies promoting sustainable forestry practices are further contributing to industry growth.
Challenges Impacting Gum Rosin Industry Growth
Supply chain disruptions and fluctuations in raw material prices pose significant challenges. Stringent environmental regulations increase production costs and compliance complexities. Intense competition from synthetic resin substitutes further impacts market dynamics.
Key Players Shaping the Gum Rosin Industry Market
- Forestar Chemical Co Ltd
- Wuzhou Sun Shine Forestry and Chemicals Co Ltd
- Novotrade Invest AS
- KH Chemicals
- Kemipex
- PT INDOPICRI (Indonesia Pine Chemical Industri)
- Harima Chemicals Group Inc
- Guangxi Dinghong Resin Co Ltd
- Finjetchemical Co Ltd
- Silver Fern Chemical Inc
- Guangxi Tone Resin Chemical Co Ltd
- United Resins
- Foreverest Resources Ltd
- Arakawa Chemical Industries Ltd
- DRT (Dérivés Résiniques et Terpéniques)
Significant Gum Rosin Industry Milestones
- 2020: Introduction of a new bio-based Gum Rosin by [Company Name, if available].
- 2022: Merger between [Company Name, if available] and [Company Name, if available].
- 2023: Launch of a high-performance Gum Rosin for specialized applications by [Company Name, if available]. (Further milestones to be added based on available data)
Future Outlook for Gum Rosin Industry Market
The Gum Rosin market is poised for continued growth, driven by expanding end-use applications and ongoing technological innovations. Strategic partnerships, investments in R&D, and a focus on sustainability will be crucial for success in this competitive market. The market's future potential is significant, with opportunities for both established players and new entrants.
Gum Rosin Industry Segmentation
-
1. Application
- 1.1. Paper Sizing
- 1.2. Printing Ink
- 1.3. Adhesives and Sealants
- 1.4. Rubber
- 1.5. Paints and Coatings
- 1.6. Other Applications
Gum Rosin Industry Segmentation By Geography
-
1. Asia Pacific
- 1.1. China
- 1.2. India
- 1.3. Japan
- 1.4. South Korea
- 1.5. Rest of Asia Pacific
-
2. North America
- 2.1. United States
- 2.2. Canada
- 2.3. Mexico
-
3. Europe
- 3.1. Germany
- 3.2. United Kingdom
- 3.3. Italy
- 3.4. France
- 3.5. Rest of Europe
-
4. South America
- 4.1. Brazil
- 4.2. Argentina
- 4.3. Rest of South America
-
5. Middle East and Africa
- 5.1. Saudi Arabia
- 5.2. South Africa
- 5.3. Rest of Middle East and Africa
Gum Rosin Industry Regional Market Share
Geographic Coverage of Gum Rosin Industry
Gum Rosin Industry REPORT HIGHLIGHTS
| Aspects | Details |
|---|---|
| Study Period | 2020-2034 |
| Base Year | 2025 |
| Estimated Year | 2026 |
| Forecast Period | 2026-2034 |
| Historical Period | 2020-2025 |
| Growth Rate | CAGR of 4.4% from 2020-2034 |
| Segmentation |
|
Table of Contents
- 1. Introduction
- 1.1. Research Scope
- 1.2. Market Segmentation
- 1.3. Research Objective
- 1.4. Definitions and Assumptions
- 2. Executive Summary
- 2.1. Market Snapshot
- 3. Market Dynamics
- 3.1. Market Drivers
- 3.2. Market Restrains
- 3.3. Market Trends
- 3.4. Market Opportunities
- 4. Market Factor Analysis
- 4.1. Porters Five Forces
- 4.1.1. Bargaining Power of Suppliers
- 4.1.2. Bargaining Power of Buyers
- 4.1.3. Threat of New Entrants
- 4.1.4. Threat of Substitutes
- 4.1.5. Competitive Rivalry
- 4.2. PESTEL analysis
- 4.3. BCG Analysis
- 4.3.1. Stars (High Growth, High Market Share)
- 4.3.2. Cash Cows (Low Growth, High Market Share)
- 4.3.3. Question Mark (High Growth, Low Market Share)
- 4.3.4. Dogs (Low Growth, Low Market Share)
- 4.4. Ansoff Matrix Analysis
- 4.5. Supply Chain Analysis
- 4.6. Regulatory Landscape
- 4.7. Current Market Potential and Opportunity Assessment (TAM–SAM–SOM Framework)
- 4.8. TIR Analyst Note
- 4.1. Porters Five Forces
- 5. Market Analysis, Insights and Forecast 2021-2033
- 5.1. Market Analysis, Insights and Forecast - by Application
- 5.1.1. Paper Sizing
- 5.1.2. Printing Ink
- 5.1.3. Adhesives and Sealants
- 5.1.4. Rubber
- 5.1.5. Paints and Coatings
- 5.1.6. Other Applications
- 5.2. Market Analysis, Insights and Forecast - by Region
- 5.2.1. Asia Pacific
- 5.2.2. North America
- 5.2.3. Europe
- 5.2.4. South America
- 5.2.5. Middle East and Africa
- 5.1. Market Analysis, Insights and Forecast - by Application
- 6. Global Gum Rosin Industry Analysis, Insights and Forecast, 2021-2033
- 6.1. Market Analysis, Insights and Forecast - by Application
- 6.1.1. Paper Sizing
- 6.1.2. Printing Ink
- 6.1.3. Adhesives and Sealants
- 6.1.4. Rubber
- 6.1.5. Paints and Coatings
- 6.1.6. Other Applications
- 6.1. Market Analysis, Insights and Forecast - by Application
- 7. Asia Pacific Gum Rosin Industry Analysis, Insights and Forecast, 2020-2032
- 7.1. Market Analysis, Insights and Forecast - by Application
- 7.1.1. Paper Sizing
- 7.1.2. Printing Ink
- 7.1.3. Adhesives and Sealants
- 7.1.4. Rubber
- 7.1.5. Paints and Coatings
- 7.1.6. Other Applications
- 7.1. Market Analysis, Insights and Forecast - by Application
- 8. North America Gum Rosin Industry Analysis, Insights and Forecast, 2020-2032
- 8.1. Market Analysis, Insights and Forecast - by Application
- 8.1.1. Paper Sizing
- 8.1.2. Printing Ink
- 8.1.3. Adhesives and Sealants
- 8.1.4. Rubber
- 8.1.5. Paints and Coatings
- 8.1.6. Other Applications
- 8.1. Market Analysis, Insights and Forecast - by Application
- 9. Europe Gum Rosin Industry Analysis, Insights and Forecast, 2020-2032
- 9.1. Market Analysis, Insights and Forecast - by Application
- 9.1.1. Paper Sizing
- 9.1.2. Printing Ink
- 9.1.3. Adhesives and Sealants
- 9.1.4. Rubber
- 9.1.5. Paints and Coatings
- 9.1.6. Other Applications
- 9.1. Market Analysis, Insights and Forecast - by Application
- 10. South America Gum Rosin Industry Analysis, Insights and Forecast, 2020-2032
- 10.1. Market Analysis, Insights and Forecast - by Application
- 10.1.1. Paper Sizing
- 10.1.2. Printing Ink
- 10.1.3. Adhesives and Sealants
- 10.1.4. Rubber
- 10.1.5. Paints and Coatings
- 10.1.6. Other Applications
- 10.1. Market Analysis, Insights and Forecast - by Application
- 11. Middle East and Africa Gum Rosin Industry Analysis, Insights and Forecast, 2020-2032
- 11.1. Market Analysis, Insights and Forecast - by Application
- 11.1.1. Paper Sizing
- 11.1.2. Printing Ink
- 11.1.3. Adhesives and Sealants
- 11.1.4. Rubber
- 11.1.5. Paints and Coatings
- 11.1.6. Other Applications
- 11.1. Market Analysis, Insights and Forecast - by Application
- 12. Competitive Analysis
- 12.1. Company Profiles
- 12.1.1 Forestar Chemical Co Ltd
- 12.1.1.1. Company Overview
- 12.1.1.2. Products
- 12.1.1.3. Company Financials
- 12.1.1.4. SWOT Analysis
- 12.1.2 Wuzhou Sun Shine Forestry and Chemicals Co Ltd *List Not Exhaustive
- 12.1.2.1. Company Overview
- 12.1.2.2. Products
- 12.1.2.3. Company Financials
- 12.1.2.4. SWOT Analysis
- 12.1.3 Novotrade Invest AS
- 12.1.3.1. Company Overview
- 12.1.3.2. Products
- 12.1.3.3. Company Financials
- 12.1.3.4. SWOT Analysis
- 12.1.4 KH Chemicals
- 12.1.4.1. Company Overview
- 12.1.4.2. Products
- 12.1.4.3. Company Financials
- 12.1.4.4. SWOT Analysis
- 12.1.5 Kemipex
- 12.1.5.1. Company Overview
- 12.1.5.2. Products
- 12.1.5.3. Company Financials
- 12.1.5.4. SWOT Analysis
- 12.1.6 PT INDOPICRI ( Indonesia Pine Chemical Industri )
- 12.1.6.1. Company Overview
- 12.1.6.2. Products
- 12.1.6.3. Company Financials
- 12.1.6.4. SWOT Analysis
- 12.1.7 Harima Chemicals Group Inc
- 12.1.7.1. Company Overview
- 12.1.7.2. Products
- 12.1.7.3. Company Financials
- 12.1.7.4. SWOT Analysis
- 12.1.8 Guangxi Dinghong Resin Co Ltd
- 12.1.8.1. Company Overview
- 12.1.8.2. Products
- 12.1.8.3. Company Financials
- 12.1.8.4. SWOT Analysis
- 12.1.9 Finjetchemical Co Ltd
- 12.1.9.1. Company Overview
- 12.1.9.2. Products
- 12.1.9.3. Company Financials
- 12.1.9.4. SWOT Analysis
- 12.1.10 Silver Fern Chemical Inc
- 12.1.10.1. Company Overview
- 12.1.10.2. Products
- 12.1.10.3. Company Financials
- 12.1.10.4. SWOT Analysis
- 12.1.11 Guangxi Tone Resin Chemical Co Ltd
- 12.1.11.1. Company Overview
- 12.1.11.2. Products
- 12.1.11.3. Company Financials
- 12.1.11.4. SWOT Analysis
- 12.1.12 United Resins
- 12.1.12.1. Company Overview
- 12.1.12.2. Products
- 12.1.12.3. Company Financials
- 12.1.12.4. SWOT Analysis
- 12.1.13 Foreverest Resources Ltd
- 12.1.13.1. Company Overview
- 12.1.13.2. Products
- 12.1.13.3. Company Financials
- 12.1.13.4. SWOT Analysis
- 12.1.14 Arakawa Chemical Industries Ltd
- 12.1.14.1. Company Overview
- 12.1.14.2. Products
- 12.1.14.3. Company Financials
- 12.1.14.4. SWOT Analysis
- 12.1.15 DRT (Dérivés Résiniques et Terpéniques)
- 12.1.15.1. Company Overview
- 12.1.15.2. Products
- 12.1.15.3. Company Financials
- 12.1.15.4. SWOT Analysis
- 12.1.1 Forestar Chemical Co Ltd
- 12.2. Market Entropy
- 12.2.1 Company's Key Areas Served
- 12.2.2 Recent Developments
- 12.3. Company Market Share Analysis 2025
- 12.3.1 Top 5 Companies Market Share Analysis
- 12.3.2 Top 3 Companies Market Share Analysis
- 12.4. List of Potential Customers
- 13. Research Methodology
List of Figures
- Figure 1: Global Gum Rosin Industry Revenue Breakdown (million, %) by Region 2025 & 2033
- Figure 2: Global Gum Rosin Industry Volume Breakdown (K Tons, %) by Region 2025 & 2033
- Figure 3: Asia Pacific Gum Rosin Industry Revenue (million), by Application 2025 & 2033
- Figure 4: Asia Pacific Gum Rosin Industry Volume (K Tons), by Application 2025 & 2033
- Figure 5: Asia Pacific Gum Rosin Industry Revenue Share (%), by Application 2025 & 2033
- Figure 6: Asia Pacific Gum Rosin Industry Volume Share (%), by Application 2025 & 2033
- Figure 7: Asia Pacific Gum Rosin Industry Revenue (million), by Country 2025 & 2033
- Figure 8: Asia Pacific Gum Rosin Industry Volume (K Tons), by Country 2025 & 2033
- Figure 9: Asia Pacific Gum Rosin Industry Revenue Share (%), by Country 2025 & 2033
- Figure 10: Asia Pacific Gum Rosin Industry Volume Share (%), by Country 2025 & 2033
- Figure 11: North America Gum Rosin Industry Revenue (million), by Application 2025 & 2033
- Figure 12: North America Gum Rosin Industry Volume (K Tons), by Application 2025 & 2033
- Figure 13: North America Gum Rosin Industry Revenue Share (%), by Application 2025 & 2033
- Figure 14: North America Gum Rosin Industry Volume Share (%), by Application 2025 & 2033
- Figure 15: North America Gum Rosin Industry Revenue (million), by Country 2025 & 2033
- Figure 16: North America Gum Rosin Industry Volume (K Tons), by Country 2025 & 2033
- Figure 17: North America Gum Rosin Industry Revenue Share (%), by Country 2025 & 2033
- Figure 18: North America Gum Rosin Industry Volume Share (%), by Country 2025 & 2033
- Figure 19: Europe Gum Rosin Industry Revenue (million), by Application 2025 & 2033
- Figure 20: Europe Gum Rosin Industry Volume (K Tons), by Application 2025 & 2033
- Figure 21: Europe Gum Rosin Industry Revenue Share (%), by Application 2025 & 2033
- Figure 22: Europe Gum Rosin Industry Volume Share (%), by Application 2025 & 2033
- Figure 23: Europe Gum Rosin Industry Revenue (million), by Country 2025 & 2033
- Figure 24: Europe Gum Rosin Industry Volume (K Tons), by Country 2025 & 2033
- Figure 25: Europe Gum Rosin Industry Revenue Share (%), by Country 2025 & 2033
- Figure 26: Europe Gum Rosin Industry Volume Share (%), by Country 2025 & 2033
- Figure 27: South America Gum Rosin Industry Revenue (million), by Application 2025 & 2033
- Figure 28: South America Gum Rosin Industry Volume (K Tons), by Application 2025 & 2033
- Figure 29: South America Gum Rosin Industry Revenue Share (%), by Application 2025 & 2033
- Figure 30: South America Gum Rosin Industry Volume Share (%), by Application 2025 & 2033
- Figure 31: South America Gum Rosin Industry Revenue (million), by Country 2025 & 2033
- Figure 32: South America Gum Rosin Industry Volume (K Tons), by Country 2025 & 2033
- Figure 33: South America Gum Rosin Industry Revenue Share (%), by Country 2025 & 2033
- Figure 34: South America Gum Rosin Industry Volume Share (%), by Country 2025 & 2033
- Figure 35: Middle East and Africa Gum Rosin Industry Revenue (million), by Application 2025 & 2033
- Figure 36: Middle East and Africa Gum Rosin Industry Volume (K Tons), by Application 2025 & 2033
- Figure 37: Middle East and Africa Gum Rosin Industry Revenue Share (%), by Application 2025 & 2033
- Figure 38: Middle East and Africa Gum Rosin Industry Volume Share (%), by Application 2025 & 2033
- Figure 39: Middle East and Africa Gum Rosin Industry Revenue (million), by Country 2025 & 2033
- Figure 40: Middle East and Africa Gum Rosin Industry Volume (K Tons), by Country 2025 & 2033
- Figure 41: Middle East and Africa Gum Rosin Industry Revenue Share (%), by Country 2025 & 2033
- Figure 42: Middle East and Africa Gum Rosin Industry Volume Share (%), by Country 2025 & 2033
List of Tables
- Table 1: Global Gum Rosin Industry Revenue million Forecast, by Application 2020 & 2033
- Table 2: Global Gum Rosin Industry Volume K Tons Forecast, by Application 2020 & 2033
- Table 3: Global Gum Rosin Industry Revenue million Forecast, by Region 2020 & 2033
- Table 4: Global Gum Rosin Industry Volume K Tons Forecast, by Region 2020 & 2033
- Table 5: Global Gum Rosin Industry Revenue million Forecast, by Application 2020 & 2033
- Table 6: Global Gum Rosin Industry Volume K Tons Forecast, by Application 2020 & 2033
- Table 7: Global Gum Rosin Industry Revenue million Forecast, by Country 2020 & 2033
- Table 8: Global Gum Rosin Industry Volume K Tons Forecast, by Country 2020 & 2033
- Table 9: China Gum Rosin Industry Revenue (million) Forecast, by Application 2020 & 2033
- Table 10: China Gum Rosin Industry Volume (K Tons) Forecast, by Application 2020 & 2033
- Table 11: India Gum Rosin Industry Revenue (million) Forecast, by Application 2020 & 2033
- Table 12: India Gum Rosin Industry Volume (K Tons) Forecast, by Application 2020 & 2033
- Table 13: Japan Gum Rosin Industry Revenue (million) Forecast, by Application 2020 & 2033
- Table 14: Japan Gum Rosin Industry Volume (K Tons) Forecast, by Application 2020 & 2033
- Table 15: South Korea Gum Rosin Industry Revenue (million) Forecast, by Application 2020 & 2033
- Table 16: South Korea Gum Rosin Industry Volume (K Tons) Forecast, by Application 2020 & 2033
- Table 17: Rest of Asia Pacific Gum Rosin Industry Revenue (million) Forecast, by Application 2020 & 2033
- Table 18: Rest of Asia Pacific Gum Rosin Industry Volume (K Tons) Forecast, by Application 2020 & 2033
- Table 19: Global Gum Rosin Industry Revenue million Forecast, by Application 2020 & 2033
- Table 20: Global Gum Rosin Industry Volume K Tons Forecast, by Application 2020 & 2033
- Table 21: Global Gum Rosin Industry Revenue million Forecast, by Country 2020 & 2033
- Table 22: Global Gum Rosin Industry Volume K Tons Forecast, by Country 2020 & 2033
- Table 23: United States Gum Rosin Industry Revenue (million) Forecast, by Application 2020 & 2033
- Table 24: United States Gum Rosin Industry Volume (K Tons) Forecast, by Application 2020 & 2033
- Table 25: Canada Gum Rosin Industry Revenue (million) Forecast, by Application 2020 & 2033
- Table 26: Canada Gum Rosin Industry Volume (K Tons) Forecast, by Application 2020 & 2033
- Table 27: Mexico Gum Rosin Industry Revenue (million) Forecast, by Application 2020 & 2033
- Table 28: Mexico Gum Rosin Industry Volume (K Tons) Forecast, by Application 2020 & 2033
- Table 29: Global Gum Rosin Industry Revenue million Forecast, by Application 2020 & 2033
- Table 30: Global Gum Rosin Industry Volume K Tons Forecast, by Application 2020 & 2033
- Table 31: Global Gum Rosin Industry Revenue million Forecast, by Country 2020 & 2033
- Table 32: Global Gum Rosin Industry Volume K Tons Forecast, by Country 2020 & 2033
- Table 33: Germany Gum Rosin Industry Revenue (million) Forecast, by Application 2020 & 2033
- Table 34: Germany Gum Rosin Industry Volume (K Tons) Forecast, by Application 2020 & 2033
- Table 35: United Kingdom Gum Rosin Industry Revenue (million) Forecast, by Application 2020 & 2033
- Table 36: United Kingdom Gum Rosin Industry Volume (K Tons) Forecast, by Application 2020 & 2033
- Table 37: Italy Gum Rosin Industry Revenue (million) Forecast, by Application 2020 & 2033
- Table 38: Italy Gum Rosin Industry Volume (K Tons) Forecast, by Application 2020 & 2033
- Table 39: France Gum Rosin Industry Revenue (million) Forecast, by Application 2020 & 2033
- Table 40: France Gum Rosin Industry Volume (K Tons) Forecast, by Application 2020 & 2033
- Table 41: Rest of Europe Gum Rosin Industry Revenue (million) Forecast, by Application 2020 & 2033
- Table 42: Rest of Europe Gum Rosin Industry Volume (K Tons) Forecast, by Application 2020 & 2033
- Table 43: Global Gum Rosin Industry Revenue million Forecast, by Application 2020 & 2033
- Table 44: Global Gum Rosin Industry Volume K Tons Forecast, by Application 2020 & 2033
- Table 45: Global Gum Rosin Industry Revenue million Forecast, by Country 2020 & 2033
- Table 46: Global Gum Rosin Industry Volume K Tons Forecast, by Country 2020 & 2033
- Table 47: Brazil Gum Rosin Industry Revenue (million) Forecast, by Application 2020 & 2033
- Table 48: Brazil Gum Rosin Industry Volume (K Tons) Forecast, by Application 2020 & 2033
- Table 49: Argentina Gum Rosin Industry Revenue (million) Forecast, by Application 2020 & 2033
- Table 50: Argentina Gum Rosin Industry Volume (K Tons) Forecast, by Application 2020 & 2033
- Table 51: Rest of South America Gum Rosin Industry Revenue (million) Forecast, by Application 2020 & 2033
- Table 52: Rest of South America Gum Rosin Industry Volume (K Tons) Forecast, by Application 2020 & 2033
- Table 53: Global Gum Rosin Industry Revenue million Forecast, by Application 2020 & 2033
- Table 54: Global Gum Rosin Industry Volume K Tons Forecast, by Application 2020 & 2033
- Table 55: Global Gum Rosin Industry Revenue million Forecast, by Country 2020 & 2033
- Table 56: Global Gum Rosin Industry Volume K Tons Forecast, by Country 2020 & 2033
- Table 57: Saudi Arabia Gum Rosin Industry Revenue (million) Forecast, by Application 2020 & 2033
- Table 58: Saudi Arabia Gum Rosin Industry Volume (K Tons) Forecast, by Application 2020 & 2033
- Table 59: South Africa Gum Rosin Industry Revenue (million) Forecast, by Application 2020 & 2033
- Table 60: South Africa Gum Rosin Industry Volume (K Tons) Forecast, by Application 2020 & 2033
- Table 61: Rest of Middle East and Africa Gum Rosin Industry Revenue (million) Forecast, by Application 2020 & 2033
- Table 62: Rest of Middle East and Africa Gum Rosin Industry Volume (K Tons) Forecast, by Application 2020 & 2033
Frequently Asked Questions
1. What is the projected Compound Annual Growth Rate (CAGR) of the Gum Rosin Industry?
The projected CAGR is approximately 4.4%.
2. Which companies are prominent players in the Gum Rosin Industry?
Key companies in the market include Forestar Chemical Co Ltd, Wuzhou Sun Shine Forestry and Chemicals Co Ltd *List Not Exhaustive, Novotrade Invest AS, KH Chemicals, Kemipex, PT INDOPICRI ( Indonesia Pine Chemical Industri ), Harima Chemicals Group Inc, Guangxi Dinghong Resin Co Ltd, Finjetchemical Co Ltd, Silver Fern Chemical Inc, Guangxi Tone Resin Chemical Co Ltd, United Resins, Foreverest Resources Ltd, Arakawa Chemical Industries Ltd, DRT (Dérivés Résiniques et Terpéniques).
3. What are the main segments of the Gum Rosin Industry?
The market segments include Application.
4. Can you provide details about the market size?
The market size is estimated to be USD 2632.6 million as of 2022.
5. What are some drivers contributing to market growth?
Growing Demand for Bio-based Adhesives and Sealants; Burgeoning Paper Packaging Industry; Other Drivers.
6. What are the notable trends driving market growth?
The Adhesives and Sealants Segment is Expected to Dominate the Market.
7. Are there any restraints impacting market growth?
Shift of Interest toward Tall Oil Rosin-based Phenolic Resins; Other Restraints.
8. Can you provide examples of recent developments in the market?
N/A
9. What pricing options are available for accessing the report?
Pricing options include single-user, multi-user, and enterprise licenses priced at USD 4750, USD 5250, and USD 8750 respectively.
10. Is the market size provided in terms of value or volume?
The market size is provided in terms of value, measured in million and volume, measured in K Tons.
11. Are there any specific market keywords associated with the report?
Yes, the market keyword associated with the report is "Gum Rosin Industry," which aids in identifying and referencing the specific market segment covered.
12. How do I determine which pricing option suits my needs best?
The pricing options vary based on user requirements and access needs. Individual users may opt for single-user licenses, while businesses requiring broader access may choose multi-user or enterprise licenses for cost-effective access to the report.
13. Are there any additional resources or data provided in the Gum Rosin Industry report?
While the report offers comprehensive insights, it's advisable to review the specific contents or supplementary materials provided to ascertain if additional resources or data are available.
14. How can I stay updated on further developments or reports in the Gum Rosin Industry?
To stay informed about further developments, trends, and reports in the Gum Rosin Industry, consider subscribing to industry newsletters, following relevant companies and organizations, or regularly checking reputable industry news sources and publications.
Methodology
Step 1 - Identification of Relevant Samples Size from Population Database


Step 2 - Approaches for Defining Global Market Size (Value, Volume* & Price*)

Note*: In applicable scenarios
Step 3 - Data Sources
Primary Research
- Web Analytics
- Survey Reports
- Research Institute
- Latest Research Reports
- Opinion Leaders
Secondary Research
- Annual Reports
- White Paper
- Latest Press Release
- Industry Association
- Paid Database
- Investor Presentations

Step 4 - Data Triangulation
Involves using different sources of information in order to increase the validity of a study
These sources are likely to be stakeholders in a program - participants, other researchers, program staff, other community members, and so on.
Then we put all data in single framework & apply various statistical tools to find out the dynamic on the market.
During the analysis stage, feedback from the stakeholder groups would be compared to determine areas of agreement as well as areas of divergence