

Key Insights
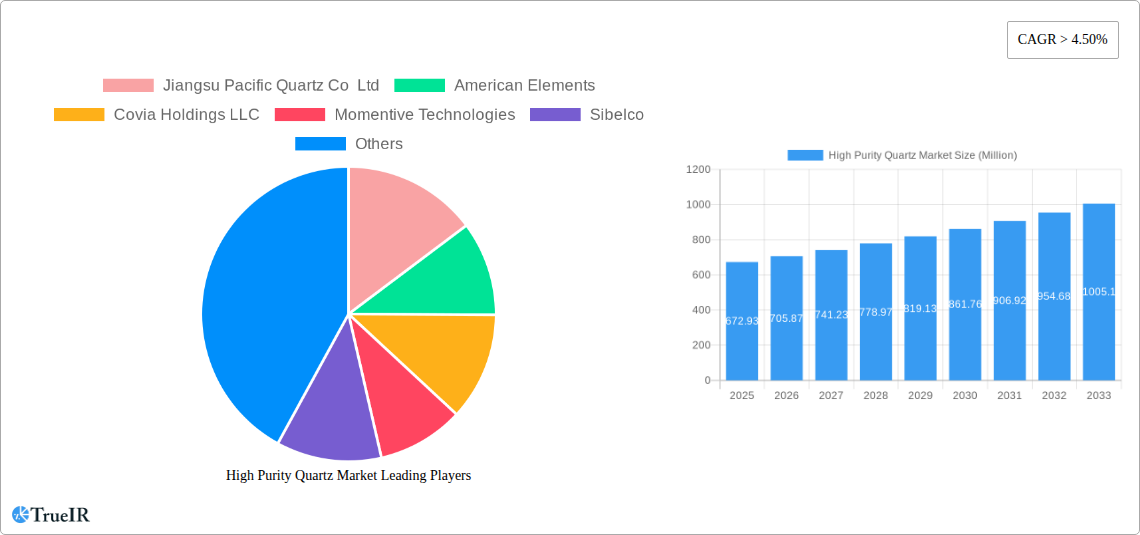
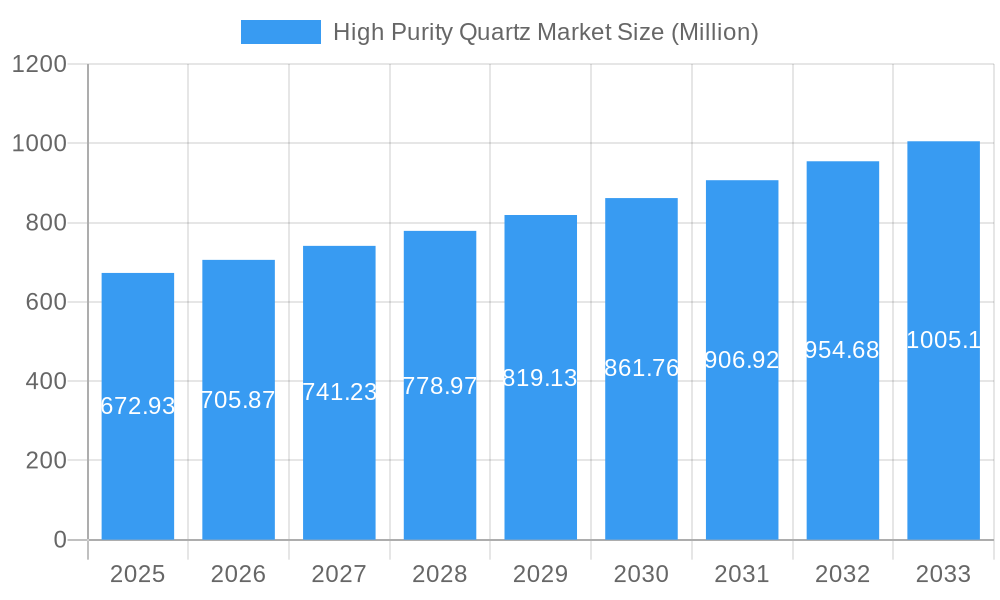
The high-purity quartz market, valued at $672.93 million in 2025, is projected to experience robust growth, exhibiting a compound annual growth rate (CAGR) exceeding 4.50% from 2025 to 2033. This expansion is driven by the burgeoning demand for high-purity quartz in various technologically advanced sectors. The semiconductor industry, a significant consumer, relies on high-purity quartz for crucial components in integrated circuits and other electronic devices. Similarly, the solar energy sector's growth fuels demand for high-purity quartz in solar cells and photovoltaic systems. Further bolstering market growth are applications in lighting (LEDs and optical fibers), telecommunications, and the burgeoning microelectronics industry. The increasing adoption of advanced technologies and the ongoing miniaturization of electronic components necessitate the use of high-purity quartz, further solidifying its market position. While supply chain constraints and price volatility of raw materials pose some challenges, technological advancements in quartz purification and the development of sustainable sourcing practices are mitigating these restraints. Leading companies like Jiangsu Pacific Quartz Co Ltd, American Elements, and others are actively investing in R&D and expanding their production capacities to cater to the rising global demand. Geographical distribution sees strong growth across North America and Asia-Pacific, reflecting the concentration of key industries in these regions.
High Purity Quartz Market Market Size (In Million)
The market segmentation reveals a strong reliance on the semiconductor and solar industries, which together account for a significant portion of the total market share. However, the lighting, telecommunications, and microelectronics segments are exhibiting strong growth trajectories, indicating diversification and future potential. Regional analysis points to North America and Asia-Pacific as key markets, driven by established technological hubs and significant manufacturing activities. The European market, while mature, is also showing steady growth, driven by investments in renewable energy and technological advancements. Future market growth will likely be influenced by factors such as advancements in manufacturing processes, evolving technological applications, government policies promoting renewable energy, and the overall global economic landscape. The continued miniaturization of electronic devices and the rising demand for energy-efficient technologies will likely drive further expansion of this vital market.
High Purity Quartz Market Company Market Share
High Purity Quartz Market: A Comprehensive Report (2019-2033)
This in-depth report provides a comprehensive analysis of the High Purity Quartz market, offering valuable insights into market dynamics, competitive landscape, and future growth prospects. Covering the period 2019-2033, with a base year of 2025 and a forecast period of 2025-2033, this report is an essential resource for industry stakeholders, investors, and researchers seeking to understand this rapidly evolving market. The market is expected to reach xx Million by 2033, exhibiting a CAGR of xx% during the forecast period.
High Purity Quartz Market Market Structure & Competitive Landscape
The High Purity Quartz market is characterized by a moderately concentrated structure, featuring a blend of established global leaders and specialized niche players. The Herfindahl-Hirschman Index (HHI) for 2024 is estimated at around 1800, signifying a moderately consolidated market. Giants like Sibelco, Imerys, and Momentive Technologies command a substantial market share due to their extensive production capabilities, advanced technological expertise, and strong global distribution networks. Complementing these leaders are agile, specialized firms such as Jiangsu Pacific Quartz Co Ltd and ULTRA HPQ, which adeptly serve specific, high-value segments with tailored solutions.
Innovation remains the cornerstone of competitive advantage, with significant R&D investments dedicated to achieving unprecedented purity levels, optimizing production efficiency for cost reduction, and pioneering novel applications. The operational landscape is heavily influenced by stringent regulatory frameworks, particularly environmental compliance and worker safety standards, which necessitate continuous investment in advanced manufacturing processes and contribute to operational expenditures. While the unique intrinsic properties of high-purity quartz limit direct product substitution, the emerging threat from increasingly sophisticated synthetic alternatives is a dynamic factor in the competitive environment.
The market is strategically segmented by application, with the semiconductor industry standing out as the primary demand driver, followed closely by the burgeoning solar energy sector and the established optical applications. Mergers and acquisitions (M&A) activity has been a steady, albeit moderate, feature of the market in recent years, with an estimated M&A volume of approximately USD 500 Million from 2019 to 2024. These strategic acquisitions predominantly involve smaller, innovative companies being absorbed by larger entities to enhance market penetration, diversify product portfolios, and integrate new technological capabilities.
High Purity Quartz Market Market Trends & Opportunities
The High Purity Quartz market is currently experiencing a period of robust and sustained growth, propelled by escalating demand across a spectrum of critical end-use industries. The market size witnessed a significant expansion from approximately USD 1.2 Billion in 2019 to an estimated USD 1.8 Billion in 2024, with projections indicating a further surge to USD 3.5 Billion by 2033, representing a compelling Compound Annual Growth Rate (CAGR) of over 7%. This impressive trajectory is fundamentally driven by the accelerating adoption of high-purity quartz in cutting-edge technologies, most notably in the intricate processes of semiconductor manufacturing, the large-scale deployment of solar energy solutions, and the expansion of high-speed optical fiber communication networks. Concurrently, continuous advancements in crystal growth methodologies and purification techniques are acting as powerful catalysts for market expansion.
Evolving consumer and industry preferences are increasingly gravitating towards superior purity grades and enhanced consistency in quartz materials. This demand is directly influenced by the stringent and often unforgiving requirements of sophisticated, high-performance applications. The competitive arena is characterized by an intense rivalry among key market participants, who are strategically focusing on maintaining price competitiveness, achieving tangible product differentiation through technological innovation, and executing ambitious geographic expansion strategies. Market penetration rates exhibit considerable regional and application-specific variations, with the most profound adoption observed in highly developed economies that possess robust technological infrastructures and significant R&D investments.
Dominant Markets & Segments in High Purity Quartz Market
The semiconductor industry is the dominant segment, accounting for approximately xx% of the total market value in 2024. This is driven by the crucial role of high-purity quartz in the fabrication of integrated circuits and other semiconductor devices. Geographically, North America and East Asia represent the leading markets, fueled by robust semiconductor manufacturing hubs and strong government support for the development of high-tech industries.
- Key Growth Drivers in Semiconductor Segment:
- Rapid growth of the global electronics industry.
- Increasing demand for advanced semiconductor devices.
- Significant investments in semiconductor manufacturing facilities.
- Government initiatives promoting semiconductor technology development.
The solar energy sector is another significant segment, driven by the increasing adoption of photovoltaic (PV) technology globally. Growth is particularly strong in regions with supportive government policies and abundant solar resources. Other applications, such as lighting, telecommunications, and microelectronics, are also witnessing substantial growth, contributing to the overall market expansion.
High Purity Quartz Market Product Analysis
High-purity quartz products are defined by their unparalleled optical clarity, exceptional thermal stability, and superior resistance to chemical corrosion. The industry is actively engaged in relentless innovation, with a primary focus on elevating purity levels, refining crystal growth processes for optimal structural integrity, and minimizing intrinsic defects to meticulously meet the demanding specifications of advanced applications. Recent breakthroughs include the successful development of larger, demonstrably higher-quality quartz crystals and the implementation of more efficient, cost-effective purification methodologies. These advancements collectively contribute to enhanced performance characteristics and improved economic viability of high-purity quartz products, thereby fueling their broader adoption across diverse industrial sectors.
Key Drivers, Barriers & Challenges in High Purity Quartz Market
Key Drivers: The market is primarily driven by the increasing demand for high-purity quartz in the semiconductor, solar, and optical industries, fueled by technological advancements in these sectors. Government initiatives promoting the development of clean energy technologies and advanced electronics also contribute significantly. Economic growth, particularly in emerging economies, is creating new market opportunities.
Key Challenges: The market faces challenges related to the inherent scarcity of high-quality quartz raw materials and the complexities of the purification process. Supply chain disruptions can lead to production bottlenecks and price volatility. Stringent regulatory requirements concerning environmental protection and worker safety add to the operational costs. Intense competition among established players and the emergence of new entrants further exert pressure on profitability. The total estimated impact of these challenges on market growth is approximately xx%.
Growth Drivers in the High Purity Quartz Market Market
Technological advancements in crystal growth and purification techniques are key drivers, leading to improved purity levels and larger crystal sizes. Economic growth in emerging markets is driving demand for high-purity quartz in various applications. Supportive government policies, particularly in the renewable energy and advanced technology sectors, are creating favorable market conditions.
Challenges Impacting High Purity Quartz Market Growth
Supply chain disruptions, particularly regarding the availability of high-quality raw materials, pose a significant challenge. Stringent environmental regulations and worker safety standards increase production costs and operational complexity. The competitive landscape is characterized by intense competition among established players, leading to price pressures and reduced profit margins.
Key Players Shaping the High Purity Quartz Market Market
- Jiangsu Pacific Quartz Co Ltd
- American Elements
- Covia Holdings LLC
- Momentive Technologies
- Sibelco
- Imerys
- ULTRA HPQ
- Russian Quartz LLC
- Australian Silica Quartz Group Ltd
- The Quartz Corp
Significant High Purity Quartz Market Industry Milestones
- April 2023: Sibelco unveiled a substantial investment of approximately USD 200 Million, earmarked for doubling its high-purity quartz installed capacity at its strategically located Spruce Pine facility in North Carolina, United States. This significant expansion is poised to dramatically bolster the global supply of high-purity quartz, potentially influencing market pricing dynamics and intensifying competitive pressures.
- October 2023: Imerys announced the acquisition of a specialized high-purity quartz producer in Europe, aiming to strengthen its European market presence and expand its product offerings for the semiconductor industry. This strategic move underscores the trend of consolidation and capacity expansion within the market.
- January 2024: Momentive Technologies reported the successful development of a new proprietary purification process that achieves an industry-leading purity level of 99.9999%, further setting a new benchmark for quality and opening doors for ultra-sensitive applications.
Future Outlook for High Purity Quartz Market Market
The High Purity Quartz market is on an upward trajectory, poised for continued and significant growth. This positive outlook is underpinned by a confluence of factors, including relentless technological advancements, an insatiable demand from pivotal high-growth sectors such as semiconductors and renewable energy, and increasingly supportive government policies aimed at fostering innovation and domestic manufacturing. Strategic opportunities abound for forward-thinking companies to make substantial investments in research and development, scale up production capacities proactively, and diligently explore novel application domains. The market is anticipated to experience particularly pronounced expansion within emerging economies, presenting lucrative and promising growth prospects for all market participants committed to innovation and strategic foresight.
High Purity Quartz Market Segmentation
-
1. Application
- 1.1. Semiconductor
- 1.2. Solar
- 1.3. Lighting
- 1.4. Telecom and Optics
- 1.5. Microelectronics
- 1.6. Others
High Purity Quartz Market Segmentation By Geography
-
1. Asia Pacific
- 1.1. China
- 1.2. India
- 1.3. Japan
- 1.4. South Korea
- 1.5. Rest of Asia Pacific
-
2. North America
- 2.1. United States
- 2.2. Canada
- 2.3. Mexico
-
3. Europe
- 3.1. Germany
- 3.2. United Kingdom
- 3.3. Italy
- 3.4. France
- 3.5. Rest of Europe
-
4. South America
- 4.1. Brazil
- 4.2. Argentina
- 4.3. Rest of South America
-
5. Middle East and Africa
- 5.1. Saudi Arabia
- 5.2. South Africa
- 5.3. Rest of Middle East and Africa
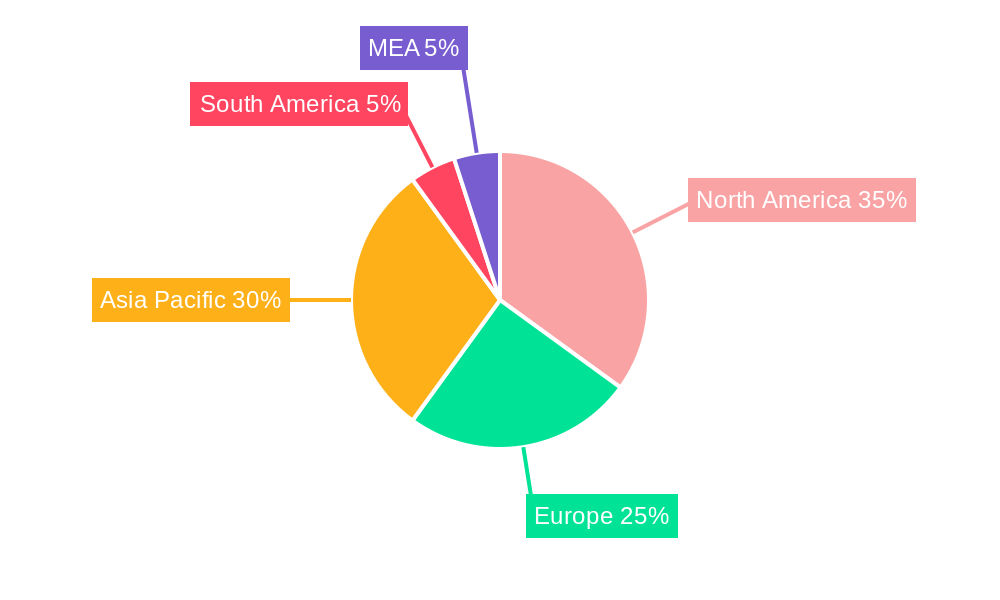
High Purity Quartz Market Regional Market Share
Geographic Coverage of High Purity Quartz Market
High Purity Quartz Market REPORT HIGHLIGHTS
| Aspects | Details |
|---|---|
| Study Period | 2020-2034 |
| Base Year | 2025 |
| Estimated Year | 2026 |
| Forecast Period | 2026-2034 |
| Historical Period | 2020-2025 |
| Growth Rate | CAGR of > 4.50% from 2020-2034 |
| Segmentation |
|
Table of Contents
- 1. Introduction
- 1.1. Research Scope
- 1.2. Market Segmentation
- 1.3. Research Objective
- 1.4. Definitions and Assumptions
- 2. Executive Summary
- 2.1. Market Snapshot
- 3. Market Dynamics
- 3.1. Market Drivers
- 3.2. Market Restrains
- 3.3. Market Trends
- 3.4. Market Opportunities
- 4. Market Factor Analysis
- 4.1. Porters Five Forces
- 4.1.1. Bargaining Power of Suppliers
- 4.1.2. Bargaining Power of Buyers
- 4.1.3. Threat of New Entrants
- 4.1.4. Threat of Substitutes
- 4.1.5. Competitive Rivalry
- 4.2. PESTEL analysis
- 4.3. BCG Analysis
- 4.3.1. Stars (High Growth, High Market Share)
- 4.3.2. Cash Cows (Low Growth, High Market Share)
- 4.3.3. Question Mark (High Growth, Low Market Share)
- 4.3.4. Dogs (Low Growth, Low Market Share)
- 4.4. Ansoff Matrix Analysis
- 4.5. Supply Chain Analysis
- 4.6. Regulatory Landscape
- 4.7. Current Market Potential and Opportunity Assessment (TAM–SAM–SOM Framework)
- 4.8. TIR Analyst Note
- 4.1. Porters Five Forces
- 5. Market Analysis, Insights and Forecast 2021-2033
- 5.1. Market Analysis, Insights and Forecast - by Application
- 5.1.1. Semiconductor
- 5.1.2. Solar
- 5.1.3. Lighting
- 5.1.4. Telecom and Optics
- 5.1.5. Microelectronics
- 5.1.6. Others
- 5.2. Market Analysis, Insights and Forecast - by Region
- 5.2.1. Asia Pacific
- 5.2.2. North America
- 5.2.3. Europe
- 5.2.4. South America
- 5.2.5. Middle East and Africa
- 5.1. Market Analysis, Insights and Forecast - by Application
- 6. Global High Purity Quartz Market Analysis, Insights and Forecast, 2021-2033
- 6.1. Market Analysis, Insights and Forecast - by Application
- 6.1.1. Semiconductor
- 6.1.2. Solar
- 6.1.3. Lighting
- 6.1.4. Telecom and Optics
- 6.1.5. Microelectronics
- 6.1.6. Others
- 6.1. Market Analysis, Insights and Forecast - by Application
- 7. Asia Pacific High Purity Quartz Market Analysis, Insights and Forecast, 2020-2032
- 7.1. Market Analysis, Insights and Forecast - by Application
- 7.1.1. Semiconductor
- 7.1.2. Solar
- 7.1.3. Lighting
- 7.1.4. Telecom and Optics
- 7.1.5. Microelectronics
- 7.1.6. Others
- 7.1. Market Analysis, Insights and Forecast - by Application
- 8. North America High Purity Quartz Market Analysis, Insights and Forecast, 2020-2032
- 8.1. Market Analysis, Insights and Forecast - by Application
- 8.1.1. Semiconductor
- 8.1.2. Solar
- 8.1.3. Lighting
- 8.1.4. Telecom and Optics
- 8.1.5. Microelectronics
- 8.1.6. Others
- 8.1. Market Analysis, Insights and Forecast - by Application
- 9. Europe High Purity Quartz Market Analysis, Insights and Forecast, 2020-2032
- 9.1. Market Analysis, Insights and Forecast - by Application
- 9.1.1. Semiconductor
- 9.1.2. Solar
- 9.1.3. Lighting
- 9.1.4. Telecom and Optics
- 9.1.5. Microelectronics
- 9.1.6. Others
- 9.1. Market Analysis, Insights and Forecast - by Application
- 10. South America High Purity Quartz Market Analysis, Insights and Forecast, 2020-2032
- 10.1. Market Analysis, Insights and Forecast - by Application
- 10.1.1. Semiconductor
- 10.1.2. Solar
- 10.1.3. Lighting
- 10.1.4. Telecom and Optics
- 10.1.5. Microelectronics
- 10.1.6. Others
- 10.1. Market Analysis, Insights and Forecast - by Application
- 11. Middle East and Africa High Purity Quartz Market Analysis, Insights and Forecast, 2020-2032
- 11.1. Market Analysis, Insights and Forecast - by Application
- 11.1.1. Semiconductor
- 11.1.2. Solar
- 11.1.3. Lighting
- 11.1.4. Telecom and Optics
- 11.1.5. Microelectronics
- 11.1.6. Others
- 11.1. Market Analysis, Insights and Forecast - by Application
- 12. Competitive Analysis
- 12.1. Company Profiles
- 12.1.1 Jiangsu Pacific Quartz Co Ltd
- 12.1.1.1. Company Overview
- 12.1.1.2. Products
- 12.1.1.3. Company Financials
- 12.1.1.4. SWOT Analysis
- 12.1.2 American Elements
- 12.1.2.1. Company Overview
- 12.1.2.2. Products
- 12.1.2.3. Company Financials
- 12.1.2.4. SWOT Analysis
- 12.1.3 Covia Holdings LLC
- 12.1.3.1. Company Overview
- 12.1.3.2. Products
- 12.1.3.3. Company Financials
- 12.1.3.4. SWOT Analysis
- 12.1.4 Momentive Technologies
- 12.1.4.1. Company Overview
- 12.1.4.2. Products
- 12.1.4.3. Company Financials
- 12.1.4.4. SWOT Analysis
- 12.1.5 Sibelco
- 12.1.5.1. Company Overview
- 12.1.5.2. Products
- 12.1.5.3. Company Financials
- 12.1.5.4. SWOT Analysis
- 12.1.6 Imerys
- 12.1.6.1. Company Overview
- 12.1.6.2. Products
- 12.1.6.3. Company Financials
- 12.1.6.4. SWOT Analysis
- 12.1.7 ULTRA HPQ
- 12.1.7.1. Company Overview
- 12.1.7.2. Products
- 12.1.7.3. Company Financials
- 12.1.7.4. SWOT Analysis
- 12.1.8 Russian Quartz LLC
- 12.1.8.1. Company Overview
- 12.1.8.2. Products
- 12.1.8.3. Company Financials
- 12.1.8.4. SWOT Analysis
- 12.1.9 Australian Silica Quartz Group Ltd
- 12.1.9.1. Company Overview
- 12.1.9.2. Products
- 12.1.9.3. Company Financials
- 12.1.9.4. SWOT Analysis
- 12.1.10 The Quartz Corp
- 12.1.10.1. Company Overview
- 12.1.10.2. Products
- 12.1.10.3. Company Financials
- 12.1.10.4. SWOT Analysis
- 12.1.1 Jiangsu Pacific Quartz Co Ltd
- 12.2. Market Entropy
- 12.2.1 Company's Key Areas Served
- 12.2.2 Recent Developments
- 12.3. Company Market Share Analysis 2025
- 12.3.1 Top 5 Companies Market Share Analysis
- 12.3.2 Top 3 Companies Market Share Analysis
- 12.4. List of Potential Customers
- 13. Research Methodology
List of Figures
- Figure 1: Global High Purity Quartz Market Revenue Breakdown (Million, %) by Region 2025 & 2033
- Figure 2: Global High Purity Quartz Market Volume Breakdown (K Tons, %) by Region 2025 & 2033
- Figure 3: Asia Pacific High Purity Quartz Market Revenue (Million), by Application 2025 & 2033
- Figure 4: Asia Pacific High Purity Quartz Market Volume (K Tons), by Application 2025 & 2033
- Figure 5: Asia Pacific High Purity Quartz Market Revenue Share (%), by Application 2025 & 2033
- Figure 6: Asia Pacific High Purity Quartz Market Volume Share (%), by Application 2025 & 2033
- Figure 7: Asia Pacific High Purity Quartz Market Revenue (Million), by Country 2025 & 2033
- Figure 8: Asia Pacific High Purity Quartz Market Volume (K Tons), by Country 2025 & 2033
- Figure 9: Asia Pacific High Purity Quartz Market Revenue Share (%), by Country 2025 & 2033
- Figure 10: Asia Pacific High Purity Quartz Market Volume Share (%), by Country 2025 & 2033
- Figure 11: North America High Purity Quartz Market Revenue (Million), by Application 2025 & 2033
- Figure 12: North America High Purity Quartz Market Volume (K Tons), by Application 2025 & 2033
- Figure 13: North America High Purity Quartz Market Revenue Share (%), by Application 2025 & 2033
- Figure 14: North America High Purity Quartz Market Volume Share (%), by Application 2025 & 2033
- Figure 15: North America High Purity Quartz Market Revenue (Million), by Country 2025 & 2033
- Figure 16: North America High Purity Quartz Market Volume (K Tons), by Country 2025 & 2033
- Figure 17: North America High Purity Quartz Market Revenue Share (%), by Country 2025 & 2033
- Figure 18: North America High Purity Quartz Market Volume Share (%), by Country 2025 & 2033
- Figure 19: Europe High Purity Quartz Market Revenue (Million), by Application 2025 & 2033
- Figure 20: Europe High Purity Quartz Market Volume (K Tons), by Application 2025 & 2033
- Figure 21: Europe High Purity Quartz Market Revenue Share (%), by Application 2025 & 2033
- Figure 22: Europe High Purity Quartz Market Volume Share (%), by Application 2025 & 2033
- Figure 23: Europe High Purity Quartz Market Revenue (Million), by Country 2025 & 2033
- Figure 24: Europe High Purity Quartz Market Volume (K Tons), by Country 2025 & 2033
- Figure 25: Europe High Purity Quartz Market Revenue Share (%), by Country 2025 & 2033
- Figure 26: Europe High Purity Quartz Market Volume Share (%), by Country 2025 & 2033
- Figure 27: South America High Purity Quartz Market Revenue (Million), by Application 2025 & 2033
- Figure 28: South America High Purity Quartz Market Volume (K Tons), by Application 2025 & 2033
- Figure 29: South America High Purity Quartz Market Revenue Share (%), by Application 2025 & 2033
- Figure 30: South America High Purity Quartz Market Volume Share (%), by Application 2025 & 2033
- Figure 31: South America High Purity Quartz Market Revenue (Million), by Country 2025 & 2033
- Figure 32: South America High Purity Quartz Market Volume (K Tons), by Country 2025 & 2033
- Figure 33: South America High Purity Quartz Market Revenue Share (%), by Country 2025 & 2033
- Figure 34: South America High Purity Quartz Market Volume Share (%), by Country 2025 & 2033
- Figure 35: Middle East and Africa High Purity Quartz Market Revenue (Million), by Application 2025 & 2033
- Figure 36: Middle East and Africa High Purity Quartz Market Volume (K Tons), by Application 2025 & 2033
- Figure 37: Middle East and Africa High Purity Quartz Market Revenue Share (%), by Application 2025 & 2033
- Figure 38: Middle East and Africa High Purity Quartz Market Volume Share (%), by Application 2025 & 2033
- Figure 39: Middle East and Africa High Purity Quartz Market Revenue (Million), by Country 2025 & 2033
- Figure 40: Middle East and Africa High Purity Quartz Market Volume (K Tons), by Country 2025 & 2033
- Figure 41: Middle East and Africa High Purity Quartz Market Revenue Share (%), by Country 2025 & 2033
- Figure 42: Middle East and Africa High Purity Quartz Market Volume Share (%), by Country 2025 & 2033
List of Tables
- Table 1: Global High Purity Quartz Market Revenue Million Forecast, by Application 2020 & 2033
- Table 2: Global High Purity Quartz Market Volume K Tons Forecast, by Application 2020 & 2033
- Table 3: Global High Purity Quartz Market Revenue Million Forecast, by Region 2020 & 2033
- Table 4: Global High Purity Quartz Market Volume K Tons Forecast, by Region 2020 & 2033
- Table 5: Global High Purity Quartz Market Revenue Million Forecast, by Application 2020 & 2033
- Table 6: Global High Purity Quartz Market Volume K Tons Forecast, by Application 2020 & 2033
- Table 7: Global High Purity Quartz Market Revenue Million Forecast, by Country 2020 & 2033
- Table 8: Global High Purity Quartz Market Volume K Tons Forecast, by Country 2020 & 2033
- Table 9: China High Purity Quartz Market Revenue (Million) Forecast, by Application 2020 & 2033
- Table 10: China High Purity Quartz Market Volume (K Tons) Forecast, by Application 2020 & 2033
- Table 11: India High Purity Quartz Market Revenue (Million) Forecast, by Application 2020 & 2033
- Table 12: India High Purity Quartz Market Volume (K Tons) Forecast, by Application 2020 & 2033
- Table 13: Japan High Purity Quartz Market Revenue (Million) Forecast, by Application 2020 & 2033
- Table 14: Japan High Purity Quartz Market Volume (K Tons) Forecast, by Application 2020 & 2033
- Table 15: South Korea High Purity Quartz Market Revenue (Million) Forecast, by Application 2020 & 2033
- Table 16: South Korea High Purity Quartz Market Volume (K Tons) Forecast, by Application 2020 & 2033
- Table 17: Rest of Asia Pacific High Purity Quartz Market Revenue (Million) Forecast, by Application 2020 & 2033
- Table 18: Rest of Asia Pacific High Purity Quartz Market Volume (K Tons) Forecast, by Application 2020 & 2033
- Table 19: Global High Purity Quartz Market Revenue Million Forecast, by Application 2020 & 2033
- Table 20: Global High Purity Quartz Market Volume K Tons Forecast, by Application 2020 & 2033
- Table 21: Global High Purity Quartz Market Revenue Million Forecast, by Country 2020 & 2033
- Table 22: Global High Purity Quartz Market Volume K Tons Forecast, by Country 2020 & 2033
- Table 23: United States High Purity Quartz Market Revenue (Million) Forecast, by Application 2020 & 2033
- Table 24: United States High Purity Quartz Market Volume (K Tons) Forecast, by Application 2020 & 2033
- Table 25: Canada High Purity Quartz Market Revenue (Million) Forecast, by Application 2020 & 2033
- Table 26: Canada High Purity Quartz Market Volume (K Tons) Forecast, by Application 2020 & 2033
- Table 27: Mexico High Purity Quartz Market Revenue (Million) Forecast, by Application 2020 & 2033
- Table 28: Mexico High Purity Quartz Market Volume (K Tons) Forecast, by Application 2020 & 2033
- Table 29: Global High Purity Quartz Market Revenue Million Forecast, by Application 2020 & 2033
- Table 30: Global High Purity Quartz Market Volume K Tons Forecast, by Application 2020 & 2033
- Table 31: Global High Purity Quartz Market Revenue Million Forecast, by Country 2020 & 2033
- Table 32: Global High Purity Quartz Market Volume K Tons Forecast, by Country 2020 & 2033
- Table 33: Germany High Purity Quartz Market Revenue (Million) Forecast, by Application 2020 & 2033
- Table 34: Germany High Purity Quartz Market Volume (K Tons) Forecast, by Application 2020 & 2033
- Table 35: United Kingdom High Purity Quartz Market Revenue (Million) Forecast, by Application 2020 & 2033
- Table 36: United Kingdom High Purity Quartz Market Volume (K Tons) Forecast, by Application 2020 & 2033
- Table 37: Italy High Purity Quartz Market Revenue (Million) Forecast, by Application 2020 & 2033
- Table 38: Italy High Purity Quartz Market Volume (K Tons) Forecast, by Application 2020 & 2033
- Table 39: France High Purity Quartz Market Revenue (Million) Forecast, by Application 2020 & 2033
- Table 40: France High Purity Quartz Market Volume (K Tons) Forecast, by Application 2020 & 2033
- Table 41: Rest of Europe High Purity Quartz Market Revenue (Million) Forecast, by Application 2020 & 2033
- Table 42: Rest of Europe High Purity Quartz Market Volume (K Tons) Forecast, by Application 2020 & 2033
- Table 43: Global High Purity Quartz Market Revenue Million Forecast, by Application 2020 & 2033
- Table 44: Global High Purity Quartz Market Volume K Tons Forecast, by Application 2020 & 2033
- Table 45: Global High Purity Quartz Market Revenue Million Forecast, by Country 2020 & 2033
- Table 46: Global High Purity Quartz Market Volume K Tons Forecast, by Country 2020 & 2033
- Table 47: Brazil High Purity Quartz Market Revenue (Million) Forecast, by Application 2020 & 2033
- Table 48: Brazil High Purity Quartz Market Volume (K Tons) Forecast, by Application 2020 & 2033
- Table 49: Argentina High Purity Quartz Market Revenue (Million) Forecast, by Application 2020 & 2033
- Table 50: Argentina High Purity Quartz Market Volume (K Tons) Forecast, by Application 2020 & 2033
- Table 51: Rest of South America High Purity Quartz Market Revenue (Million) Forecast, by Application 2020 & 2033
- Table 52: Rest of South America High Purity Quartz Market Volume (K Tons) Forecast, by Application 2020 & 2033
- Table 53: Global High Purity Quartz Market Revenue Million Forecast, by Application 2020 & 2033
- Table 54: Global High Purity Quartz Market Volume K Tons Forecast, by Application 2020 & 2033
- Table 55: Global High Purity Quartz Market Revenue Million Forecast, by Country 2020 & 2033
- Table 56: Global High Purity Quartz Market Volume K Tons Forecast, by Country 2020 & 2033
- Table 57: Saudi Arabia High Purity Quartz Market Revenue (Million) Forecast, by Application 2020 & 2033
- Table 58: Saudi Arabia High Purity Quartz Market Volume (K Tons) Forecast, by Application 2020 & 2033
- Table 59: South Africa High Purity Quartz Market Revenue (Million) Forecast, by Application 2020 & 2033
- Table 60: South Africa High Purity Quartz Market Volume (K Tons) Forecast, by Application 2020 & 2033
- Table 61: Rest of Middle East and Africa High Purity Quartz Market Revenue (Million) Forecast, by Application 2020 & 2033
- Table 62: Rest of Middle East and Africa High Purity Quartz Market Volume (K Tons) Forecast, by Application 2020 & 2033
Frequently Asked Questions
1. What is the projected Compound Annual Growth Rate (CAGR) of the High Purity Quartz Market?
The projected CAGR is approximately > 4.50%.
2. Which companies are prominent players in the High Purity Quartz Market?
Key companies in the market include Jiangsu Pacific Quartz Co Ltd, American Elements, Covia Holdings LLC, Momentive Technologies, Sibelco, Imerys, ULTRA HPQ, Russian Quartz LLC, Australian Silica Quartz Group Ltd, The Quartz Corp.
3. What are the main segments of the High Purity Quartz Market?
The market segments include Application.
4. Can you provide details about the market size?
The market size is estimated to be USD 672.93 Million as of 2022.
5. What are some drivers contributing to market growth?
Growing Demand for Semiconductor ICs; Increasing Adoption in Solar Industry; Other Drivers.
6. What are the notable trends driving market growth?
Growing Demand from Semiconductor Industry.
7. Are there any restraints impacting market growth?
The Fluctuating Prices of Raw Materials; Other Restraints.
8. Can you provide examples of recent developments in the market?
April 2023: Sibelco announced an investment of approx. USD 200 million to double high purity quartz (HPQ) installed capacity at its Spruce Pine facility in North Carolina, United States.
9. What pricing options are available for accessing the report?
Pricing options include single-user, multi-user, and enterprise licenses priced at USD 4750, USD 5250, and USD 8750 respectively.
10. Is the market size provided in terms of value or volume?
The market size is provided in terms of value, measured in Million and volume, measured in K Tons.
11. Are there any specific market keywords associated with the report?
Yes, the market keyword associated with the report is "High Purity Quartz Market," which aids in identifying and referencing the specific market segment covered.
12. How do I determine which pricing option suits my needs best?
The pricing options vary based on user requirements and access needs. Individual users may opt for single-user licenses, while businesses requiring broader access may choose multi-user or enterprise licenses for cost-effective access to the report.
13. Are there any additional resources or data provided in the High Purity Quartz Market report?
While the report offers comprehensive insights, it's advisable to review the specific contents or supplementary materials provided to ascertain if additional resources or data are available.
14. How can I stay updated on further developments or reports in the High Purity Quartz Market?
To stay informed about further developments, trends, and reports in the High Purity Quartz Market, consider subscribing to industry newsletters, following relevant companies and organizations, or regularly checking reputable industry news sources and publications.
Methodology
Step 1 - Identification of Relevant Samples Size from Population Database


Step 2 - Approaches for Defining Global Market Size (Value, Volume* & Price*)

Note*: In applicable scenarios
Step 3 - Data Sources
Primary Research
- Web Analytics
- Survey Reports
- Research Institute
- Latest Research Reports
- Opinion Leaders
Secondary Research
- Annual Reports
- White Paper
- Latest Press Release
- Industry Association
- Paid Database
- Investor Presentations

Step 4 - Data Triangulation
Involves using different sources of information in order to increase the validity of a study
These sources are likely to be stakeholders in a program - participants, other researchers, program staff, other community members, and so on.
Then we put all data in single framework & apply various statistical tools to find out the dynamic on the market.
During the analysis stage, feedback from the stakeholder groups would be compared to determine areas of agreement as well as areas of divergence