

Key Insights
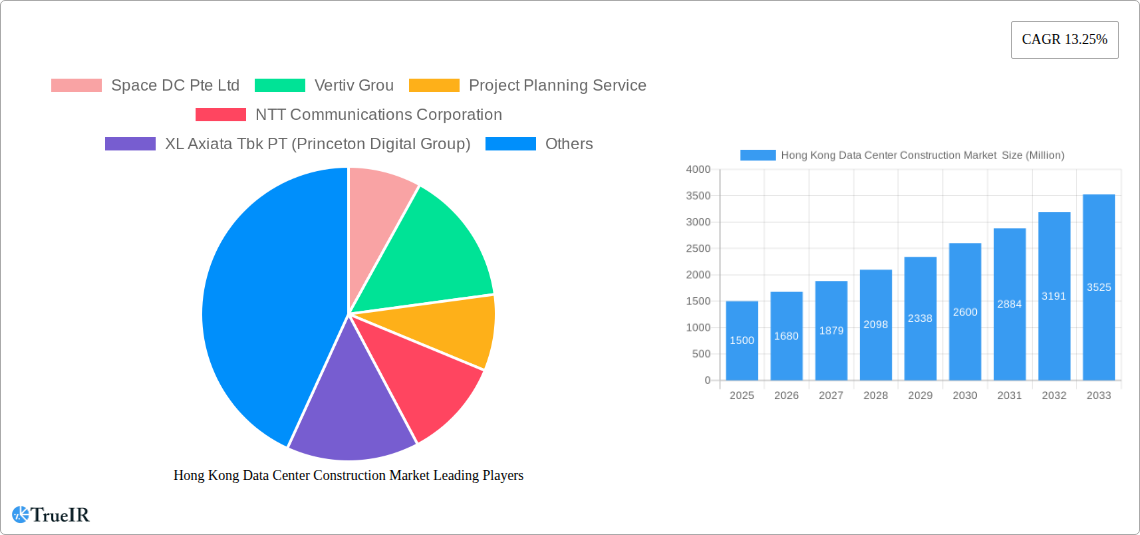
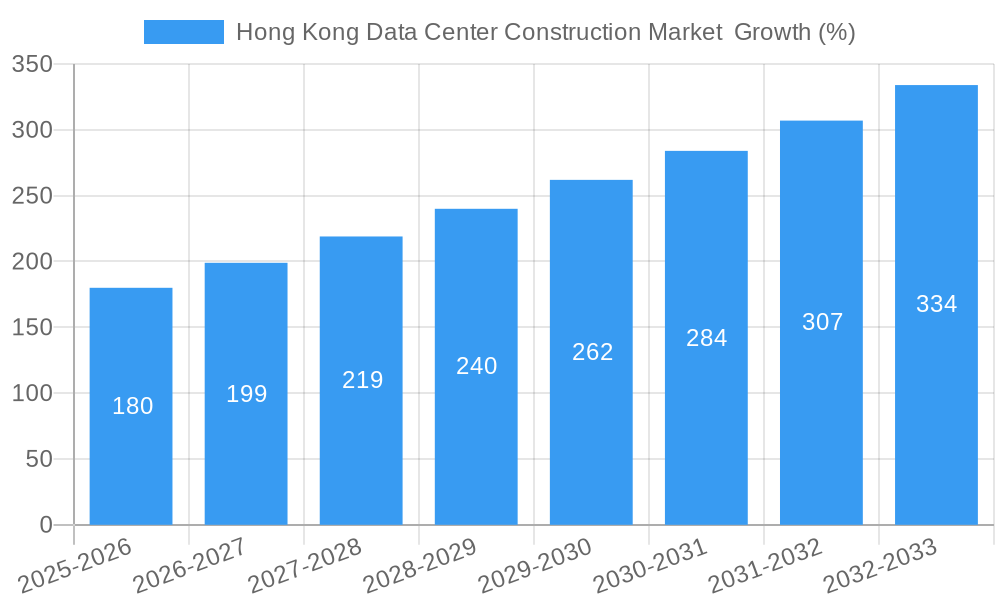
The Hong Kong data center construction market is experiencing robust growth, driven by the burgeoning IT and telecommunication sector, the increasing adoption of cloud computing, and the government's initiatives to foster digital transformation. A compound annual growth rate (CAGR) of 13.25% from 2019 to 2024 suggests a significant market expansion. This growth is fueled by demand from various end-users, including IT & Telecommunication, BFSI (Banking, Financial Services, and Insurance), Government, and Healthcare sectors. The market is segmented by infrastructure types (cooling, power distribution, security), end-user verticals, and data center tier and size classifications (from small to massive). Key players like Vertiv Group, NTT Communications Corporation, and Schneider Electric are actively shaping the market landscape through their offerings in design, construction, and infrastructure provision. The prevalence of hyperscale data centers and the need for high-availability infrastructure are major factors contributing to the market’s expansion. Further growth is anticipated due to increasing digitalization across all sectors, resulting in a higher demand for secure and reliable data storage and processing capabilities in Hong Kong.
The forecast period (2025-2033) promises continued expansion, although the exact market size requires more precise data. Considering the 13.25% CAGR from 2019-2024 and accounting for potential market saturation, a conservative projection for the next few years would show a gradual decrease in the CAGR, perhaps settling around 10-12% annually. This reflects the reality of reaching a maturity stage while still experiencing strong, albeit slightly moderated, growth. This continued growth will likely be driven by factors such as the increasing adoption of 5G technology, the growth of edge computing, and the ongoing need for improved data center efficiency and sustainability. The market's segmentation provides opportunities for specialized service providers catering to different needs across various tiers and sizes of data centers.
Hong Kong Data Center Construction Market: A Comprehensive Report (2019-2033)
This dynamic report provides a comprehensive analysis of the Hong Kong data center construction market, offering invaluable insights for investors, industry professionals, and strategic decision-makers. Leveraging extensive research and data analysis from the historical period (2019-2024), base year (2025), and forecast period (2025-2033), this report illuminates the market's structure, trends, key players, and future outlook. The report forecasts a market valued at xx Million by 2033, showcasing significant growth potential.
Hong Kong Data Center Construction Market Market Structure & Competitive Landscape
The Hong Kong data center construction market exhibits a moderately concentrated structure, with several key players dominating various segments. The market concentration ratio (CR4) is estimated at xx%, indicating a competitive yet consolidated landscape. Innovation is a crucial driver, with companies constantly striving to offer advanced cooling solutions (e.g., evaporative cooling), efficient power infrastructure (including Power Distribution Units – PDUs), and robust physical security measures. Regulatory changes, particularly those concerning data privacy and security, significantly impact market dynamics. Product substitution is minimal, with the focus primarily on improving existing technologies rather than completely replacing them.
The end-user segmentation is diverse, encompassing IT & Telecommunication, BFSI (Banking, Financial Services, and Insurance), Government, Healthcare, and other sectors. Mergers and acquisitions (M&A) activity has been moderate in recent years, with xx M&A deals recorded between 2019 and 2024, primarily focused on consolidating market share and expanding service offerings. Key M&A trends include the acquisition of smaller specialized firms by larger players to bolster their technological capabilities and service portfolios.
Hong Kong Data Center Construction Market Market Trends & Opportunities
The Hong Kong data center construction market is experiencing robust growth, driven by the increasing demand for data storage and processing capabilities. The market size is projected to reach xx Million in 2025 and xx Million by 2033, exhibiting a Compound Annual Growth Rate (CAGR) of xx% during the forecast period. Technological advancements, such as the adoption of AI and IoT, are significantly impacting the market, driving demand for larger, more efficient data centers. Consumer preferences are shifting towards enhanced data security and sustainability, leading to increased adoption of green technologies and energy-efficient infrastructure. Competitive dynamics are characterized by intense rivalry, particularly among providers of power infrastructure and cooling solutions, leading to price competitiveness and innovation. Market penetration rates for advanced technologies, like liquid cooling, are steadily increasing, reflecting a growing focus on operational efficiency and cost optimization.
Dominant Markets & Segments in Hong Kong Data Center Construction Market
The Hong Kong data center construction market displays significant growth across various segments.
Leading Segments: The IT & Telecommunication sector is the dominant end-user, accounting for xx% of the market share in 2025. Within infrastructure, Cooling Infrastructure and Power Infrastructure are the leading segments, driving significant investment. Large and Mega data centers are gaining traction, reflecting the rising demand for substantial data storage capacity.
Key Growth Drivers:
- Government Initiatives: Government support for digital transformation and initiatives promoting technological innovation are major catalysts.
- Robust Economic Growth: Hong Kong's thriving economy fuels the demand for robust data infrastructure to support its burgeoning financial and business sectors.
- Technological Advancements: The increasing adoption of cloud computing, big data analytics, and AI applications necessitate advanced data center infrastructure.
The dominance of the IT & Telecommunication sector is attributed to its high data consumption and reliance on sophisticated data center facilities. The preference for large and mega data centers reflects the need for scalability and operational efficiency.
Hong Kong Data Center Construction Market Product Analysis
The market is witnessing significant product innovations, particularly in cooling technologies (e.g., liquid cooling, free-cooling systems) and power distribution systems (e.g., modular PDUs). These advancements enhance efficiency, reduce operational costs, and improve data center sustainability. The focus is on modular and scalable designs to accommodate future growth and changing business needs. Competitive advantages stem from offering comprehensive solutions, energy-efficient designs, and superior reliability. The market demonstrates a strong fit for innovative products that address the escalating demand for energy efficiency and operational resilience.
Key Drivers, Barriers & Challenges in Hong Kong Data Center Construction Market
Key Drivers: The market's growth is primarily propelled by increasing data consumption fueled by digital transformation across industries, government support for technological advancement, and the rise of cloud computing and big data analytics.
Challenges: Challenges include the limited availability of suitable land for data center construction, stringent regulatory compliance requirements (e.g., data privacy and security), and escalating energy costs, potentially impacting project profitability by approximately xx%. Supply chain disruptions and the competition for skilled labor also pose significant challenges.
Growth Drivers in the Hong Kong Data Center Construction Market Market
The Hong Kong data center construction market is driven by increasing digitalization across various sectors, government investments in infrastructure development, and the growing adoption of cloud-based services. The rising demand for data storage and processing capabilities, coupled with advancements in data center technologies, further contributes to the market expansion. Favorable government policies promoting digital transformation and technological innovation act as additional growth catalysts.
Challenges Impacting Hong Kong Data Center Construction Market Growth
Challenges impacting the market include limited land availability for data center development, stringent regulatory compliance requirements, and potential energy cost increases. Supply chain vulnerabilities and skilled labor shortages also present obstacles. These factors can significantly increase project costs and timelines, impacting overall market growth.
Key Players Shaping the Hong Kong Data Center Construction Market Market
- Space DC Pte Ltd
- Vertiv Group
- Project Planning Service
- NTT Communications Corporation
- XL Axiata Tbk PT (Princeton Digital Group)
- Telkomsigma
- GTN Data Center
- BYME Engineering
- Arup Group
- Lintasarta
- Biznet Networks
- JupiterDC
- PT Faasri Utama Sakti
- Aurecon
- Schneider Electric
- Gulf Energy Development Public Company Limited
- Mitsubishi Electric
- Indosat Tbk PT
Significant Hong Kong Data Center Construction Market Industry Milestones
- November 2022: Space DC Pte Ltd announced the opening of its new regional office in Kowloon, Hong Kong, strengthening its Asia-Pacific presence and capabilities in engineering, construction, and sales.
- November 2022: The launch of BDx Indonesia, a USD 300 million joint venture between PT Indosat Tbk, PT Aplikanusa Lintasarta, and Big Data Exchange (BDx), signifies significant investment and expansion in the Southeast Asian data center market.
Future Outlook for Hong Kong Data Center Construction Market Market
The Hong Kong data center construction market is poised for continued growth, driven by ongoing digital transformation, robust economic expansion, and increasing investment in advanced data center technologies. Strategic opportunities exist for companies specializing in sustainable and energy-efficient solutions. The market's potential is significant, with substantial growth projected over the forecast period, driven by the region's expanding technological landscape and supportive government policies.
Hong Kong Data Center Construction Market Segmentation
-
1. Tier Type
- 1.1. Tier 1 and 2
- 1.2. Tier 3
- 1.3. Tier 4
-
2. Data Center Size
- 2.1. Small
- 2.2. Medium
- 2.3. Large
- 2.4. Mega
- 2.5. Massive
-
3. Infrastructure
-
3.1. Cooling Infrastructure
- 3.1.1. Air-based Cooling
- 3.1.2. Liquid-based Cooling
- 3.1.3. Evaporative Cooling
-
3.2. Power Infrastructure
- 3.2.1. UPS Systems
- 3.2.2. Generators
- 3.2.3. Power Distribution Unit (PDU)
- 3.3. Racks and Cabinets
- 3.4. Servers
- 3.5. Networking Equipment
- 3.6. Physical Security Infrastructure
- 3.7. Design and Consulting Services
- 3.8. Other Infrastructure
-
3.1. Cooling Infrastructure
-
4. End-User
- 4.1. IT & Telecommunication
- 4.2. BFSI
- 4.3. Government
- 4.4. Healthcare
- 4.5. Other End User
Hong Kong Data Center Construction Market Segmentation By Geography
-
1. North America
- 1.1. United States
- 1.2. Canada
- 1.3. Mexico
-
2. South America
- 2.1. Brazil
- 2.2. Argentina
- 2.3. Rest of South America
-
3. Europe
- 3.1. United Kingdom
- 3.2. Germany
- 3.3. France
- 3.4. Italy
- 3.5. Spain
- 3.6. Russia
- 3.7. Benelux
- 3.8. Nordics
- 3.9. Rest of Europe
-
4. Middle East & Africa
- 4.1. Turkey
- 4.2. Israel
- 4.3. GCC
- 4.4. North Africa
- 4.5. South Africa
- 4.6. Rest of Middle East & Africa
-
5. Asia Pacific
- 5.1. China
- 5.2. India
- 5.3. Japan
- 5.4. South Korea
- 5.5. ASEAN
- 5.6. Oceania
- 5.7. Rest of Asia Pacific
Hong Kong Data Center Construction Market REPORT HIGHLIGHTS
| Aspects | Details |
|---|---|
| Study Period | 2019-2033 |
| Base Year | 2024 |
| Estimated Year | 2025 |
| Forecast Period | 2025-2033 |
| Historical Period | 2019-2024 |
| Growth Rate | CAGR of 13.25% from 2019-2033 |
| Segmentation |
|
Table of Contents
- 1. Introduction
- 1.1. Research Scope
- 1.2. Market Segmentation
- 1.3. Research Methodology
- 1.4. Definitions and Assumptions
- 2. Executive Summary
- 2.1. Introduction
- 3. Market Dynamics
- 3.1. Introduction
- 3.2. Market Drivers
- 3.2.1. Major Initiatives Undertaken by Governments to Promote Digital Economy and Connectivity Infrastructure; Rising Adoption of Hyperscale Data Centers
- 3.3. Market Restrains
- 3.3.1 Environmental
- 3.3.2 Cost
- 3.3.3 and Workforce-related Challenges
- 3.4. Market Trends
- 3.4.1. IT and Telcom Segment is Expected to Gain Significant Market Share
- 4. Market Factor Analysis
- 4.1. Porters Five Forces
- 4.2. Supply/Value Chain
- 4.3. PESTEL analysis
- 4.4. Market Entropy
- 4.5. Patent/Trademark Analysis
- 5. Global Hong Kong Data Center Construction Market Analysis, Insights and Forecast, 2019-2031
- 5.1. Market Analysis, Insights and Forecast - by Tier Type
- 5.1.1. Tier 1 and 2
- 5.1.2. Tier 3
- 5.1.3. Tier 4
- 5.2. Market Analysis, Insights and Forecast - by Data Center Size
- 5.2.1. Small
- 5.2.2. Medium
- 5.2.3. Large
- 5.2.4. Mega
- 5.2.5. Massive
- 5.3. Market Analysis, Insights and Forecast - by Infrastructure
- 5.3.1. Cooling Infrastructure
- 5.3.1.1. Air-based Cooling
- 5.3.1.2. Liquid-based Cooling
- 5.3.1.3. Evaporative Cooling
- 5.3.2. Power Infrastructure
- 5.3.2.1. UPS Systems
- 5.3.2.2. Generators
- 5.3.2.3. Power Distribution Unit (PDU)
- 5.3.3. Racks and Cabinets
- 5.3.4. Servers
- 5.3.5. Networking Equipment
- 5.3.6. Physical Security Infrastructure
- 5.3.7. Design and Consulting Services
- 5.3.8. Other Infrastructure
- 5.3.1. Cooling Infrastructure
- 5.4. Market Analysis, Insights and Forecast - by End-User
- 5.4.1. IT & Telecommunication
- 5.4.2. BFSI
- 5.4.3. Government
- 5.4.4. Healthcare
- 5.4.5. Other End User
- 5.5. Market Analysis, Insights and Forecast - by Region
- 5.5.1. North America
- 5.5.2. South America
- 5.5.3. Europe
- 5.5.4. Middle East & Africa
- 5.5.5. Asia Pacific
- 5.1. Market Analysis, Insights and Forecast - by Tier Type
- 6. North America Hong Kong Data Center Construction Market Analysis, Insights and Forecast, 2019-2031
- 6.1. Market Analysis, Insights and Forecast - by Tier Type
- 6.1.1. Tier 1 and 2
- 6.1.2. Tier 3
- 6.1.3. Tier 4
- 6.2. Market Analysis, Insights and Forecast - by Data Center Size
- 6.2.1. Small
- 6.2.2. Medium
- 6.2.3. Large
- 6.2.4. Mega
- 6.2.5. Massive
- 6.3. Market Analysis, Insights and Forecast - by Infrastructure
- 6.3.1. Cooling Infrastructure
- 6.3.1.1. Air-based Cooling
- 6.3.1.2. Liquid-based Cooling
- 6.3.1.3. Evaporative Cooling
- 6.3.2. Power Infrastructure
- 6.3.2.1. UPS Systems
- 6.3.2.2. Generators
- 6.3.2.3. Power Distribution Unit (PDU)
- 6.3.3. Racks and Cabinets
- 6.3.4. Servers
- 6.3.5. Networking Equipment
- 6.3.6. Physical Security Infrastructure
- 6.3.7. Design and Consulting Services
- 6.3.8. Other Infrastructure
- 6.3.1. Cooling Infrastructure
- 6.4. Market Analysis, Insights and Forecast - by End-User
- 6.4.1. IT & Telecommunication
- 6.4.2. BFSI
- 6.4.3. Government
- 6.4.4. Healthcare
- 6.4.5. Other End User
- 6.1. Market Analysis, Insights and Forecast - by Tier Type
- 7. South America Hong Kong Data Center Construction Market Analysis, Insights and Forecast, 2019-2031
- 7.1. Market Analysis, Insights and Forecast - by Tier Type
- 7.1.1. Tier 1 and 2
- 7.1.2. Tier 3
- 7.1.3. Tier 4
- 7.2. Market Analysis, Insights and Forecast - by Data Center Size
- 7.2.1. Small
- 7.2.2. Medium
- 7.2.3. Large
- 7.2.4. Mega
- 7.2.5. Massive
- 7.3. Market Analysis, Insights and Forecast - by Infrastructure
- 7.3.1. Cooling Infrastructure
- 7.3.1.1. Air-based Cooling
- 7.3.1.2. Liquid-based Cooling
- 7.3.1.3. Evaporative Cooling
- 7.3.2. Power Infrastructure
- 7.3.2.1. UPS Systems
- 7.3.2.2. Generators
- 7.3.2.3. Power Distribution Unit (PDU)
- 7.3.3. Racks and Cabinets
- 7.3.4. Servers
- 7.3.5. Networking Equipment
- 7.3.6. Physical Security Infrastructure
- 7.3.7. Design and Consulting Services
- 7.3.8. Other Infrastructure
- 7.3.1. Cooling Infrastructure
- 7.4. Market Analysis, Insights and Forecast - by End-User
- 7.4.1. IT & Telecommunication
- 7.4.2. BFSI
- 7.4.3. Government
- 7.4.4. Healthcare
- 7.4.5. Other End User
- 7.1. Market Analysis, Insights and Forecast - by Tier Type
- 8. Europe Hong Kong Data Center Construction Market Analysis, Insights and Forecast, 2019-2031
- 8.1. Market Analysis, Insights and Forecast - by Tier Type
- 8.1.1. Tier 1 and 2
- 8.1.2. Tier 3
- 8.1.3. Tier 4
- 8.2. Market Analysis, Insights and Forecast - by Data Center Size
- 8.2.1. Small
- 8.2.2. Medium
- 8.2.3. Large
- 8.2.4. Mega
- 8.2.5. Massive
- 8.3. Market Analysis, Insights and Forecast - by Infrastructure
- 8.3.1. Cooling Infrastructure
- 8.3.1.1. Air-based Cooling
- 8.3.1.2. Liquid-based Cooling
- 8.3.1.3. Evaporative Cooling
- 8.3.2. Power Infrastructure
- 8.3.2.1. UPS Systems
- 8.3.2.2. Generators
- 8.3.2.3. Power Distribution Unit (PDU)
- 8.3.3. Racks and Cabinets
- 8.3.4. Servers
- 8.3.5. Networking Equipment
- 8.3.6. Physical Security Infrastructure
- 8.3.7. Design and Consulting Services
- 8.3.8. Other Infrastructure
- 8.3.1. Cooling Infrastructure
- 8.4. Market Analysis, Insights and Forecast - by End-User
- 8.4.1. IT & Telecommunication
- 8.4.2. BFSI
- 8.4.3. Government
- 8.4.4. Healthcare
- 8.4.5. Other End User
- 8.1. Market Analysis, Insights and Forecast - by Tier Type
- 9. Middle East & Africa Hong Kong Data Center Construction Market Analysis, Insights and Forecast, 2019-2031
- 9.1. Market Analysis, Insights and Forecast - by Tier Type
- 9.1.1. Tier 1 and 2
- 9.1.2. Tier 3
- 9.1.3. Tier 4
- 9.2. Market Analysis, Insights and Forecast - by Data Center Size
- 9.2.1. Small
- 9.2.2. Medium
- 9.2.3. Large
- 9.2.4. Mega
- 9.2.5. Massive
- 9.3. Market Analysis, Insights and Forecast - by Infrastructure
- 9.3.1. Cooling Infrastructure
- 9.3.1.1. Air-based Cooling
- 9.3.1.2. Liquid-based Cooling
- 9.3.1.3. Evaporative Cooling
- 9.3.2. Power Infrastructure
- 9.3.2.1. UPS Systems
- 9.3.2.2. Generators
- 9.3.2.3. Power Distribution Unit (PDU)
- 9.3.3. Racks and Cabinets
- 9.3.4. Servers
- 9.3.5. Networking Equipment
- 9.3.6. Physical Security Infrastructure
- 9.3.7. Design and Consulting Services
- 9.3.8. Other Infrastructure
- 9.3.1. Cooling Infrastructure
- 9.4. Market Analysis, Insights and Forecast - by End-User
- 9.4.1. IT & Telecommunication
- 9.4.2. BFSI
- 9.4.3. Government
- 9.4.4. Healthcare
- 9.4.5. Other End User
- 9.1. Market Analysis, Insights and Forecast - by Tier Type
- 10. Asia Pacific Hong Kong Data Center Construction Market Analysis, Insights and Forecast, 2019-2031
- 10.1. Market Analysis, Insights and Forecast - by Tier Type
- 10.1.1. Tier 1 and 2
- 10.1.2. Tier 3
- 10.1.3. Tier 4
- 10.2. Market Analysis, Insights and Forecast - by Data Center Size
- 10.2.1. Small
- 10.2.2. Medium
- 10.2.3. Large
- 10.2.4. Mega
- 10.2.5. Massive
- 10.3. Market Analysis, Insights and Forecast - by Infrastructure
- 10.3.1. Cooling Infrastructure
- 10.3.1.1. Air-based Cooling
- 10.3.1.2. Liquid-based Cooling
- 10.3.1.3. Evaporative Cooling
- 10.3.2. Power Infrastructure
- 10.3.2.1. UPS Systems
- 10.3.2.2. Generators
- 10.3.2.3. Power Distribution Unit (PDU)
- 10.3.3. Racks and Cabinets
- 10.3.4. Servers
- 10.3.5. Networking Equipment
- 10.3.6. Physical Security Infrastructure
- 10.3.7. Design and Consulting Services
- 10.3.8. Other Infrastructure
- 10.3.1. Cooling Infrastructure
- 10.4. Market Analysis, Insights and Forecast - by End-User
- 10.4.1. IT & Telecommunication
- 10.4.2. BFSI
- 10.4.3. Government
- 10.4.4. Healthcare
- 10.4.5. Other End User
- 10.1. Market Analysis, Insights and Forecast - by Tier Type
- 11. Competitive Analysis
- 11.1. Global Market Share Analysis 2024
- 11.2. Company Profiles
- 11.2.1 Space DC Pte Ltd
- 11.2.1.1. Overview
- 11.2.1.2. Products
- 11.2.1.3. SWOT Analysis
- 11.2.1.4. Recent Developments
- 11.2.1.5. Financials (Based on Availability)
- 11.2.2 Vertiv Grou
- 11.2.2.1. Overview
- 11.2.2.2. Products
- 11.2.2.3. SWOT Analysis
- 11.2.2.4. Recent Developments
- 11.2.2.5. Financials (Based on Availability)
- 11.2.3 Project Planning Service
- 11.2.3.1. Overview
- 11.2.3.2. Products
- 11.2.3.3. SWOT Analysis
- 11.2.3.4. Recent Developments
- 11.2.3.5. Financials (Based on Availability)
- 11.2.4 NTT Communications Corporation
- 11.2.4.1. Overview
- 11.2.4.2. Products
- 11.2.4.3. SWOT Analysis
- 11.2.4.4. Recent Developments
- 11.2.4.5. Financials (Based on Availability)
- 11.2.5 XL Axiata Tbk PT (Princeton Digital Group)
- 11.2.5.1. Overview
- 11.2.5.2. Products
- 11.2.5.3. SWOT Analysis
- 11.2.5.4. Recent Developments
- 11.2.5.5. Financials (Based on Availability)
- 11.2.6 Telkomsigma
- 11.2.6.1. Overview
- 11.2.6.2. Products
- 11.2.6.3. SWOT Analysis
- 11.2.6.4. Recent Developments
- 11.2.6.5. Financials (Based on Availability)
- 11.2.7 GTN Data Center
- 11.2.7.1. Overview
- 11.2.7.2. Products
- 11.2.7.3. SWOT Analysis
- 11.2.7.4. Recent Developments
- 11.2.7.5. Financials (Based on Availability)
- 11.2.8 BYME Engineering
- 11.2.8.1. Overview
- 11.2.8.2. Products
- 11.2.8.3. SWOT Analysis
- 11.2.8.4. Recent Developments
- 11.2.8.5. Financials (Based on Availability)
- 11.2.9 Arup Group
- 11.2.9.1. Overview
- 11.2.9.2. Products
- 11.2.9.3. SWOT Analysis
- 11.2.9.4. Recent Developments
- 11.2.9.5. Financials (Based on Availability)
- 11.2.10 Lintasarta
- 11.2.10.1. Overview
- 11.2.10.2. Products
- 11.2.10.3. SWOT Analysis
- 11.2.10.4. Recent Developments
- 11.2.10.5. Financials (Based on Availability)
- 11.2.11 Biznet Networks
- 11.2.11.1. Overview
- 11.2.11.2. Products
- 11.2.11.3. SWOT Analysis
- 11.2.11.4. Recent Developments
- 11.2.11.5. Financials (Based on Availability)
- 11.2.12 JupiterDC
- 11.2.12.1. Overview
- 11.2.12.2. Products
- 11.2.12.3. SWOT Analysis
- 11.2.12.4. Recent Developments
- 11.2.12.5. Financials (Based on Availability)
- 11.2.13 PT Faasri Utama Sakti
- 11.2.13.1. Overview
- 11.2.13.2. Products
- 11.2.13.3. SWOT Analysis
- 11.2.13.4. Recent Developments
- 11.2.13.5. Financials (Based on Availability)
- 11.2.14 Aurecon
- 11.2.14.1. Overview
- 11.2.14.2. Products
- 11.2.14.3. SWOT Analysis
- 11.2.14.4. Recent Developments
- 11.2.14.5. Financials (Based on Availability)
- 11.2.15 Schneider Electric
- 11.2.15.1. Overview
- 11.2.15.2. Products
- 11.2.15.3. SWOT Analysis
- 11.2.15.4. Recent Developments
- 11.2.15.5. Financials (Based on Availability)
- 11.2.16 Gulf Energy Development Public Company Limited
- 11.2.16.1. Overview
- 11.2.16.2. Products
- 11.2.16.3. SWOT Analysis
- 11.2.16.4. Recent Developments
- 11.2.16.5. Financials (Based on Availability)
- 11.2.17 Mitsubishi Electric
- 11.2.17.1. Overview
- 11.2.17.2. Products
- 11.2.17.3. SWOT Analysis
- 11.2.17.4. Recent Developments
- 11.2.17.5. Financials (Based on Availability)
- 11.2.18 Indosat Tbk PT
- 11.2.18.1. Overview
- 11.2.18.2. Products
- 11.2.18.3. SWOT Analysis
- 11.2.18.4. Recent Developments
- 11.2.18.5. Financials (Based on Availability)
- 11.2.1 Space DC Pte Ltd
List of Figures
- Figure 1: Global Hong Kong Data Center Construction Market Revenue Breakdown (Million, %) by Region 2024 & 2032
- Figure 2: Hong Kong Hong Kong Data Center Construction Market Revenue (Million), by Country 2024 & 2032
- Figure 3: Hong Kong Hong Kong Data Center Construction Market Revenue Share (%), by Country 2024 & 2032
- Figure 4: North America Hong Kong Data Center Construction Market Revenue (Million), by Tier Type 2024 & 2032
- Figure 5: North America Hong Kong Data Center Construction Market Revenue Share (%), by Tier Type 2024 & 2032
- Figure 6: North America Hong Kong Data Center Construction Market Revenue (Million), by Data Center Size 2024 & 2032
- Figure 7: North America Hong Kong Data Center Construction Market Revenue Share (%), by Data Center Size 2024 & 2032
- Figure 8: North America Hong Kong Data Center Construction Market Revenue (Million), by Infrastructure 2024 & 2032
- Figure 9: North America Hong Kong Data Center Construction Market Revenue Share (%), by Infrastructure 2024 & 2032
- Figure 10: North America Hong Kong Data Center Construction Market Revenue (Million), by End-User 2024 & 2032
- Figure 11: North America Hong Kong Data Center Construction Market Revenue Share (%), by End-User 2024 & 2032
- Figure 12: North America Hong Kong Data Center Construction Market Revenue (Million), by Country 2024 & 2032
- Figure 13: North America Hong Kong Data Center Construction Market Revenue Share (%), by Country 2024 & 2032
- Figure 14: South America Hong Kong Data Center Construction Market Revenue (Million), by Tier Type 2024 & 2032
- Figure 15: South America Hong Kong Data Center Construction Market Revenue Share (%), by Tier Type 2024 & 2032
- Figure 16: South America Hong Kong Data Center Construction Market Revenue (Million), by Data Center Size 2024 & 2032
- Figure 17: South America Hong Kong Data Center Construction Market Revenue Share (%), by Data Center Size 2024 & 2032
- Figure 18: South America Hong Kong Data Center Construction Market Revenue (Million), by Infrastructure 2024 & 2032
- Figure 19: South America Hong Kong Data Center Construction Market Revenue Share (%), by Infrastructure 2024 & 2032
- Figure 20: South America Hong Kong Data Center Construction Market Revenue (Million), by End-User 2024 & 2032
- Figure 21: South America Hong Kong Data Center Construction Market Revenue Share (%), by End-User 2024 & 2032
- Figure 22: South America Hong Kong Data Center Construction Market Revenue (Million), by Country 2024 & 2032
- Figure 23: South America Hong Kong Data Center Construction Market Revenue Share (%), by Country 2024 & 2032
- Figure 24: Europe Hong Kong Data Center Construction Market Revenue (Million), by Tier Type 2024 & 2032
- Figure 25: Europe Hong Kong Data Center Construction Market Revenue Share (%), by Tier Type 2024 & 2032
- Figure 26: Europe Hong Kong Data Center Construction Market Revenue (Million), by Data Center Size 2024 & 2032
- Figure 27: Europe Hong Kong Data Center Construction Market Revenue Share (%), by Data Center Size 2024 & 2032
- Figure 28: Europe Hong Kong Data Center Construction Market Revenue (Million), by Infrastructure 2024 & 2032
- Figure 29: Europe Hong Kong Data Center Construction Market Revenue Share (%), by Infrastructure 2024 & 2032
- Figure 30: Europe Hong Kong Data Center Construction Market Revenue (Million), by End-User 2024 & 2032
- Figure 31: Europe Hong Kong Data Center Construction Market Revenue Share (%), by End-User 2024 & 2032
- Figure 32: Europe Hong Kong Data Center Construction Market Revenue (Million), by Country 2024 & 2032
- Figure 33: Europe Hong Kong Data Center Construction Market Revenue Share (%), by Country 2024 & 2032
- Figure 34: Middle East & Africa Hong Kong Data Center Construction Market Revenue (Million), by Tier Type 2024 & 2032
- Figure 35: Middle East & Africa Hong Kong Data Center Construction Market Revenue Share (%), by Tier Type 2024 & 2032
- Figure 36: Middle East & Africa Hong Kong Data Center Construction Market Revenue (Million), by Data Center Size 2024 & 2032
- Figure 37: Middle East & Africa Hong Kong Data Center Construction Market Revenue Share (%), by Data Center Size 2024 & 2032
- Figure 38: Middle East & Africa Hong Kong Data Center Construction Market Revenue (Million), by Infrastructure 2024 & 2032
- Figure 39: Middle East & Africa Hong Kong Data Center Construction Market Revenue Share (%), by Infrastructure 2024 & 2032
- Figure 40: Middle East & Africa Hong Kong Data Center Construction Market Revenue (Million), by End-User 2024 & 2032
- Figure 41: Middle East & Africa Hong Kong Data Center Construction Market Revenue Share (%), by End-User 2024 & 2032
- Figure 42: Middle East & Africa Hong Kong Data Center Construction Market Revenue (Million), by Country 2024 & 2032
- Figure 43: Middle East & Africa Hong Kong Data Center Construction Market Revenue Share (%), by Country 2024 & 2032
- Figure 44: Asia Pacific Hong Kong Data Center Construction Market Revenue (Million), by Tier Type 2024 & 2032
- Figure 45: Asia Pacific Hong Kong Data Center Construction Market Revenue Share (%), by Tier Type 2024 & 2032
- Figure 46: Asia Pacific Hong Kong Data Center Construction Market Revenue (Million), by Data Center Size 2024 & 2032
- Figure 47: Asia Pacific Hong Kong Data Center Construction Market Revenue Share (%), by Data Center Size 2024 & 2032
- Figure 48: Asia Pacific Hong Kong Data Center Construction Market Revenue (Million), by Infrastructure 2024 & 2032
- Figure 49: Asia Pacific Hong Kong Data Center Construction Market Revenue Share (%), by Infrastructure 2024 & 2032
- Figure 50: Asia Pacific Hong Kong Data Center Construction Market Revenue (Million), by End-User 2024 & 2032
- Figure 51: Asia Pacific Hong Kong Data Center Construction Market Revenue Share (%), by End-User 2024 & 2032
- Figure 52: Asia Pacific Hong Kong Data Center Construction Market Revenue (Million), by Country 2024 & 2032
- Figure 53: Asia Pacific Hong Kong Data Center Construction Market Revenue Share (%), by Country 2024 & 2032
List of Tables
- Table 1: Global Hong Kong Data Center Construction Market Revenue Million Forecast, by Region 2019 & 2032
- Table 2: Global Hong Kong Data Center Construction Market Revenue Million Forecast, by Tier Type 2019 & 2032
- Table 3: Global Hong Kong Data Center Construction Market Revenue Million Forecast, by Data Center Size 2019 & 2032
- Table 4: Global Hong Kong Data Center Construction Market Revenue Million Forecast, by Infrastructure 2019 & 2032
- Table 5: Global Hong Kong Data Center Construction Market Revenue Million Forecast, by End-User 2019 & 2032
- Table 6: Global Hong Kong Data Center Construction Market Revenue Million Forecast, by Region 2019 & 2032
- Table 7: Global Hong Kong Data Center Construction Market Revenue Million Forecast, by Country 2019 & 2032
- Table 8: Global Hong Kong Data Center Construction Market Revenue Million Forecast, by Tier Type 2019 & 2032
- Table 9: Global Hong Kong Data Center Construction Market Revenue Million Forecast, by Data Center Size 2019 & 2032
- Table 10: Global Hong Kong Data Center Construction Market Revenue Million Forecast, by Infrastructure 2019 & 2032
- Table 11: Global Hong Kong Data Center Construction Market Revenue Million Forecast, by End-User 2019 & 2032
- Table 12: Global Hong Kong Data Center Construction Market Revenue Million Forecast, by Country 2019 & 2032
- Table 13: United States Hong Kong Data Center Construction Market Revenue (Million) Forecast, by Application 2019 & 2032
- Table 14: Canada Hong Kong Data Center Construction Market Revenue (Million) Forecast, by Application 2019 & 2032
- Table 15: Mexico Hong Kong Data Center Construction Market Revenue (Million) Forecast, by Application 2019 & 2032
- Table 16: Global Hong Kong Data Center Construction Market Revenue Million Forecast, by Tier Type 2019 & 2032
- Table 17: Global Hong Kong Data Center Construction Market Revenue Million Forecast, by Data Center Size 2019 & 2032
- Table 18: Global Hong Kong Data Center Construction Market Revenue Million Forecast, by Infrastructure 2019 & 2032
- Table 19: Global Hong Kong Data Center Construction Market Revenue Million Forecast, by End-User 2019 & 2032
- Table 20: Global Hong Kong Data Center Construction Market Revenue Million Forecast, by Country 2019 & 2032
- Table 21: Brazil Hong Kong Data Center Construction Market Revenue (Million) Forecast, by Application 2019 & 2032
- Table 22: Argentina Hong Kong Data Center Construction Market Revenue (Million) Forecast, by Application 2019 & 2032
- Table 23: Rest of South America Hong Kong Data Center Construction Market Revenue (Million) Forecast, by Application 2019 & 2032
- Table 24: Global Hong Kong Data Center Construction Market Revenue Million Forecast, by Tier Type 2019 & 2032
- Table 25: Global Hong Kong Data Center Construction Market Revenue Million Forecast, by Data Center Size 2019 & 2032
- Table 26: Global Hong Kong Data Center Construction Market Revenue Million Forecast, by Infrastructure 2019 & 2032
- Table 27: Global Hong Kong Data Center Construction Market Revenue Million Forecast, by End-User 2019 & 2032
- Table 28: Global Hong Kong Data Center Construction Market Revenue Million Forecast, by Country 2019 & 2032
- Table 29: United Kingdom Hong Kong Data Center Construction Market Revenue (Million) Forecast, by Application 2019 & 2032
- Table 30: Germany Hong Kong Data Center Construction Market Revenue (Million) Forecast, by Application 2019 & 2032
- Table 31: France Hong Kong Data Center Construction Market Revenue (Million) Forecast, by Application 2019 & 2032
- Table 32: Italy Hong Kong Data Center Construction Market Revenue (Million) Forecast, by Application 2019 & 2032
- Table 33: Spain Hong Kong Data Center Construction Market Revenue (Million) Forecast, by Application 2019 & 2032
- Table 34: Russia Hong Kong Data Center Construction Market Revenue (Million) Forecast, by Application 2019 & 2032
- Table 35: Benelux Hong Kong Data Center Construction Market Revenue (Million) Forecast, by Application 2019 & 2032
- Table 36: Nordics Hong Kong Data Center Construction Market Revenue (Million) Forecast, by Application 2019 & 2032
- Table 37: Rest of Europe Hong Kong Data Center Construction Market Revenue (Million) Forecast, by Application 2019 & 2032
- Table 38: Global Hong Kong Data Center Construction Market Revenue Million Forecast, by Tier Type 2019 & 2032
- Table 39: Global Hong Kong Data Center Construction Market Revenue Million Forecast, by Data Center Size 2019 & 2032
- Table 40: Global Hong Kong Data Center Construction Market Revenue Million Forecast, by Infrastructure 2019 & 2032
- Table 41: Global Hong Kong Data Center Construction Market Revenue Million Forecast, by End-User 2019 & 2032
- Table 42: Global Hong Kong Data Center Construction Market Revenue Million Forecast, by Country 2019 & 2032
- Table 43: Turkey Hong Kong Data Center Construction Market Revenue (Million) Forecast, by Application 2019 & 2032
- Table 44: Israel Hong Kong Data Center Construction Market Revenue (Million) Forecast, by Application 2019 & 2032
- Table 45: GCC Hong Kong Data Center Construction Market Revenue (Million) Forecast, by Application 2019 & 2032
- Table 46: North Africa Hong Kong Data Center Construction Market Revenue (Million) Forecast, by Application 2019 & 2032
- Table 47: South Africa Hong Kong Data Center Construction Market Revenue (Million) Forecast, by Application 2019 & 2032
- Table 48: Rest of Middle East & Africa Hong Kong Data Center Construction Market Revenue (Million) Forecast, by Application 2019 & 2032
- Table 49: Global Hong Kong Data Center Construction Market Revenue Million Forecast, by Tier Type 2019 & 2032
- Table 50: Global Hong Kong Data Center Construction Market Revenue Million Forecast, by Data Center Size 2019 & 2032
- Table 51: Global Hong Kong Data Center Construction Market Revenue Million Forecast, by Infrastructure 2019 & 2032
- Table 52: Global Hong Kong Data Center Construction Market Revenue Million Forecast, by End-User 2019 & 2032
- Table 53: Global Hong Kong Data Center Construction Market Revenue Million Forecast, by Country 2019 & 2032
- Table 54: China Hong Kong Data Center Construction Market Revenue (Million) Forecast, by Application 2019 & 2032
- Table 55: India Hong Kong Data Center Construction Market Revenue (Million) Forecast, by Application 2019 & 2032
- Table 56: Japan Hong Kong Data Center Construction Market Revenue (Million) Forecast, by Application 2019 & 2032
- Table 57: South Korea Hong Kong Data Center Construction Market Revenue (Million) Forecast, by Application 2019 & 2032
- Table 58: ASEAN Hong Kong Data Center Construction Market Revenue (Million) Forecast, by Application 2019 & 2032
- Table 59: Oceania Hong Kong Data Center Construction Market Revenue (Million) Forecast, by Application 2019 & 2032
- Table 60: Rest of Asia Pacific Hong Kong Data Center Construction Market Revenue (Million) Forecast, by Application 2019 & 2032
Frequently Asked Questions
1. What is the projected Compound Annual Growth Rate (CAGR) of the Hong Kong Data Center Construction Market ?
The projected CAGR is approximately 13.25%.
2. Which companies are prominent players in the Hong Kong Data Center Construction Market ?
Key companies in the market include Space DC Pte Ltd, Vertiv Grou, Project Planning Service, NTT Communications Corporation, XL Axiata Tbk PT (Princeton Digital Group), Telkomsigma, GTN Data Center, BYME Engineering, Arup Group, Lintasarta, Biznet Networks, JupiterDC, PT Faasri Utama Sakti, Aurecon, Schneider Electric, Gulf Energy Development Public Company Limited, Mitsubishi Electric, Indosat Tbk PT.
3. What are the main segments of the Hong Kong Data Center Construction Market ?
The market segments include Tier Type, Data Center Size, Infrastructure, End-User.
4. Can you provide details about the market size?
The market size is estimated to be USD XX Million as of 2022.
5. What are some drivers contributing to market growth?
Major Initiatives Undertaken by Governments to Promote Digital Economy and Connectivity Infrastructure; Rising Adoption of Hyperscale Data Centers.
6. What are the notable trends driving market growth?
IT and Telcom Segment is Expected to Gain Significant Market Share.
7. Are there any restraints impacting market growth?
Environmental. Cost. and Workforce-related Challenges.
8. Can you provide examples of recent developments in the market?
November 2022: The company announced the opening of its new regional office in Kowloon, Hong Kong. The office would help the company strengthen its expansion and would cater to business needs such as engineering, construction, and sales in the Asia-Pacific region.
9. What pricing options are available for accessing the report?
Pricing options include single-user, multi-user, and enterprise licenses priced at USD 3800, USD 4500, and USD 5800 respectively.
10. Is the market size provided in terms of value or volume?
The market size is provided in terms of value, measured in Million.
11. Are there any specific market keywords associated with the report?
Yes, the market keyword associated with the report is "Hong Kong Data Center Construction Market ," which aids in identifying and referencing the specific market segment covered.
12. How do I determine which pricing option suits my needs best?
The pricing options vary based on user requirements and access needs. Individual users may opt for single-user licenses, while businesses requiring broader access may choose multi-user or enterprise licenses for cost-effective access to the report.
13. Are there any additional resources or data provided in the Hong Kong Data Center Construction Market report?
While the report offers comprehensive insights, it's advisable to review the specific contents or supplementary materials provided to ascertain if additional resources or data are available.
14. How can I stay updated on further developments or reports in the Hong Kong Data Center Construction Market ?
To stay informed about further developments, trends, and reports in the Hong Kong Data Center Construction Market , consider subscribing to industry newsletters, following relevant companies and organizations, or regularly checking reputable industry news sources and publications.
Methodology
Step 1 - Identification of Relevant Samples Size from Population Database


Step 2 - Approaches for Defining Global Market Size (Value, Volume* & Price*)

Note*: In applicable scenarios
Step 3 - Data Sources
Primary Research
- Web Analytics
- Survey Reports
- Research Institute
- Latest Research Reports
- Opinion Leaders
Secondary Research
- Annual Reports
- White Paper
- Latest Press Release
- Industry Association
- Paid Database
- Investor Presentations

Step 4 - Data Triangulation
Involves using different sources of information in order to increase the validity of a study
These sources are likely to be stakeholders in a program - participants, other researchers, program staff, other community members, and so on.
Then we put all data in single framework & apply various statistical tools to find out the dynamic on the market.
During the analysis stage, feedback from the stakeholder groups would be compared to determine areas of agreement as well as areas of divergence
