

Key Insights
The global infrastructure protection market is poised for substantial expansion, driven by the escalating reliance on critical infrastructure and the persistent rise in cybersecurity threats. The market, valued at approximately $151.8 billion in the base year 2025, is projected to grow at a Compound Annual Growth Rate (CAGR) of 4.4% from 2025 to 2033. This growth is propelled by the widespread adoption of smart city initiatives, the increasing digitalization of infrastructure assets, and the implementation of stringent government regulations mandating robust cybersecurity. Significant investments in advanced technologies, including AI-powered threat detection and IoT-enabled security systems, are further accelerating market development. Key sectors such as Banking, Financial Services, and Insurance (BFSI), public infrastructure and transportation, and energy and power are leading the demand for sophisticated protection solutions due to their high vulnerability to cyber and physical threats.
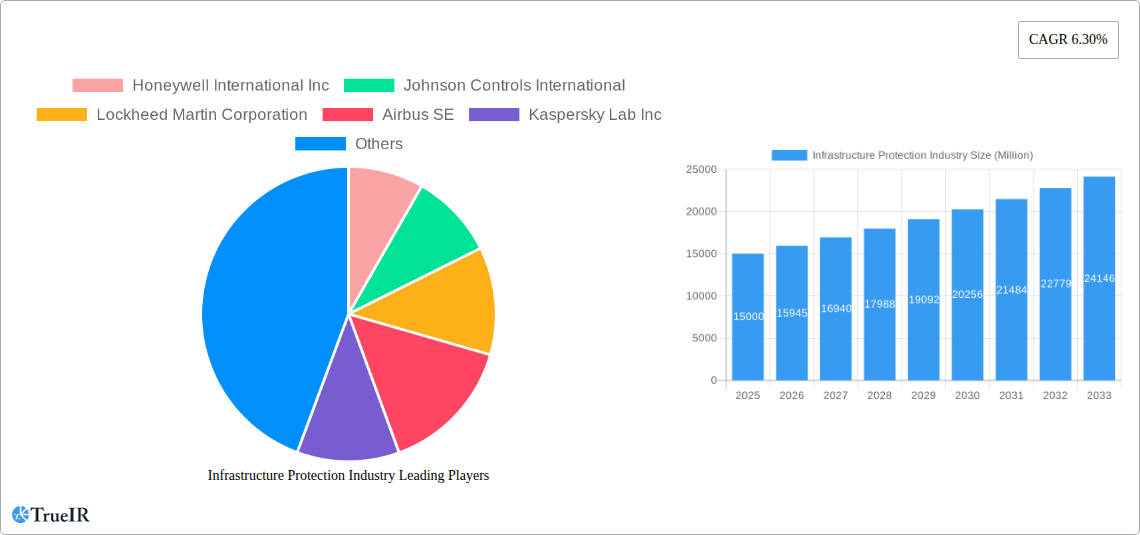
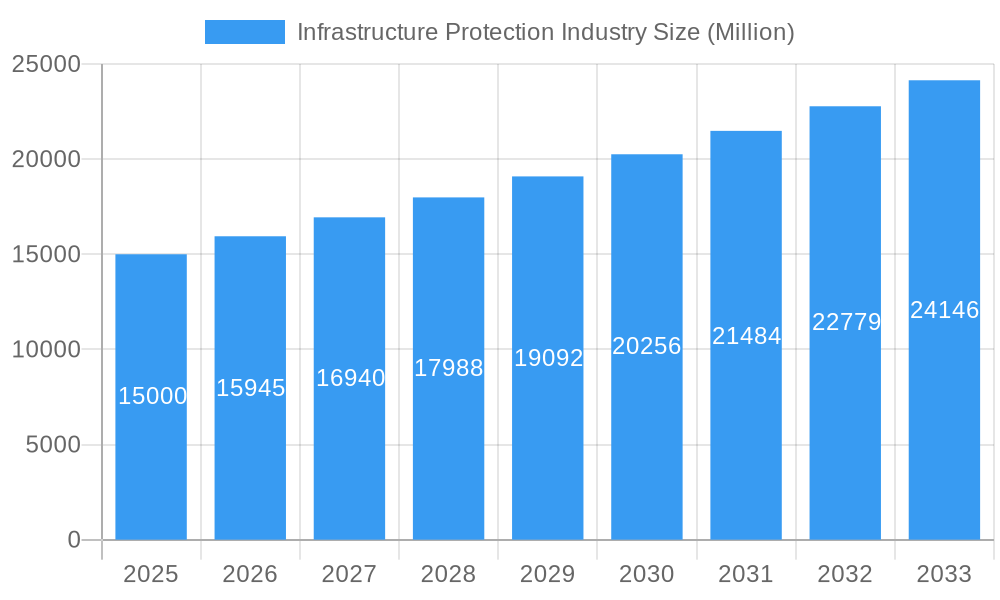
Infrastructure Protection Industry Market Size (In Billion)
Market segmentation reveals distinct growth opportunities. The managed services segment is experiencing rapid uptake due to its cost-effectiveness and scalability, while risk management services are benefiting from heightened awareness of security breach consequences. Geographically, North America and Europe currently lead the market, supported by advanced infrastructure and rigorous security mandates. However, the Asia-Pacific region is expected to witness significant growth, fueled by rapid industrialization and digital infrastructure development in emerging economies. Market challenges include high initial investment costs, a scarcity of skilled cybersecurity professionals, and the complexity of integrating diverse security solutions. Despite these obstacles, the long-term outlook for the infrastructure protection market remains highly positive, underpinned by continuous technological innovation and the enduring imperative to safeguard critical assets against evolving threats.
Infrastructure Protection Industry Company Market Share
Infrastructure Protection Industry Market Report: 2019-2033
This comprehensive report provides a detailed analysis of the Infrastructure Protection Industry, encompassing market size, growth projections, competitive landscape, and future trends. The study period covers 2019-2033, with 2025 as the base and estimated year. The forecast period spans 2025-2033, and the historical period covers 2019-2024. The market is valued at $XX Million in 2025 and is projected to reach $XX Million by 2033, exhibiting a CAGR of XX%.
Infrastructure Protection Industry Market Structure & Competitive Landscape
The Infrastructure Protection industry is characterized by a moderately concentrated market structure. While a few major players like Honeywell International Inc, Johnson Controls International, and Lockheed Martin Corporation hold significant market share, the presence of numerous smaller, specialized firms creates a competitive landscape. The industry's concentration ratio (CR4) is estimated at XX%, indicating a moderate level of competition. Innovation is a key driver, with companies constantly developing advanced technologies such as AI-powered threat detection, and zero-trust security solutions. Stringent government regulations, particularly concerning data privacy and cybersecurity compliance (e.g., GDPR, CCPA), significantly influence market dynamics. Product substitutes, such as traditional security systems, are being replaced by more sophisticated, integrated solutions. The end-user segmentation is diverse, encompassing BFSI, Public Infrastructure & Transportation, Energy and Power, and other sectors. Mergers and acquisitions (M&A) activity has been significant, with several notable deals in recent years. The total value of M&A transactions in the industry during the historical period is estimated at $XX Million. This reflects the consolidation trend and increasing competition for market share within the sector.
- Market Concentration: CR4 estimated at XX%
- Innovation Drivers: AI-powered threat detection, zero-trust security
- Regulatory Impacts: GDPR, CCPA, and other regional cybersecurity regulations
- Product Substitutes: Traditional security systems are being progressively replaced
- End-User Segmentation: BFSI, Public Infrastructure & Transportation, Energy and Power, Commercial Sector, IT & Telecom, Manufacturing, Others
- M&A Trends: Significant activity, with $XX Million in transactions during 2019-2024.
Infrastructure Protection Industry Market Trends & Opportunities
The Infrastructure Protection industry is experiencing robust growth, driven by escalating cyber threats, increasing digitalization across critical infrastructure sectors, and stringent government regulations. The market size is expanding significantly, with a projected CAGR of XX% during the forecast period. Technological advancements, including the rise of IoT (Internet of Things) devices and the adoption of cloud-based security solutions, are reshaping the industry landscape. Consumer preferences are shifting towards integrated, comprehensive security solutions that offer robust protection against evolving cyber threats. The competitive dynamics are intensifying, with companies investing heavily in R&D and strategic partnerships to maintain their market position. Market penetration rates for advanced security solutions are steadily increasing, particularly in sectors such as BFSI and Public Infrastructure & Transportation. The growing awareness of cybersecurity risks is pushing significant investments in protective measures. The rise of remote work and the increasing reliance on digital infrastructure are creating new opportunities for Infrastructure Protection vendors.
Dominant Markets & Segments in Infrastructure Protection Industry
The North American region currently holds the largest market share in the Infrastructure Protection industry, driven by robust investment in critical infrastructure, stringent regulatory frameworks, and the presence of major technology companies. Within the services segment, Risk Management Services and Managed Services are experiencing the fastest growth, reflecting the increasing demand for proactive security measures and outsourced security expertise. The Public Infrastructure & Transportation and Energy and Power verticals are significant contributors to market revenue, given their critical reliance on secure operations.
- Key Growth Drivers:
- North America: Robust investment in critical infrastructure, stringent regulations.
- BFSI: Stringent regulatory compliance and high value of assets.
- Public Infrastructure & Transportation: Critical infrastructure and growing cyber threats.
- Energy and Power: Concerns over grid security and operational disruptions.
Infrastructure Protection Industry Product Analysis
The Infrastructure Protection market showcases continuous product innovation, driven by advancements in artificial intelligence, machine learning, and cloud computing. Products range from traditional security systems to sophisticated, integrated solutions that leverage AI for threat detection and response. Key competitive advantages include superior threat detection capabilities, ease of integration with existing systems, and comprehensive security management tools. These technologies deliver better protection, automated responses to incidents, and seamless integration into diverse environments.
Key Drivers, Barriers & Challenges in Infrastructure Protection Industry
Key Drivers: Increasing cyber threats, rising digitalization of critical infrastructure, government regulations mandating enhanced security measures, and expanding adoption of advanced security technologies like AI and IoT drive market growth. The expanding use of cloud-based security solutions and a growing awareness of cybersecurity risks are fueling demand.
Key Challenges: High initial investment costs, complexity of implementing advanced security solutions, lack of skilled cybersecurity professionals, and the constantly evolving threat landscape pose significant challenges. Supply chain disruptions can also impact the availability of critical components and negatively affect project timelines. The cost of regulatory compliance adds financial burden to companies.
Growth Drivers in the Infrastructure Protection Industry Market
Technological advancements (AI, IoT, cloud computing), increasing government spending on cybersecurity initiatives, and the growing awareness of the potential impact of cyberattacks on critical infrastructure are key growth drivers. Stringent data privacy regulations are also increasing demand for robust security solutions.
Challenges Impacting Infrastructure Protection Industry Growth
High implementation costs, talent shortages in cybersecurity, and the ever-evolving nature of cyber threats present significant challenges. Supply chain vulnerabilities and the complexities of complying with diverse global regulations further restrict growth.
Key Players Shaping the Infrastructure Protection Industry Market
- Honeywell International Inc
- Johnson Controls International
- Lockheed Martin Corporation
- Airbus SE
- Kaspersky Lab Inc
- General Dynamics
- Rolta India Limited
- Northrop Grumman Corporation
- SCADAfence
- BAE Systems plc
- Waterfall Security Solutions
- McAfee Corp
Significant Infrastructure Protection Industry Industry Milestones
- September 2022: McAfee Corp partnered with Telefonica to enhance cybersecurity offerings in EMEA and Latin America.
- June 2022: Johnson Controls acquired Tempered Networks to strengthen its zero-trust cybersecurity capabilities.
Future Outlook for Infrastructure Protection Industry Market
The Infrastructure Protection industry is poised for continued growth, driven by the increasing adoption of advanced security solutions, expansion into new verticals, and ongoing investments in cybersecurity research and development. The market presents significant opportunities for companies that can effectively address the evolving threat landscape and offer innovative, integrated security solutions. Strategic partnerships and acquisitions will continue to shape the competitive landscape.
Infrastructure Protection Industry Segmentation
-
1. Services
- 1.1. Risk Management Services
- 1.2. Designing, Integration, and Consultation
- 1.3. Managed Service
- 1.4. Maintenance & Support
-
2. Vertical
- 2.1. BFSI
- 2.2. Public Infrastructure &Transportation
- 2.3. Energy and Power
- 2.4. Commercial Sector
- 2.5. IT & Telecom
- 2.6. Manufacturing
- 2.7. Others
Infrastructure Protection Industry Segmentation By Geography
- 1. North America
- 2. Europe
- 3. Asia Pacific
- 4. Latin America
- 5. Middle East and Africa
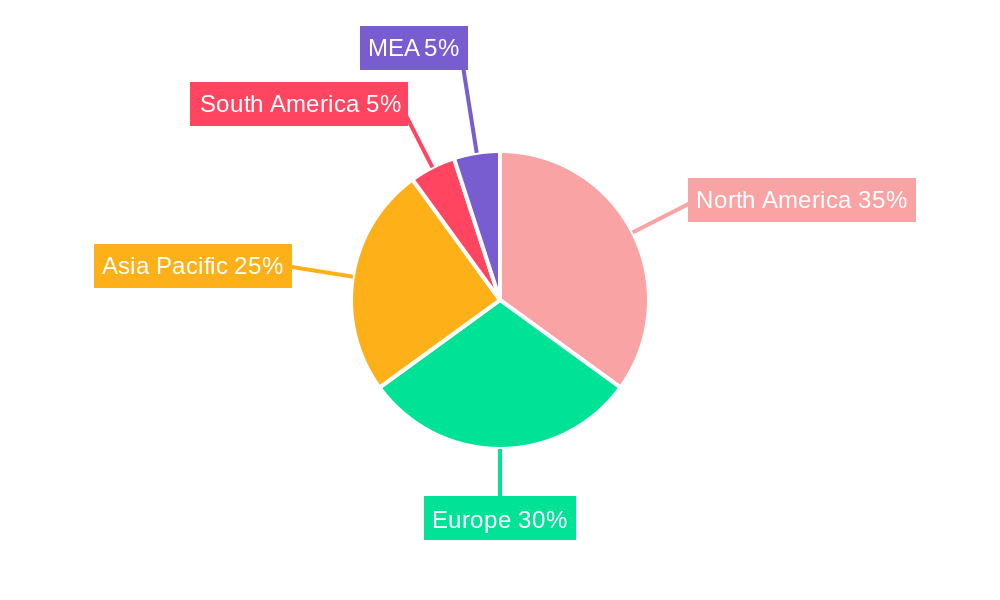
Infrastructure Protection Industry Regional Market Share
Geographic Coverage of Infrastructure Protection Industry
Infrastructure Protection Industry REPORT HIGHLIGHTS
| Aspects | Details |
|---|---|
| Study Period | 2020-2034 |
| Base Year | 2025 |
| Estimated Year | 2026 |
| Forecast Period | 2026-2034 |
| Historical Period | 2020-2025 |
| Growth Rate | CAGR of 4.4% from 2020-2034 |
| Segmentation |
|
Table of Contents
- 1. Introduction
- 1.1. Research Scope
- 1.2. Market Segmentation
- 1.3. Research Objective
- 1.4. Definitions and Assumptions
- 2. Executive Summary
- 2.1. Market Snapshot
- 3. Market Dynamics
- 3.1. Market Drivers
- 3.2. Market Restrains
- 3.3. Market Trends
- 3.4. Market Opportunities
- 4. Market Factor Analysis
- 4.1. Porters Five Forces
- 4.1.1. Bargaining Power of Suppliers
- 4.1.2. Bargaining Power of Buyers
- 4.1.3. Threat of New Entrants
- 4.1.4. Threat of Substitutes
- 4.1.5. Competitive Rivalry
- 4.2. PESTEL analysis
- 4.3. BCG Analysis
- 4.3.1. Stars (High Growth, High Market Share)
- 4.3.2. Cash Cows (Low Growth, High Market Share)
- 4.3.3. Question Mark (High Growth, Low Market Share)
- 4.3.4. Dogs (Low Growth, Low Market Share)
- 4.4. Ansoff Matrix Analysis
- 4.5. Supply Chain Analysis
- 4.6. Regulatory Landscape
- 4.7. Current Market Potential and Opportunity Assessment (TAM–SAM–SOM Framework)
- 4.8. TIR Analyst Note
- 4.1. Porters Five Forces
- 5. Market Analysis, Insights and Forecast 2021-2033
- 5.1. Market Analysis, Insights and Forecast - by Services
- 5.1.1. Risk Management Services
- 5.1.2. Designing, Integration, and Consultation
- 5.1.3. Managed Service
- 5.1.4. Maintenance & Support
- 5.2. Market Analysis, Insights and Forecast - by Vertical
- 5.2.1. BFSI
- 5.2.2. Public Infrastructure &Transportation
- 5.2.3. Energy and Power
- 5.2.4. Commercial Sector
- 5.2.5. IT & Telecom
- 5.2.6. Manufacturing
- 5.2.7. Others
- 5.3. Market Analysis, Insights and Forecast - by Region
- 5.3.1. North America
- 5.3.2. Europe
- 5.3.3. Asia Pacific
- 5.3.4. Latin America
- 5.3.5. Middle East and Africa
- 5.1. Market Analysis, Insights and Forecast - by Services
- 6. Global Infrastructure Protection Industry Analysis, Insights and Forecast, 2021-2033
- 6.1. Market Analysis, Insights and Forecast - by Services
- 6.1.1. Risk Management Services
- 6.1.2. Designing, Integration, and Consultation
- 6.1.3. Managed Service
- 6.1.4. Maintenance & Support
- 6.2. Market Analysis, Insights and Forecast - by Vertical
- 6.2.1. BFSI
- 6.2.2. Public Infrastructure &Transportation
- 6.2.3. Energy and Power
- 6.2.4. Commercial Sector
- 6.2.5. IT & Telecom
- 6.2.6. Manufacturing
- 6.2.7. Others
- 6.1. Market Analysis, Insights and Forecast - by Services
- 7. North America Infrastructure Protection Industry Analysis, Insights and Forecast, 2020-2032
- 7.1. Market Analysis, Insights and Forecast - by Services
- 7.1.1. Risk Management Services
- 7.1.2. Designing, Integration, and Consultation
- 7.1.3. Managed Service
- 7.1.4. Maintenance & Support
- 7.2. Market Analysis, Insights and Forecast - by Vertical
- 7.2.1. BFSI
- 7.2.2. Public Infrastructure &Transportation
- 7.2.3. Energy and Power
- 7.2.4. Commercial Sector
- 7.2.5. IT & Telecom
- 7.2.6. Manufacturing
- 7.2.7. Others
- 7.1. Market Analysis, Insights and Forecast - by Services
- 8. Europe Infrastructure Protection Industry Analysis, Insights and Forecast, 2020-2032
- 8.1. Market Analysis, Insights and Forecast - by Services
- 8.1.1. Risk Management Services
- 8.1.2. Designing, Integration, and Consultation
- 8.1.3. Managed Service
- 8.1.4. Maintenance & Support
- 8.2. Market Analysis, Insights and Forecast - by Vertical
- 8.2.1. BFSI
- 8.2.2. Public Infrastructure &Transportation
- 8.2.3. Energy and Power
- 8.2.4. Commercial Sector
- 8.2.5. IT & Telecom
- 8.2.6. Manufacturing
- 8.2.7. Others
- 8.1. Market Analysis, Insights and Forecast - by Services
- 9. Asia Pacific Infrastructure Protection Industry Analysis, Insights and Forecast, 2020-2032
- 9.1. Market Analysis, Insights and Forecast - by Services
- 9.1.1. Risk Management Services
- 9.1.2. Designing, Integration, and Consultation
- 9.1.3. Managed Service
- 9.1.4. Maintenance & Support
- 9.2. Market Analysis, Insights and Forecast - by Vertical
- 9.2.1. BFSI
- 9.2.2. Public Infrastructure &Transportation
- 9.2.3. Energy and Power
- 9.2.4. Commercial Sector
- 9.2.5. IT & Telecom
- 9.2.6. Manufacturing
- 9.2.7. Others
- 9.1. Market Analysis, Insights and Forecast - by Services
- 10. Latin America Infrastructure Protection Industry Analysis, Insights and Forecast, 2020-2032
- 10.1. Market Analysis, Insights and Forecast - by Services
- 10.1.1. Risk Management Services
- 10.1.2. Designing, Integration, and Consultation
- 10.1.3. Managed Service
- 10.1.4. Maintenance & Support
- 10.2. Market Analysis, Insights and Forecast - by Vertical
- 10.2.1. BFSI
- 10.2.2. Public Infrastructure &Transportation
- 10.2.3. Energy and Power
- 10.2.4. Commercial Sector
- 10.2.5. IT & Telecom
- 10.2.6. Manufacturing
- 10.2.7. Others
- 10.1. Market Analysis, Insights and Forecast - by Services
- 11. Middle East and Africa Infrastructure Protection Industry Analysis, Insights and Forecast, 2020-2032
- 11.1. Market Analysis, Insights and Forecast - by Services
- 11.1.1. Risk Management Services
- 11.1.2. Designing, Integration, and Consultation
- 11.1.3. Managed Service
- 11.1.4. Maintenance & Support
- 11.2. Market Analysis, Insights and Forecast - by Vertical
- 11.2.1. BFSI
- 11.2.2. Public Infrastructure &Transportation
- 11.2.3. Energy and Power
- 11.2.4. Commercial Sector
- 11.2.5. IT & Telecom
- 11.2.6. Manufacturing
- 11.2.7. Others
- 11.1. Market Analysis, Insights and Forecast - by Services
- 12. Competitive Analysis
- 12.1. Company Profiles
- 12.1.1 Honeywell International Inc
- 12.1.1.1. Company Overview
- 12.1.1.2. Products
- 12.1.1.3. Company Financials
- 12.1.1.4. SWOT Analysis
- 12.1.2 Johnson Controls International
- 12.1.2.1. Company Overview
- 12.1.2.2. Products
- 12.1.2.3. Company Financials
- 12.1.2.4. SWOT Analysis
- 12.1.3 Lockheed Martin Corporation
- 12.1.3.1. Company Overview
- 12.1.3.2. Products
- 12.1.3.3. Company Financials
- 12.1.3.4. SWOT Analysis
- 12.1.4 Airbus SE
- 12.1.4.1. Company Overview
- 12.1.4.2. Products
- 12.1.4.3. Company Financials
- 12.1.4.4. SWOT Analysis
- 12.1.5 Kaspersky Lab Inc
- 12.1.5.1. Company Overview
- 12.1.5.2. Products
- 12.1.5.3. Company Financials
- 12.1.5.4. SWOT Analysis
- 12.1.6 General Dynamics
- 12.1.6.1. Company Overview
- 12.1.6.2. Products
- 12.1.6.3. Company Financials
- 12.1.6.4. SWOT Analysis
- 12.1.7 Rolta India Limited
- 12.1.7.1. Company Overview
- 12.1.7.2. Products
- 12.1.7.3. Company Financials
- 12.1.7.4. SWOT Analysis
- 12.1.8 Northrop Grumman Corporation*List Not Exhaustive
- 12.1.8.1. Company Overview
- 12.1.8.2. Products
- 12.1.8.3. Company Financials
- 12.1.8.4. SWOT Analysis
- 12.1.9 SCADAfence
- 12.1.9.1. Company Overview
- 12.1.9.2. Products
- 12.1.9.3. Company Financials
- 12.1.9.4. SWOT Analysis
- 12.1.10 BAE Systems plc
- 12.1.10.1. Company Overview
- 12.1.10.2. Products
- 12.1.10.3. Company Financials
- 12.1.10.4. SWOT Analysis
- 12.1.11 Waterfall Security Solutions
- 12.1.11.1. Company Overview
- 12.1.11.2. Products
- 12.1.11.3. Company Financials
- 12.1.11.4. SWOT Analysis
- 12.1.12 McAfee Corp
- 12.1.12.1. Company Overview
- 12.1.12.2. Products
- 12.1.12.3. Company Financials
- 12.1.12.4. SWOT Analysis
- 12.1.1 Honeywell International Inc
- 12.2. Market Entropy
- 12.2.1 Company's Key Areas Served
- 12.2.2 Recent Developments
- 12.3. Company Market Share Analysis 2025
- 12.3.1 Top 5 Companies Market Share Analysis
- 12.3.2 Top 3 Companies Market Share Analysis
- 12.4. List of Potential Customers
- 13. Research Methodology
List of Figures
- Figure 1: Global Infrastructure Protection Industry Revenue Breakdown (billion, %) by Region 2025 & 2033
- Figure 2: North America Infrastructure Protection Industry Revenue (billion), by Services 2025 & 2033
- Figure 3: North America Infrastructure Protection Industry Revenue Share (%), by Services 2025 & 2033
- Figure 4: North America Infrastructure Protection Industry Revenue (billion), by Vertical 2025 & 2033
- Figure 5: North America Infrastructure Protection Industry Revenue Share (%), by Vertical 2025 & 2033
- Figure 6: North America Infrastructure Protection Industry Revenue (billion), by Country 2025 & 2033
- Figure 7: North America Infrastructure Protection Industry Revenue Share (%), by Country 2025 & 2033
- Figure 8: Europe Infrastructure Protection Industry Revenue (billion), by Services 2025 & 2033
- Figure 9: Europe Infrastructure Protection Industry Revenue Share (%), by Services 2025 & 2033
- Figure 10: Europe Infrastructure Protection Industry Revenue (billion), by Vertical 2025 & 2033
- Figure 11: Europe Infrastructure Protection Industry Revenue Share (%), by Vertical 2025 & 2033
- Figure 12: Europe Infrastructure Protection Industry Revenue (billion), by Country 2025 & 2033
- Figure 13: Europe Infrastructure Protection Industry Revenue Share (%), by Country 2025 & 2033
- Figure 14: Asia Pacific Infrastructure Protection Industry Revenue (billion), by Services 2025 & 2033
- Figure 15: Asia Pacific Infrastructure Protection Industry Revenue Share (%), by Services 2025 & 2033
- Figure 16: Asia Pacific Infrastructure Protection Industry Revenue (billion), by Vertical 2025 & 2033
- Figure 17: Asia Pacific Infrastructure Protection Industry Revenue Share (%), by Vertical 2025 & 2033
- Figure 18: Asia Pacific Infrastructure Protection Industry Revenue (billion), by Country 2025 & 2033
- Figure 19: Asia Pacific Infrastructure Protection Industry Revenue Share (%), by Country 2025 & 2033
- Figure 20: Latin America Infrastructure Protection Industry Revenue (billion), by Services 2025 & 2033
- Figure 21: Latin America Infrastructure Protection Industry Revenue Share (%), by Services 2025 & 2033
- Figure 22: Latin America Infrastructure Protection Industry Revenue (billion), by Vertical 2025 & 2033
- Figure 23: Latin America Infrastructure Protection Industry Revenue Share (%), by Vertical 2025 & 2033
- Figure 24: Latin America Infrastructure Protection Industry Revenue (billion), by Country 2025 & 2033
- Figure 25: Latin America Infrastructure Protection Industry Revenue Share (%), by Country 2025 & 2033
- Figure 26: Middle East and Africa Infrastructure Protection Industry Revenue (billion), by Services 2025 & 2033
- Figure 27: Middle East and Africa Infrastructure Protection Industry Revenue Share (%), by Services 2025 & 2033
- Figure 28: Middle East and Africa Infrastructure Protection Industry Revenue (billion), by Vertical 2025 & 2033
- Figure 29: Middle East and Africa Infrastructure Protection Industry Revenue Share (%), by Vertical 2025 & 2033
- Figure 30: Middle East and Africa Infrastructure Protection Industry Revenue (billion), by Country 2025 & 2033
- Figure 31: Middle East and Africa Infrastructure Protection Industry Revenue Share (%), by Country 2025 & 2033
List of Tables
- Table 1: Global Infrastructure Protection Industry Revenue billion Forecast, by Services 2020 & 2033
- Table 2: Global Infrastructure Protection Industry Revenue billion Forecast, by Vertical 2020 & 2033
- Table 3: Global Infrastructure Protection Industry Revenue billion Forecast, by Region 2020 & 2033
- Table 4: Global Infrastructure Protection Industry Revenue billion Forecast, by Services 2020 & 2033
- Table 5: Global Infrastructure Protection Industry Revenue billion Forecast, by Vertical 2020 & 2033
- Table 6: Global Infrastructure Protection Industry Revenue billion Forecast, by Country 2020 & 2033
- Table 7: Global Infrastructure Protection Industry Revenue billion Forecast, by Services 2020 & 2033
- Table 8: Global Infrastructure Protection Industry Revenue billion Forecast, by Vertical 2020 & 2033
- Table 9: Global Infrastructure Protection Industry Revenue billion Forecast, by Country 2020 & 2033
- Table 10: Global Infrastructure Protection Industry Revenue billion Forecast, by Services 2020 & 2033
- Table 11: Global Infrastructure Protection Industry Revenue billion Forecast, by Vertical 2020 & 2033
- Table 12: Global Infrastructure Protection Industry Revenue billion Forecast, by Country 2020 & 2033
- Table 13: Global Infrastructure Protection Industry Revenue billion Forecast, by Services 2020 & 2033
- Table 14: Global Infrastructure Protection Industry Revenue billion Forecast, by Vertical 2020 & 2033
- Table 15: Global Infrastructure Protection Industry Revenue billion Forecast, by Country 2020 & 2033
- Table 16: Global Infrastructure Protection Industry Revenue billion Forecast, by Services 2020 & 2033
- Table 17: Global Infrastructure Protection Industry Revenue billion Forecast, by Vertical 2020 & 2033
- Table 18: Global Infrastructure Protection Industry Revenue billion Forecast, by Country 2020 & 2033
Frequently Asked Questions
1. What is the projected Compound Annual Growth Rate (CAGR) of the Infrastructure Protection Industry?
The projected CAGR is approximately 4.4%.
2. Which companies are prominent players in the Infrastructure Protection Industry?
Key companies in the market include Honeywell International Inc, Johnson Controls International, Lockheed Martin Corporation, Airbus SE, Kaspersky Lab Inc, General Dynamics, Rolta India Limited, Northrop Grumman Corporation*List Not Exhaustive, SCADAfence, BAE Systems plc, Waterfall Security Solutions, McAfee Corp.
3. What are the main segments of the Infrastructure Protection Industry?
The market segments include Services, Vertical.
4. Can you provide details about the market size?
The market size is estimated to be USD 151.8 billion as of 2022.
5. What are some drivers contributing to market growth?
Increasing Integration of infrastructure Protection with IoT and Cloud; Government Regulations on Infrastructure Protection.
6. What are the notable trends driving market growth?
Significant Demand in the BFSI Sector.
7. Are there any restraints impacting market growth?
Challenges Relating to Digital Transformation.
8. Can you provide examples of recent developments in the market?
In September 2022, McAfee Corp entered a multi-year partnership with Telefonica's digital business division to enhance its cybersecurity value offer for consumers in EMEA (Europe, Middle East, and Africa) and Latin America to include the online protection solutions of the American corporation into its portfolio. Telefónica Tech would incorporate the new McAfee Multi Access into its offering through this partnership arrangement to give its clients more thorough protection based on device security.
9. What pricing options are available for accessing the report?
Pricing options include single-user, multi-user, and enterprise licenses priced at USD 4750, USD 5250, and USD 8750 respectively.
10. Is the market size provided in terms of value or volume?
The market size is provided in terms of value, measured in billion.
11. Are there any specific market keywords associated with the report?
Yes, the market keyword associated with the report is "Infrastructure Protection Industry," which aids in identifying and referencing the specific market segment covered.
12. How do I determine which pricing option suits my needs best?
The pricing options vary based on user requirements and access needs. Individual users may opt for single-user licenses, while businesses requiring broader access may choose multi-user or enterprise licenses for cost-effective access to the report.
13. Are there any additional resources or data provided in the Infrastructure Protection Industry report?
While the report offers comprehensive insights, it's advisable to review the specific contents or supplementary materials provided to ascertain if additional resources or data are available.
14. How can I stay updated on further developments or reports in the Infrastructure Protection Industry?
To stay informed about further developments, trends, and reports in the Infrastructure Protection Industry, consider subscribing to industry newsletters, following relevant companies and organizations, or regularly checking reputable industry news sources and publications.
Methodology
Step 1 - Identification of Relevant Samples Size from Population Database


Step 2 - Approaches for Defining Global Market Size (Value, Volume* & Price*)

Note*: In applicable scenarios
Step 3 - Data Sources
Primary Research
- Web Analytics
- Survey Reports
- Research Institute
- Latest Research Reports
- Opinion Leaders
Secondary Research
- Annual Reports
- White Paper
- Latest Press Release
- Industry Association
- Paid Database
- Investor Presentations

Step 4 - Data Triangulation
Involves using different sources of information in order to increase the validity of a study
These sources are likely to be stakeholders in a program - participants, other researchers, program staff, other community members, and so on.
Then we put all data in single framework & apply various statistical tools to find out the dynamic on the market.
During the analysis stage, feedback from the stakeholder groups would be compared to determine areas of agreement as well as areas of divergence