

Key Insights
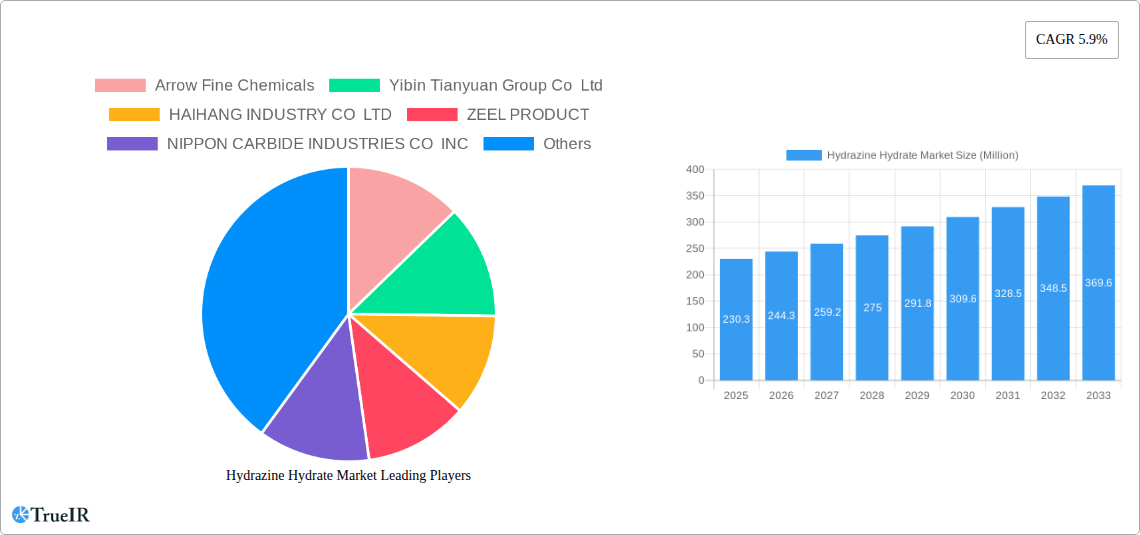
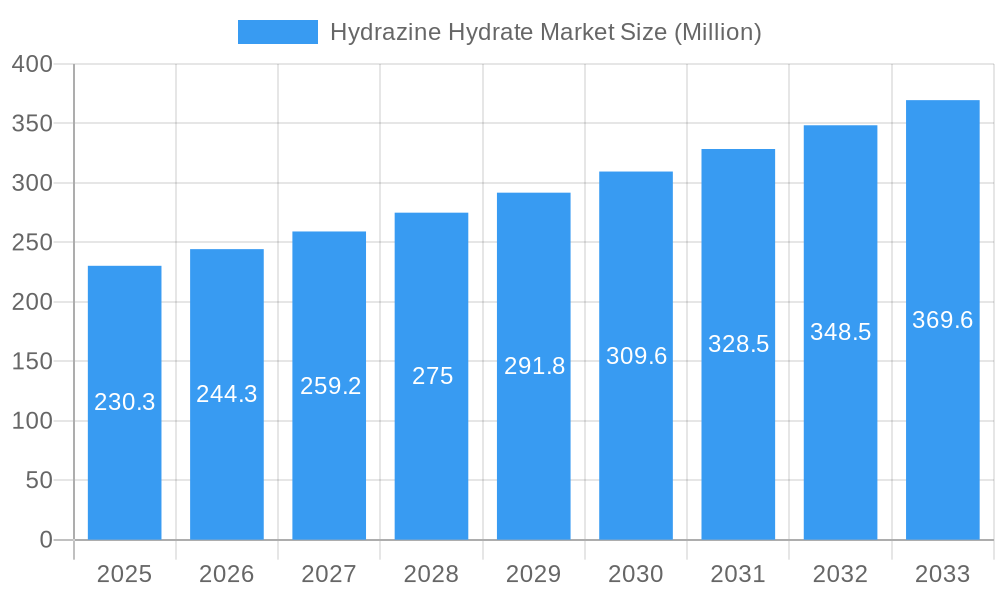
The Hydrazine Hydrate market, valued at $230.3 million in 2025, is projected to experience robust growth, driven by increasing demand across diverse sectors. A Compound Annual Growth Rate (CAGR) of 5.9% from 2025 to 2033 indicates a significant expansion of this market over the forecast period. Pharmaceutical applications, leveraging hydrazine hydrate's properties in drug synthesis, constitute a major driver. The growing pharmaceutical industry, particularly in developing economies, fuels this demand. Similarly, the polymer and blowing agent segment benefits from hydrazine hydrate's use in creating lightweight and high-performance materials, a trend boosted by the increasing demand for environmentally friendly alternatives in various manufacturing sectors. Agrochemicals also contribute substantially, with hydrazine hydrate used in the production of certain pesticides and herbicides. Growth is further fueled by advancements in water treatment technologies, utilizing hydrazine hydrate for efficient oxygen scavenging and boiler water treatment, particularly in industrial settings. While the market faces restraints such as stringent safety regulations surrounding the handling and transportation of hydrazine hydrate due to its hazardous nature, ongoing innovation in safer handling practices and improved safety protocols is likely to mitigate this concern. Segmentation by grade (industrial, reagent, others) and purity level (24-35%, 40-55%, 60-85%, 100%) further reveals diverse application requirements and associated market dynamics. Key players such as Arrow Fine Chemicals, Lanxess, and Arkema Group are strategically positioned to capitalize on these trends. Geographic growth is expected to be widespread, with Asia-Pacific, particularly China and India, anticipated to lead due to robust industrial expansion and increasing manufacturing activities.
Hydrazine Hydrate Market Market Size (In Million)
The competitive landscape is characterized by a mix of large multinational corporations and regional players. Strategic collaborations, mergers and acquisitions, and continuous innovation in manufacturing processes are expected to shape the competitive dynamics of the market. The increasing emphasis on sustainability and environmentally friendly alternatives in various end-use industries also presents growth opportunities for manufacturers who can offer solutions that align with these priorities. Future market growth will depend on factors such as technological advancements in handling and processing, regulatory compliance, and the continued expansion of key end-use industries. The market’s steady growth trajectory is poised to continue, creating significant opportunities for both existing and new entrants.
Hydrazine Hydrate Market Company Market Share
Hydrazine Hydrate Market: A Comprehensive Market Analysis Report (2019-2033)
This dynamic report provides a detailed analysis of the global Hydrazine Hydrate market, offering invaluable insights for businesses, investors, and researchers. Covering the period from 2019 to 2033, with a focus on 2025, this report leverages extensive market research to provide a comprehensive overview of market size, growth drivers, challenges, and future outlook. The report segments the market by application, grade type, and purity, and includes detailed competitive analysis, highlighting key players and their strategic initiatives.
Hydrazine Hydrate Market Market Structure & Competitive Landscape
The global hydrazine hydrate market exhibits a moderately consolidated structure. While a few major players dominate the market, several smaller regional players also contribute significantly. The Herfindahl-Hirschman Index (HHI) for the market in 2024 is estimated at xx, suggesting a moderately competitive landscape. Innovation drives market growth, primarily through the development of higher-purity grades and specialized applications. Stringent regulations regarding the handling and transportation of hydrazine hydrate due to its hazardous nature significantly impact market dynamics. The market faces competition from alternative chemicals with similar functionalities. End-user segmentation is diverse, with significant contributions from the pharmaceuticals, agrochemicals, and water treatment sectors. M&A activity has been moderate in recent years, with xx mergers and acquisitions recorded between 2019 and 2024, primarily focused on expanding geographical reach and enhancing production capabilities.
- Market Concentration: Moderately consolidated, with HHI of xx in 2024.
- Innovation Drivers: Development of higher-purity grades and specialized applications.
- Regulatory Impacts: Stringent regulations impacting handling and transportation.
- Product Substitutes: Competition from alternative chemicals with similar functionalities.
- End-User Segmentation: Pharmaceuticals, Agrochemicals, Water Treatment, and others.
- M&A Trends: xx M&A deals between 2019 and 2024, focusing on expansion and production enhancement.
Hydrazine Hydrate Market Market Trends & Opportunities
The global hydrazine hydrate market is poised for substantial expansion throughout the forecast period (2025-2033), exhibiting a projected Compound Annual Growth Rate (CAGR) of approximately [Insert Specific CAGR Here, e.g., 6.5%]. This robust growth trajectory is predominantly propelled by escalating demand across a spectrum of critical sectors, including the burgeoning pharmaceutical industry, the indispensable agrochemical sector, and the vital water treatment segment. Concurrently, ongoing advancements in production technologies are yielding more efficient and inherently safer manufacturing processes, thereby acting as significant catalysts for market proliferation. Consumer preferences are increasingly gravitating towards higher-purity grades of hydrazine hydrate, accompanied by an amplified emphasis on enhanced safety features throughout its lifecycle. The competitive landscape is characterized by intense rivalry among market participants, fostering an environment of continuous innovation and strategic price optimization. Market penetration rates demonstrate considerable regional and application-specific variations, with a pronounced dominance observed in developed economic blocs. Nevertheless, substantial untapped market potential resides within emerging economies, presenting compelling and lucrative growth opportunities for stakeholders. Furthermore, the burgeoning adoption of hydrazine hydrate in novel and specialized applications, such as the development of advanced polymers and efficient blowing agents, is anticipated to underpin further market expansion and solidify its importance across diverse industrial verticals.
Dominant Markets & Segments in Hydrazine Hydrate Market
The Asia-Pacific region dominates the global hydrazine hydrate market, driven by strong demand from China and India. Within applications, the pharmaceuticals sector leads, followed by polymerization and blowing agents. Industrial-grade hydrazine hydrate commands the largest market share in terms of grade type. High-purity grades (60%-85%, 100%) are experiencing faster growth, driven by increasing demand for specialized applications.
- Key Growth Drivers in Asia-Pacific:
- Rapid industrialization and economic growth.
- Expanding pharmaceutical and agrochemical industries.
- Increasing investments in water treatment infrastructure.
- Dominant Application Segment: Pharmaceuticals.
- Dominant Grade Type: Industrial Grade.
- Fastest-Growing Purity Segment: 60%-85%, 100%
Hydrazine Hydrate Market Product Analysis
Innovations within the hydrazine hydrate product segment are primarily concentrated on achieving superior purity levels, enhancing operational safety, and formulating specialized variants tailored for distinct industrial applications. These advancements are meticulously designed to address the diverse and evolving requirements of various end-use industries, empowering manufacturers to sustain and strengthen their competitive positions. The paramount competitive advantages in this market revolve around the consistent provision of high-purity grades, unwavering product quality assurance, the establishment of resilient and reliable supply chains, and the implementation of environmentally responsible production methodologies. Furthermore, cutting-edge technological breakthroughs in both manufacturing processes and packaging solutions contribute significantly to improved safety profiles and reduced overall production costs, making the product more accessible and attractive to a broader market.
Key Drivers, Barriers & Challenges in Hydrazine Hydrate Market
Key Drivers: Increasing demand from pharmaceuticals, agrochemicals, and water treatment; technological advancements in production; and government initiatives promoting water purification.
Challenges: Stringent safety regulations; volatility in raw material prices; concerns about toxicity and environmental impact; and competition from alternative chemicals. The estimated impact of regulatory hurdles on market growth is xx% by 2033.
Growth Drivers in the Hydrazine Hydrate Market Market
A confluence of powerful factors is driving the upward trajectory of the hydrazine hydrate market. Key among these are continuous technological advancements that enhance production efficiency and product quality, the ever-increasing demand emanating from pivotal end-use industries such as pharmaceuticals and agrochemicals, and the supportive framework provided by favorable government regulations in many regions. The realization of economies of scale in manufacturing, coupled with the strategic reduction of production costs, further amplifies market growth. Moreover, the escalating demand for high-purity grades, driven by stringent quality requirements in specialized applications, acts as a significant stimulus for market expansion.
Challenges Impacting Hydrazine Hydrate Market Growth
The growth of the hydrazine hydrate market is not without its hurdles. Stringent environmental regulations and compliance requirements pose a significant challenge, necessitating substantial investments in safety and waste management. Fluctuations in the prices of key raw materials can directly impact production costs and profitability. The inherent hazardous nature of hydrazine hydrate, coupled with the associated safety concerns, demands rigorous handling protocols and specialized infrastructure, which can add to operational complexity and expense. Furthermore, the competitive pressures exerted by alternative or substitute chemicals in certain applications necessitate continuous innovation and cost-competitiveness. Supply chain disruptions, whether due to geopolitical factors, natural disasters, or logistical complexities, can also severely impact market performance and product availability.
Key Players Shaping the Hydrazine Hydrate Market Market
- Arrow Fine Chemicals
- Yibin Tianyuan Group Co Ltd
- HAIHANG INDUSTRY CO LTD
- ZEEL PRODUCT
- NIPPON CARBIDE INDUSTRIES CO INC
- Hangzhou Dayangchem Co Ltd
- LANXESS
- Hunan Zhuzhou Chemical Industry Group
- Arkema Group
- Weifang Yaxing Chemical Co Ltd
- Capot Chemical Co Ltd
- Matrix Fine Chemicals GmbH
- Lonza
- Toronto Research Chemicals
- Otsuka-MGC Chemical Company Inc
- Anbros Consultants And Engineers
- Japan Finechem Inc
Significant Hydrazine Hydrate Market Industry Milestones
- October 2022: Gujarat Alkalies and Chemicals Ltd. (GACL) announces the commencement of hydrazine hydrate production at its new plant in Gujarat, India, significantly reducing the country's reliance on imports.
- November 2022: Matrix Fine Chemicals establishes a new warehousing facility in Southern Germany, enhancing its logistics capabilities for handling hazardous materials.
Future Outlook for Hydrazine Hydrate Market Market
The Hydrazine Hydrate market is strategically positioned for sustained and robust growth in the foreseeable future. This optimistic outlook is underpinned by a consistent drive for innovation across the value chain, the continuous exploration and expansion into new and diverse applications, and the unwavering increasing demand from its core industrial sectors. Strategic partnerships and collaborations are expected to play a crucial role in market development, fostering synergistic growth opportunities. Significant capacity expansions by key manufacturers will be essential to meet the anticipated surge in demand. A heightened focus on sustainability and the development of greener production processes will also be a defining characteristic of the future market landscape, aligning with global environmental imperatives. The market presents substantial and lucrative opportunities for companies that are dedicated to producing high-purity products and developing specialized formulations tailored for niche and high-growth applications. The projected market value in 2033 is estimated to reach approximately [Insert Specific Market Value Here, e.g., 1,200 Million].
Hydrazine Hydrate Market Segmentation
-
1. Application
- 1.1. Pharmaceuticals
- 1.2. Polymerization and Blowing Agents
- 1.3. Agrochemicals
- 1.4. Water Treatment
- 1.5. Other Applications
Hydrazine Hydrate Market Segmentation By Geography
-
1. Asia Pacific
- 1.1. China
- 1.2. India
- 1.3. Japan
- 1.4. South Korea
- 1.5. Rest of Asia Pacific
-
2. North America
- 2.1. United States
- 2.2. Canada
- 2.3. Mexico
-
3. Europe
- 3.1. Germany
- 3.2. United Kingdom
- 3.3. Italy
- 3.4. France
- 3.5. Rest of Europe
-
4. South America
- 4.1. Brazil
- 4.2. Argentina
- 4.3. Rest of South America
-
5. Middle East and Africa
- 5.1. Saudi Arabia
- 5.2. South Africa
- 5.3. Rest of Middle East and Africa
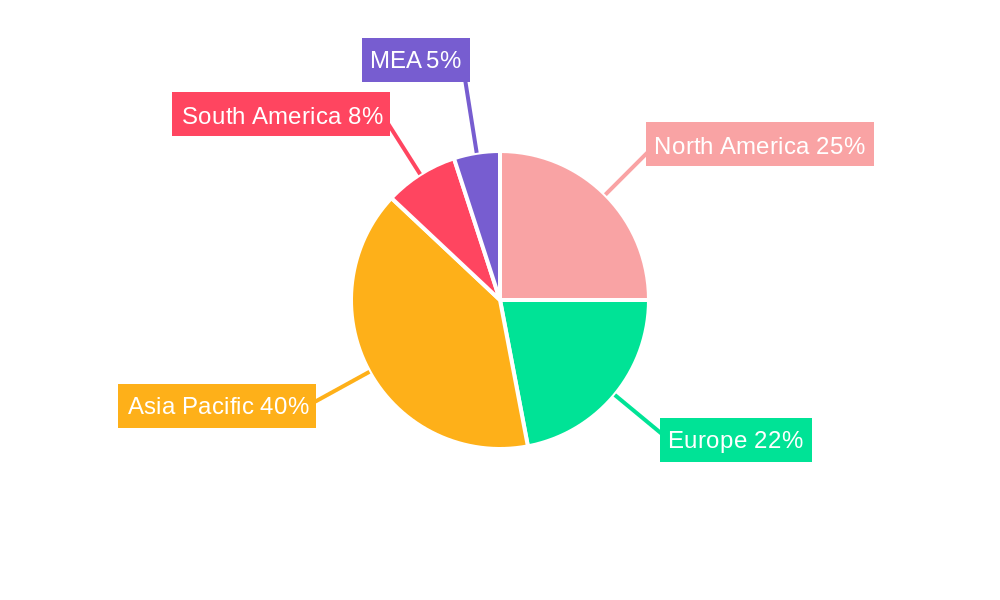
Hydrazine Hydrate Market Regional Market Share
Geographic Coverage of Hydrazine Hydrate Market
Hydrazine Hydrate Market REPORT HIGHLIGHTS
| Aspects | Details |
|---|---|
| Study Period | 2020-2034 |
| Base Year | 2025 |
| Estimated Year | 2026 |
| Forecast Period | 2026-2034 |
| Historical Period | 2020-2025 |
| Growth Rate | CAGR of 5.9% from 2020-2034 |
| Segmentation |
|
Table of Contents
- 1. Introduction
- 1.1. Research Scope
- 1.2. Market Segmentation
- 1.3. Research Objective
- 1.4. Definitions and Assumptions
- 2. Executive Summary
- 2.1. Market Snapshot
- 3. Market Dynamics
- 3.1. Market Drivers
- 3.2. Market Restrains
- 3.3. Market Trends
- 3.4. Market Opportunities
- 4. Market Factor Analysis
- 4.1. Porters Five Forces
- 4.1.1. Bargaining Power of Suppliers
- 4.1.2. Bargaining Power of Buyers
- 4.1.3. Threat of New Entrants
- 4.1.4. Threat of Substitutes
- 4.1.5. Competitive Rivalry
- 4.2. PESTEL analysis
- 4.3. BCG Analysis
- 4.3.1. Stars (High Growth, High Market Share)
- 4.3.2. Cash Cows (Low Growth, High Market Share)
- 4.3.3. Question Mark (High Growth, Low Market Share)
- 4.3.4. Dogs (Low Growth, Low Market Share)
- 4.4. Ansoff Matrix Analysis
- 4.5. Supply Chain Analysis
- 4.6. Regulatory Landscape
- 4.7. Current Market Potential and Opportunity Assessment (TAM–SAM–SOM Framework)
- 4.8. TIR Analyst Note
- 4.1. Porters Five Forces
- 5. Market Analysis, Insights and Forecast 2021-2033
- 5.1. Market Analysis, Insights and Forecast - by Application
- 5.1.1. Pharmaceuticals
- 5.1.2. Polymerization and Blowing Agents
- 5.1.3. Agrochemicals
- 5.1.4. Water Treatment
- 5.1.5. Other Applications
- 5.2. Market Analysis, Insights and Forecast - by Region
- 5.2.1. Asia Pacific
- 5.2.2. North America
- 5.2.3. Europe
- 5.2.4. South America
- 5.2.5. Middle East and Africa
- 5.1. Market Analysis, Insights and Forecast - by Application
- 6. Global Hydrazine Hydrate Market Analysis, Insights and Forecast, 2021-2033
- 6.1. Market Analysis, Insights and Forecast - by Application
- 6.1.1. Pharmaceuticals
- 6.1.2. Polymerization and Blowing Agents
- 6.1.3. Agrochemicals
- 6.1.4. Water Treatment
- 6.1.5. Other Applications
- 6.1. Market Analysis, Insights and Forecast - by Application
- 7. Asia Pacific Hydrazine Hydrate Market Analysis, Insights and Forecast, 2020-2032
- 7.1. Market Analysis, Insights and Forecast - by Application
- 7.1.1. Pharmaceuticals
- 7.1.2. Polymerization and Blowing Agents
- 7.1.3. Agrochemicals
- 7.1.4. Water Treatment
- 7.1.5. Other Applications
- 7.1. Market Analysis, Insights and Forecast - by Application
- 8. North America Hydrazine Hydrate Market Analysis, Insights and Forecast, 2020-2032
- 8.1. Market Analysis, Insights and Forecast - by Application
- 8.1.1. Pharmaceuticals
- 8.1.2. Polymerization and Blowing Agents
- 8.1.3. Agrochemicals
- 8.1.4. Water Treatment
- 8.1.5. Other Applications
- 8.1. Market Analysis, Insights and Forecast - by Application
- 9. Europe Hydrazine Hydrate Market Analysis, Insights and Forecast, 2020-2032
- 9.1. Market Analysis, Insights and Forecast - by Application
- 9.1.1. Pharmaceuticals
- 9.1.2. Polymerization and Blowing Agents
- 9.1.3. Agrochemicals
- 9.1.4. Water Treatment
- 9.1.5. Other Applications
- 9.1. Market Analysis, Insights and Forecast - by Application
- 10. South America Hydrazine Hydrate Market Analysis, Insights and Forecast, 2020-2032
- 10.1. Market Analysis, Insights and Forecast - by Application
- 10.1.1. Pharmaceuticals
- 10.1.2. Polymerization and Blowing Agents
- 10.1.3. Agrochemicals
- 10.1.4. Water Treatment
- 10.1.5. Other Applications
- 10.1. Market Analysis, Insights and Forecast - by Application
- 11. Middle East and Africa Hydrazine Hydrate Market Analysis, Insights and Forecast, 2020-2032
- 11.1. Market Analysis, Insights and Forecast - by Application
- 11.1.1. Pharmaceuticals
- 11.1.2. Polymerization and Blowing Agents
- 11.1.3. Agrochemicals
- 11.1.4. Water Treatment
- 11.1.5. Other Applications
- 11.1. Market Analysis, Insights and Forecast - by Application
- 12. Competitive Analysis
- 12.1. Company Profiles
- 12.1.1 Arrow Fine Chemicals
- 12.1.1.1. Company Overview
- 12.1.1.2. Products
- 12.1.1.3. Company Financials
- 12.1.1.4. SWOT Analysis
- 12.1.2 Yibin Tianyuan Group Co Ltd
- 12.1.2.1. Company Overview
- 12.1.2.2. Products
- 12.1.2.3. Company Financials
- 12.1.2.4. SWOT Analysis
- 12.1.3 HAIHANG INDUSTRY CO LTD
- 12.1.3.1. Company Overview
- 12.1.3.2. Products
- 12.1.3.3. Company Financials
- 12.1.3.4. SWOT Analysis
- 12.1.4 ZEEL PRODUCT
- 12.1.4.1. Company Overview
- 12.1.4.2. Products
- 12.1.4.3. Company Financials
- 12.1.4.4. SWOT Analysis
- 12.1.5 NIPPON CARBIDE INDUSTRIES CO INC
- 12.1.5.1. Company Overview
- 12.1.5.2. Products
- 12.1.5.3. Company Financials
- 12.1.5.4. SWOT Analysis
- 12.1.6 Hangzhou Dayangchem Co Ltd
- 12.1.6.1. Company Overview
- 12.1.6.2. Products
- 12.1.6.3. Company Financials
- 12.1.6.4. SWOT Analysis
- 12.1.7 LANXESS
- 12.1.7.1. Company Overview
- 12.1.7.2. Products
- 12.1.7.3. Company Financials
- 12.1.7.4. SWOT Analysis
- 12.1.8 Hunan Zhuzhou Chemical Industry Group
- 12.1.8.1. Company Overview
- 12.1.8.2. Products
- 12.1.8.3. Company Financials
- 12.1.8.4. SWOT Analysis
- 12.1.9 Arkema Group
- 12.1.9.1. Company Overview
- 12.1.9.2. Products
- 12.1.9.3. Company Financials
- 12.1.9.4. SWOT Analysis
- 12.1.10 Weifang Yaxing Chemical Co Ltd
- 12.1.10.1. Company Overview
- 12.1.10.2. Products
- 12.1.10.3. Company Financials
- 12.1.10.4. SWOT Analysis
- 12.1.11 Capot Chemical Co Ltd
- 12.1.11.1. Company Overview
- 12.1.11.2. Products
- 12.1.11.3. Company Financials
- 12.1.11.4. SWOT Analysis
- 12.1.12 Matrix Fine Chemicals GmbH
- 12.1.12.1. Company Overview
- 12.1.12.2. Products
- 12.1.12.3. Company Financials
- 12.1.12.4. SWOT Analysis
- 12.1.13 Lonza
- 12.1.13.1. Company Overview
- 12.1.13.2. Products
- 12.1.13.3. Company Financials
- 12.1.13.4. SWOT Analysis
- 12.1.14 Toronto Research Chemicals
- 12.1.14.1. Company Overview
- 12.1.14.2. Products
- 12.1.14.3. Company Financials
- 12.1.14.4. SWOT Analysis
- 12.1.15 Otsuka-MGC Chemical Company Inc
- 12.1.15.1. Company Overview
- 12.1.15.2. Products
- 12.1.15.3. Company Financials
- 12.1.15.4. SWOT Analysis
- 12.1.16 Anbros Consultants And Engineers
- 12.1.16.1. Company Overview
- 12.1.16.2. Products
- 12.1.16.3. Company Financials
- 12.1.16.4. SWOT Analysis
- 12.1.17 Japan Finechem Inc
- 12.1.17.1. Company Overview
- 12.1.17.2. Products
- 12.1.17.3. Company Financials
- 12.1.17.4. SWOT Analysis
- 12.1.1 Arrow Fine Chemicals
- 12.2. Market Entropy
- 12.2.1 Company's Key Areas Served
- 12.2.2 Recent Developments
- 12.3. Company Market Share Analysis 2025
- 12.3.1 Top 5 Companies Market Share Analysis
- 12.3.2 Top 3 Companies Market Share Analysis
- 12.4. List of Potential Customers
- 13. Research Methodology
List of Figures
- Figure 1: Global Hydrazine Hydrate Market Revenue Breakdown (Million, %) by Region 2025 & 2033
- Figure 2: Global Hydrazine Hydrate Market Volume Breakdown (K Tons, %) by Region 2025 & 2033
- Figure 3: Asia Pacific Hydrazine Hydrate Market Revenue (Million), by Application 2025 & 2033
- Figure 4: Asia Pacific Hydrazine Hydrate Market Volume (K Tons), by Application 2025 & 2033
- Figure 5: Asia Pacific Hydrazine Hydrate Market Revenue Share (%), by Application 2025 & 2033
- Figure 6: Asia Pacific Hydrazine Hydrate Market Volume Share (%), by Application 2025 & 2033
- Figure 7: Asia Pacific Hydrazine Hydrate Market Revenue (Million), by Country 2025 & 2033
- Figure 8: Asia Pacific Hydrazine Hydrate Market Volume (K Tons), by Country 2025 & 2033
- Figure 9: Asia Pacific Hydrazine Hydrate Market Revenue Share (%), by Country 2025 & 2033
- Figure 10: Asia Pacific Hydrazine Hydrate Market Volume Share (%), by Country 2025 & 2033
- Figure 11: North America Hydrazine Hydrate Market Revenue (Million), by Application 2025 & 2033
- Figure 12: North America Hydrazine Hydrate Market Volume (K Tons), by Application 2025 & 2033
- Figure 13: North America Hydrazine Hydrate Market Revenue Share (%), by Application 2025 & 2033
- Figure 14: North America Hydrazine Hydrate Market Volume Share (%), by Application 2025 & 2033
- Figure 15: North America Hydrazine Hydrate Market Revenue (Million), by Country 2025 & 2033
- Figure 16: North America Hydrazine Hydrate Market Volume (K Tons), by Country 2025 & 2033
- Figure 17: North America Hydrazine Hydrate Market Revenue Share (%), by Country 2025 & 2033
- Figure 18: North America Hydrazine Hydrate Market Volume Share (%), by Country 2025 & 2033
- Figure 19: Europe Hydrazine Hydrate Market Revenue (Million), by Application 2025 & 2033
- Figure 20: Europe Hydrazine Hydrate Market Volume (K Tons), by Application 2025 & 2033
- Figure 21: Europe Hydrazine Hydrate Market Revenue Share (%), by Application 2025 & 2033
- Figure 22: Europe Hydrazine Hydrate Market Volume Share (%), by Application 2025 & 2033
- Figure 23: Europe Hydrazine Hydrate Market Revenue (Million), by Country 2025 & 2033
- Figure 24: Europe Hydrazine Hydrate Market Volume (K Tons), by Country 2025 & 2033
- Figure 25: Europe Hydrazine Hydrate Market Revenue Share (%), by Country 2025 & 2033
- Figure 26: Europe Hydrazine Hydrate Market Volume Share (%), by Country 2025 & 2033
- Figure 27: South America Hydrazine Hydrate Market Revenue (Million), by Application 2025 & 2033
- Figure 28: South America Hydrazine Hydrate Market Volume (K Tons), by Application 2025 & 2033
- Figure 29: South America Hydrazine Hydrate Market Revenue Share (%), by Application 2025 & 2033
- Figure 30: South America Hydrazine Hydrate Market Volume Share (%), by Application 2025 & 2033
- Figure 31: South America Hydrazine Hydrate Market Revenue (Million), by Country 2025 & 2033
- Figure 32: South America Hydrazine Hydrate Market Volume (K Tons), by Country 2025 & 2033
- Figure 33: South America Hydrazine Hydrate Market Revenue Share (%), by Country 2025 & 2033
- Figure 34: South America Hydrazine Hydrate Market Volume Share (%), by Country 2025 & 2033
- Figure 35: Middle East and Africa Hydrazine Hydrate Market Revenue (Million), by Application 2025 & 2033
- Figure 36: Middle East and Africa Hydrazine Hydrate Market Volume (K Tons), by Application 2025 & 2033
- Figure 37: Middle East and Africa Hydrazine Hydrate Market Revenue Share (%), by Application 2025 & 2033
- Figure 38: Middle East and Africa Hydrazine Hydrate Market Volume Share (%), by Application 2025 & 2033
- Figure 39: Middle East and Africa Hydrazine Hydrate Market Revenue (Million), by Country 2025 & 2033
- Figure 40: Middle East and Africa Hydrazine Hydrate Market Volume (K Tons), by Country 2025 & 2033
- Figure 41: Middle East and Africa Hydrazine Hydrate Market Revenue Share (%), by Country 2025 & 2033
- Figure 42: Middle East and Africa Hydrazine Hydrate Market Volume Share (%), by Country 2025 & 2033
List of Tables
- Table 1: Global Hydrazine Hydrate Market Revenue Million Forecast, by Application 2020 & 2033
- Table 2: Global Hydrazine Hydrate Market Volume K Tons Forecast, by Application 2020 & 2033
- Table 3: Global Hydrazine Hydrate Market Revenue Million Forecast, by Region 2020 & 2033
- Table 4: Global Hydrazine Hydrate Market Volume K Tons Forecast, by Region 2020 & 2033
- Table 5: Global Hydrazine Hydrate Market Revenue Million Forecast, by Application 2020 & 2033
- Table 6: Global Hydrazine Hydrate Market Volume K Tons Forecast, by Application 2020 & 2033
- Table 7: Global Hydrazine Hydrate Market Revenue Million Forecast, by Country 2020 & 2033
- Table 8: Global Hydrazine Hydrate Market Volume K Tons Forecast, by Country 2020 & 2033
- Table 9: China Hydrazine Hydrate Market Revenue (Million) Forecast, by Application 2020 & 2033
- Table 10: China Hydrazine Hydrate Market Volume (K Tons) Forecast, by Application 2020 & 2033
- Table 11: India Hydrazine Hydrate Market Revenue (Million) Forecast, by Application 2020 & 2033
- Table 12: India Hydrazine Hydrate Market Volume (K Tons) Forecast, by Application 2020 & 2033
- Table 13: Japan Hydrazine Hydrate Market Revenue (Million) Forecast, by Application 2020 & 2033
- Table 14: Japan Hydrazine Hydrate Market Volume (K Tons) Forecast, by Application 2020 & 2033
- Table 15: South Korea Hydrazine Hydrate Market Revenue (Million) Forecast, by Application 2020 & 2033
- Table 16: South Korea Hydrazine Hydrate Market Volume (K Tons) Forecast, by Application 2020 & 2033
- Table 17: Rest of Asia Pacific Hydrazine Hydrate Market Revenue (Million) Forecast, by Application 2020 & 2033
- Table 18: Rest of Asia Pacific Hydrazine Hydrate Market Volume (K Tons) Forecast, by Application 2020 & 2033
- Table 19: Global Hydrazine Hydrate Market Revenue Million Forecast, by Application 2020 & 2033
- Table 20: Global Hydrazine Hydrate Market Volume K Tons Forecast, by Application 2020 & 2033
- Table 21: Global Hydrazine Hydrate Market Revenue Million Forecast, by Country 2020 & 2033
- Table 22: Global Hydrazine Hydrate Market Volume K Tons Forecast, by Country 2020 & 2033
- Table 23: United States Hydrazine Hydrate Market Revenue (Million) Forecast, by Application 2020 & 2033
- Table 24: United States Hydrazine Hydrate Market Volume (K Tons) Forecast, by Application 2020 & 2033
- Table 25: Canada Hydrazine Hydrate Market Revenue (Million) Forecast, by Application 2020 & 2033
- Table 26: Canada Hydrazine Hydrate Market Volume (K Tons) Forecast, by Application 2020 & 2033
- Table 27: Mexico Hydrazine Hydrate Market Revenue (Million) Forecast, by Application 2020 & 2033
- Table 28: Mexico Hydrazine Hydrate Market Volume (K Tons) Forecast, by Application 2020 & 2033
- Table 29: Global Hydrazine Hydrate Market Revenue Million Forecast, by Application 2020 & 2033
- Table 30: Global Hydrazine Hydrate Market Volume K Tons Forecast, by Application 2020 & 2033
- Table 31: Global Hydrazine Hydrate Market Revenue Million Forecast, by Country 2020 & 2033
- Table 32: Global Hydrazine Hydrate Market Volume K Tons Forecast, by Country 2020 & 2033
- Table 33: Germany Hydrazine Hydrate Market Revenue (Million) Forecast, by Application 2020 & 2033
- Table 34: Germany Hydrazine Hydrate Market Volume (K Tons) Forecast, by Application 2020 & 2033
- Table 35: United Kingdom Hydrazine Hydrate Market Revenue (Million) Forecast, by Application 2020 & 2033
- Table 36: United Kingdom Hydrazine Hydrate Market Volume (K Tons) Forecast, by Application 2020 & 2033
- Table 37: Italy Hydrazine Hydrate Market Revenue (Million) Forecast, by Application 2020 & 2033
- Table 38: Italy Hydrazine Hydrate Market Volume (K Tons) Forecast, by Application 2020 & 2033
- Table 39: France Hydrazine Hydrate Market Revenue (Million) Forecast, by Application 2020 & 2033
- Table 40: France Hydrazine Hydrate Market Volume (K Tons) Forecast, by Application 2020 & 2033
- Table 41: Rest of Europe Hydrazine Hydrate Market Revenue (Million) Forecast, by Application 2020 & 2033
- Table 42: Rest of Europe Hydrazine Hydrate Market Volume (K Tons) Forecast, by Application 2020 & 2033
- Table 43: Global Hydrazine Hydrate Market Revenue Million Forecast, by Application 2020 & 2033
- Table 44: Global Hydrazine Hydrate Market Volume K Tons Forecast, by Application 2020 & 2033
- Table 45: Global Hydrazine Hydrate Market Revenue Million Forecast, by Country 2020 & 2033
- Table 46: Global Hydrazine Hydrate Market Volume K Tons Forecast, by Country 2020 & 2033
- Table 47: Brazil Hydrazine Hydrate Market Revenue (Million) Forecast, by Application 2020 & 2033
- Table 48: Brazil Hydrazine Hydrate Market Volume (K Tons) Forecast, by Application 2020 & 2033
- Table 49: Argentina Hydrazine Hydrate Market Revenue (Million) Forecast, by Application 2020 & 2033
- Table 50: Argentina Hydrazine Hydrate Market Volume (K Tons) Forecast, by Application 2020 & 2033
- Table 51: Rest of South America Hydrazine Hydrate Market Revenue (Million) Forecast, by Application 2020 & 2033
- Table 52: Rest of South America Hydrazine Hydrate Market Volume (K Tons) Forecast, by Application 2020 & 2033
- Table 53: Global Hydrazine Hydrate Market Revenue Million Forecast, by Application 2020 & 2033
- Table 54: Global Hydrazine Hydrate Market Volume K Tons Forecast, by Application 2020 & 2033
- Table 55: Global Hydrazine Hydrate Market Revenue Million Forecast, by Country 2020 & 2033
- Table 56: Global Hydrazine Hydrate Market Volume K Tons Forecast, by Country 2020 & 2033
- Table 57: Saudi Arabia Hydrazine Hydrate Market Revenue (Million) Forecast, by Application 2020 & 2033
- Table 58: Saudi Arabia Hydrazine Hydrate Market Volume (K Tons) Forecast, by Application 2020 & 2033
- Table 59: South Africa Hydrazine Hydrate Market Revenue (Million) Forecast, by Application 2020 & 2033
- Table 60: South Africa Hydrazine Hydrate Market Volume (K Tons) Forecast, by Application 2020 & 2033
- Table 61: Rest of Middle East and Africa Hydrazine Hydrate Market Revenue (Million) Forecast, by Application 2020 & 2033
- Table 62: Rest of Middle East and Africa Hydrazine Hydrate Market Volume (K Tons) Forecast, by Application 2020 & 2033
Frequently Asked Questions
1. What is the projected Compound Annual Growth Rate (CAGR) of the Hydrazine Hydrate Market?
The projected CAGR is approximately 5.9%.
2. Which companies are prominent players in the Hydrazine Hydrate Market?
Key companies in the market include Arrow Fine Chemicals, Yibin Tianyuan Group Co Ltd, HAIHANG INDUSTRY CO LTD, ZEEL PRODUCT, NIPPON CARBIDE INDUSTRIES CO INC, Hangzhou Dayangchem Co Ltd, LANXESS, Hunan Zhuzhou Chemical Industry Group, Arkema Group, Weifang Yaxing Chemical Co Ltd, Capot Chemical Co Ltd, Matrix Fine Chemicals GmbH, Lonza, Toronto Research Chemicals, Otsuka-MGC Chemical Company Inc, Anbros Consultants And Engineers, Japan Finechem Inc.
3. What are the main segments of the Hydrazine Hydrate Market?
The market segments include Application.
4. Can you provide details about the market size?
The market size is estimated to be USD 230.3 Million as of 2022.
5. What are some drivers contributing to market growth?
Increasing Demand from Polymerization and Blowing Agents; Growing Demand from Pharmaceutical Sector.
6. What are the notable trends driving market growth?
Increasing Demand from Polymerization and Blowing Agents Segment.
7. Are there any restraints impacting market growth?
Stringent Regulations Imposed on Hydrazine Hydrate; Other Restraints.
8. Can you provide examples of recent developments in the market?
November 2022: Matrix Fine Chemicals announced that it entered a new cooperation agreement with a global logistics provider. With this acquisition, the company can use a new warehouse in southern Germany to store hazardous and non-hazardous materials.
9. What pricing options are available for accessing the report?
Pricing options include single-user, multi-user, and enterprise licenses priced at USD 4750, USD 5250, and USD 8750 respectively.
10. Is the market size provided in terms of value or volume?
The market size is provided in terms of value, measured in Million and volume, measured in K Tons.
11. Are there any specific market keywords associated with the report?
Yes, the market keyword associated with the report is "Hydrazine Hydrate Market," which aids in identifying and referencing the specific market segment covered.
12. How do I determine which pricing option suits my needs best?
The pricing options vary based on user requirements and access needs. Individual users may opt for single-user licenses, while businesses requiring broader access may choose multi-user or enterprise licenses for cost-effective access to the report.
13. Are there any additional resources or data provided in the Hydrazine Hydrate Market report?
While the report offers comprehensive insights, it's advisable to review the specific contents or supplementary materials provided to ascertain if additional resources or data are available.
14. How can I stay updated on further developments or reports in the Hydrazine Hydrate Market?
To stay informed about further developments, trends, and reports in the Hydrazine Hydrate Market, consider subscribing to industry newsletters, following relevant companies and organizations, or regularly checking reputable industry news sources and publications.
Methodology
Step 1 - Identification of Relevant Samples Size from Population Database


Step 2 - Approaches for Defining Global Market Size (Value, Volume* & Price*)

Note*: In applicable scenarios
Step 3 - Data Sources
Primary Research
- Web Analytics
- Survey Reports
- Research Institute
- Latest Research Reports
- Opinion Leaders
Secondary Research
- Annual Reports
- White Paper
- Latest Press Release
- Industry Association
- Paid Database
- Investor Presentations

Step 4 - Data Triangulation
Involves using different sources of information in order to increase the validity of a study
These sources are likely to be stakeholders in a program - participants, other researchers, program staff, other community members, and so on.
Then we put all data in single framework & apply various statistical tools to find out the dynamic on the market.
During the analysis stage, feedback from the stakeholder groups would be compared to determine areas of agreement as well as areas of divergence