

Key Insights
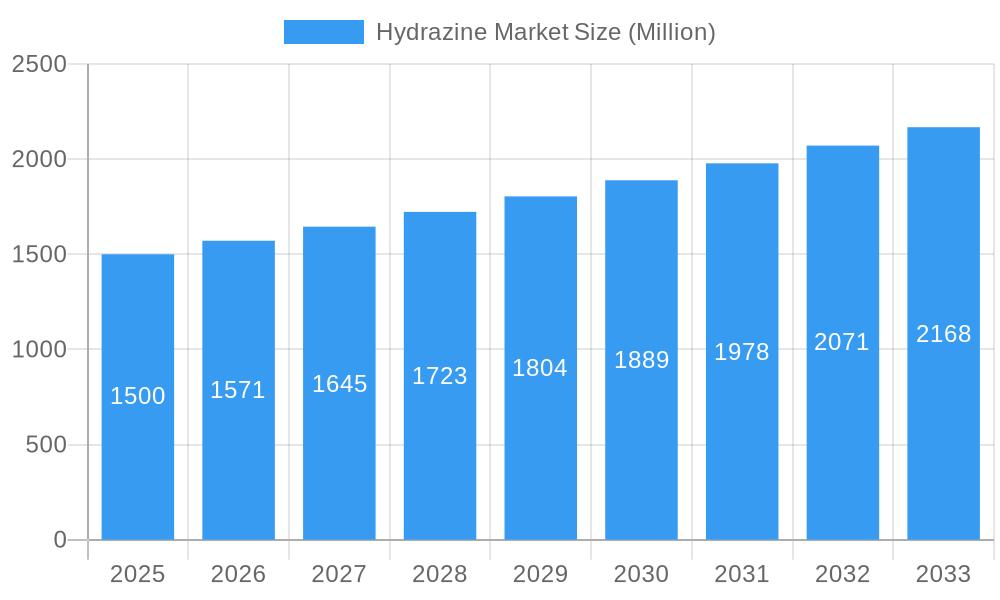
The global hydrazine market, valued at approximately 543 million in the base year of 2024, is poised for significant expansion. Projected to grow at a compound annual growth rate (CAGR) of 6% from 2024 to 2033, this growth is propelled by escalating demand across key industries. The pharmaceutical sector's utilization of hydrazine derivatives for active pharmaceutical ingredient (API) synthesis is a primary growth catalyst. Concurrently, the agrochemical industry's reliance on hydrazine as a crucial intermediate for pesticide production further fuels market advancement. The aerospace and defense sectors, driven by the consistent requirement for advanced rocket propellants, also represent a substantial market driver. While applications in corrosion inhibition and as blowing agents contribute to overall market dynamics, the dominant influence of pharmaceutical, agrochemical, and aerospace applications dictates the market's future trajectory.
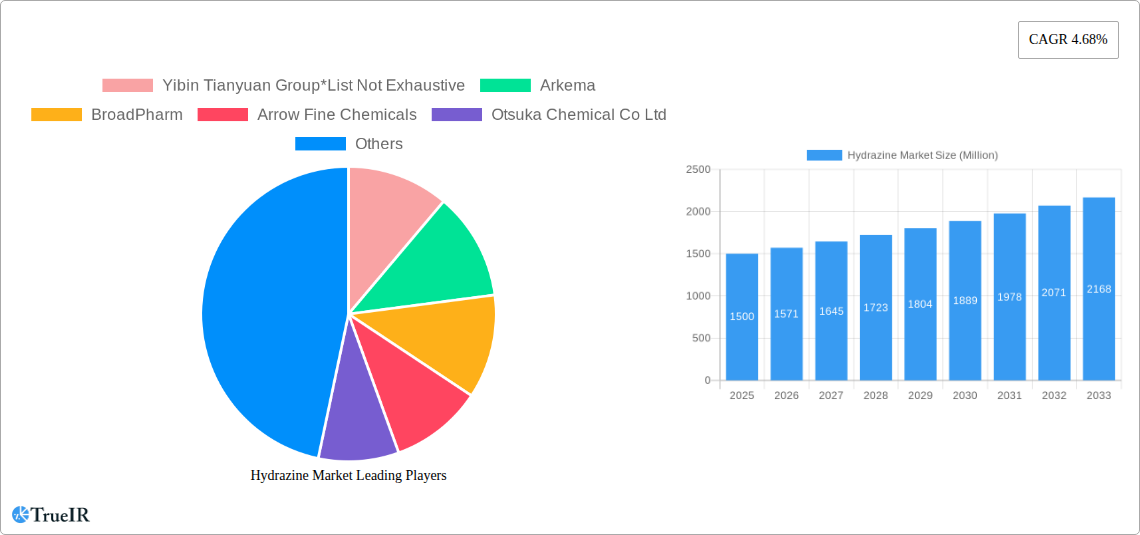
Hydrazine Market Market Size (In Million)
Geographically, market growth is expected to be widespread. The Asia-Pacific region, led by China and India, is anticipated to spearhead expansion, driven by robust industrial development and increased R&D investments in chemical manufacturing. North America and Europe will also experience notable growth, though potentially at a more measured pace, influenced by mature market conditions and rigorous regulatory frameworks. Key challenges include stringent safety regulations governing hydrazine handling and the potential development of substitute chemicals. However, continuous innovation in safer hydrazine production methodologies and exploration of novel applications in emerging technologies are expected to mitigate these restraints, ensuring sustained market expansion throughout the forecast period.
Hydrazine Market Company Market Share
Hydrazine Market: A Comprehensive Analysis (2019-2033)
This dynamic report provides a thorough examination of the Hydrazine Market, offering invaluable insights for stakeholders across the value chain. From market sizing and segmentation to competitive landscapes and future growth projections, this study covers all key aspects of this vital chemical market. The report covers the period 2019-2033, with 2025 as the base year and a forecast period of 2025-2033.
Hydrazine Market Market Structure & Competitive Landscape
The Hydrazine Market exhibits a moderately concentrated structure, with several major players commanding significant market share. The market concentration ratio (CR4) is estimated at xx% in 2025, indicating a balance between established players and emerging entrants. Innovation plays a crucial role, particularly in developing safer and more efficient production processes, and in expanding applications beyond traditional sectors. Stringent regulations regarding handling and storage, coupled with environmental concerns, significantly impact market dynamics. Product substitutes, while limited, exist in specific niche applications.
- Key Market Segments: The market is segmented by type (Hydrazine Hydrate, Hydrazine Nitrate, Hydrazine Sulfate, Other Types), application (Corrosion Inhibitor, Explosives, Rocket Fuel, Medicinal Ingredients, Precursor to Pesticides, Blowing Agent, Other Applications), and end-user industry (Pharmaceuticals, Agrochemicals, Industrial, Other End-user Industries).
- Competitive Dynamics: The competitive landscape is characterized by a mix of established chemical giants and specialized companies. Key players include Yibin Tianyuan Group, Arkema, BroadPharm, Arrow Fine Chemicals, Otsuka Chemical Co Ltd, Tokyo Chemical Industry Co Ltd, NIPPON CARBIDE INDUSTRIES CO INC, LANXESS, Innova Corporate, ACURO ORGANICS LIMITED, and MERU CHEM PVT LTD. M&A activity has been relatively moderate in recent years, with xx deals recorded between 2019 and 2024, largely driven by efforts to expand product portfolios and geographic reach.
Hydrazine Market Market Trends & Opportunities
The global Hydrazine Market is projected to experience significant growth, with a Compound Annual Growth Rate (CAGR) of xx% during the forecast period (2025-2033). This expansion is fueled by a surge in demand from diverse end-use sectors, particularly pharmaceuticals and agrochemicals. Technological advancements in production methods are enhancing efficiency and reducing costs, making hydrazine more accessible and cost-effective. Consumer preferences are shifting towards environmentally friendly alternatives, pushing companies to develop sustainable production and usage practices. Intensifying competition among leading manufacturers is driving innovation and price optimization, further shaping market dynamics. Market penetration rates for specific applications, like medicinal ingredients, are expected to rise steadily during the forecast period, reaching xx% by 2033. This is driven by advancements in drug discovery and the increasing use of hydrazine as a key intermediate.
Dominant Markets & Segments in Hydrazine Market
The Hydrazine Hydrate segment holds the largest market share by type, owing to its versatility and wide-ranging applications. Geographically, the Asia-Pacific region dominates the market, driven by robust industrial growth and increasing demand from emerging economies. Within the applications segment, the pharmaceuticals sector shows the highest growth rate. The industrial sector, while mature, continues to exhibit significant demand driven by applications in water treatment and other industrial processes.
- Key Growth Drivers:
- Increasing demand for pharmaceuticals and agrochemicals.
- Growth of the aerospace and defense industries (rocket fuel).
- Expansion of industrial applications (water treatment, blowing agents).
- Technological advancements in production processes leading to cost reduction.
Detailed Analysis of Market Dominance: The Asia-Pacific region's dominance stems from its large and rapidly growing pharmaceutical and industrial sectors. Government initiatives promoting industrial development and agricultural modernization further contribute to market expansion in the region. North America and Europe also represent substantial markets, though their growth is expected to be relatively slower than in Asia-Pacific due to market maturity.
Hydrazine Market Product Analysis
Hydrazine derivatives, such as hydrazine hydrate and hydrazine sulfate, are the most commonly used forms. Recent technological advancements have focused on enhancing safety and efficiency in handling and production. The development of more environmentally friendly processes is an important area of focus for several manufacturers. The market fit for hydrazine is strong across a variety of industries, especially where its unique properties as a reducing agent and blowing agent are critical. This is bolstered by ongoing research into new applications and derivatives.
Key Drivers, Barriers & Challenges in Hydrazine Market
Key Drivers: The increasing demand from the pharmaceutical and agrochemical industries is a major driver, along with its use as a critical intermediate in various chemical processes. Advancements in production technology are lowering costs and making it more accessible. Growth in emerging markets is further expanding opportunities.
Challenges: Stringent safety and environmental regulations pose a significant challenge, especially concerning handling and disposal. Supply chain disruptions and fluctuating raw material prices can impact profitability. Intense competition among producers further complicates the market. The market faces potential challenges from the development of safer and more sustainable alternatives, though this is currently limited.
Growth Drivers in the Hydrazine Market Market
The Hydrazine market is primarily driven by the growing demand from the pharmaceutical and agricultural sectors. Advances in production technology have lowered manufacturing costs, while the expansion of applications into various industries, such as water treatment and blowing agents, creates additional growth opportunities. Government regulations and environmental concerns are shaping market dynamics and encouraging sustainable production methods.
Challenges Impacting Hydrazine Market Growth
Stringent regulatory frameworks concerning handling and disposal of hydrazine create significant barriers to market expansion. Fluctuating raw material prices impact manufacturing costs, and supply chain disruptions can lead to production delays and increased prices. The inherent toxicity of hydrazine requires stringent safety protocols, leading to increased operational costs.
Key Players Shaping the Hydrazine Market Market
- Yibin Tianyuan Group
- Arkema
- BroadPharm
- Arrow Fine Chemicals
- Otsuka Chemical Co Ltd
- Tokyo Chemical Industry Co Ltd
- NIPPON CARBIDE INDUSTRIES CO INC
- LANXESS
- Innova Corporate
- ACURO ORGANICS LIMITED
- MERU CHEM PVT LTD
Significant Hydrazine Market Industry Milestones
- March 2023: Otsuka Chemical Co., Ltd. and Yokogawa Electric Corporation established SynCrest Inc., a CRDMO, highlighting the growing importance of hydrazine in pharmaceutical manufacturing.
- May 2023: SynCrest Inc. announced its services, further emphasizing the growing demand for hydrazine in pharmaceutical development and manufacturing across global markets. These developments underscore the growing reliance on hydrazine in specialized chemical manufacturing.
Future Outlook for Hydrazine Market Market
The Hydrazine Market is poised for continued growth, fueled by ongoing demand from key sectors and advancements in production technology. Strategic investments in R&D, coupled with a focus on sustainable practices, will create opportunities for market expansion. Emerging applications in specialized fields are likely to further drive market growth, creating new avenues for innovation and development. The market will remain influenced by regulatory and environmental concerns, necessitating a shift towards more eco-friendly production and utilization methods.
Hydrazine Market Segmentation
-
1. Type
- 1.1. Hydrazine Hydrate
- 1.2. Hydrazine Nitrate
- 1.3. Hydrazine Sulfate
- 1.4. Other Types (Hydrazine Carbonate, etc.)
-
2. Application
- 2.1. Corrosion Inhibitor
- 2.2. Explosives
- 2.3. Rocket Fuel
- 2.4. Medicinal Ingredients
- 2.5. Precursor to Pesticides
- 2.6. Blowing Agent
- 2.7. Other Ap
-
3. End-user Industry
- 3.1. Pharmaceuticals
- 3.2. Agrochemicals
- 3.3. Industrial
- 3.4. Other End-user Industries (Water Treatment, etc.)
Hydrazine Market Segmentation By Geography
-
1. Asia Pacific
- 1.1. China
- 1.2. India
- 1.3. Japan
- 1.4. South Korea
- 1.5. Rest of Asia Pacific
-
2. North America
- 2.1. United States
- 2.2. Canada
- 2.3. Mexico
-
3. Europe
- 3.1. Germany
- 3.2. United Kingdom
- 3.3. Italy
- 3.4. France
- 3.5. Rest of Europe
-
4. South America
- 4.1. Brazil
- 4.2. Argentina
- 4.3. Rest of South America
-
5. Middle East and Africa
- 5.1. Saudi Arabia
- 5.2. South Africa
- 5.3. Rest of Middle East and Africa
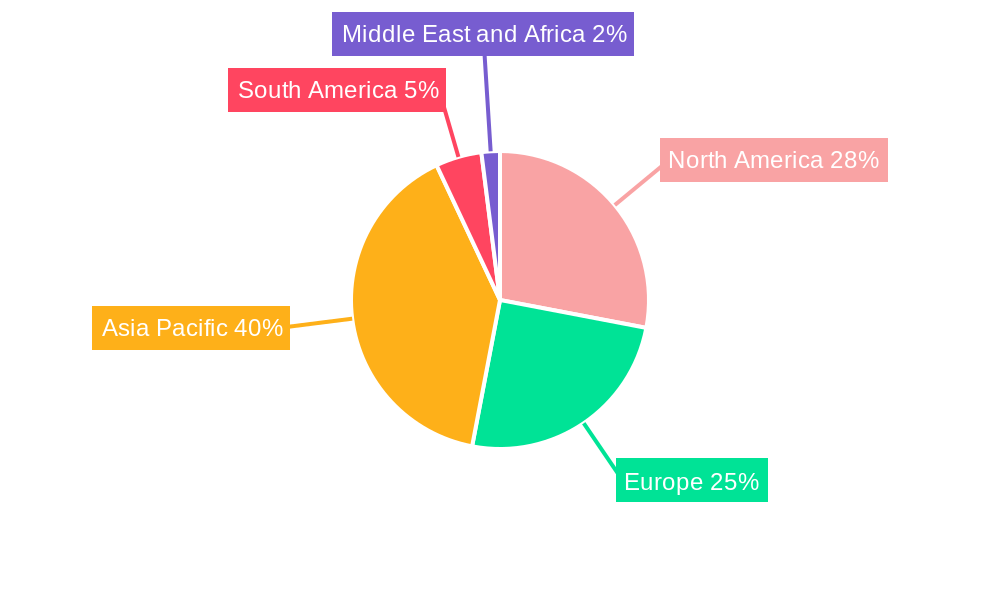
Hydrazine Market Regional Market Share
Geographic Coverage of Hydrazine Market
Hydrazine Market REPORT HIGHLIGHTS
| Aspects | Details |
|---|---|
| Study Period | 2020-2034 |
| Base Year | 2025 |
| Estimated Year | 2026 |
| Forecast Period | 2026-2034 |
| Historical Period | 2020-2025 |
| Growth Rate | CAGR of 6% from 2020-2034 |
| Segmentation |
|
Table of Contents
- 1. Introduction
- 1.1. Research Scope
- 1.2. Market Segmentation
- 1.3. Research Objective
- 1.4. Definitions and Assumptions
- 2. Executive Summary
- 2.1. Market Snapshot
- 3. Market Dynamics
- 3.1. Market Drivers
- 3.2. Market Restrains
- 3.3. Market Trends
- 3.4. Market Opportunities
- 4. Market Factor Analysis
- 4.1. Porters Five Forces
- 4.1.1. Bargaining Power of Suppliers
- 4.1.2. Bargaining Power of Buyers
- 4.1.3. Threat of New Entrants
- 4.1.4. Threat of Substitutes
- 4.1.5. Competitive Rivalry
- 4.2. PESTEL analysis
- 4.3. BCG Analysis
- 4.3.1. Stars (High Growth, High Market Share)
- 4.3.2. Cash Cows (Low Growth, High Market Share)
- 4.3.3. Question Mark (High Growth, Low Market Share)
- 4.3.4. Dogs (Low Growth, Low Market Share)
- 4.4. Ansoff Matrix Analysis
- 4.5. Supply Chain Analysis
- 4.6. Regulatory Landscape
- 4.7. Current Market Potential and Opportunity Assessment (TAM–SAM–SOM Framework)
- 4.8. TIR Analyst Note
- 4.1. Porters Five Forces
- 5. Market Analysis, Insights and Forecast 2021-2033
- 5.1. Market Analysis, Insights and Forecast - by Type
- 5.1.1. Hydrazine Hydrate
- 5.1.2. Hydrazine Nitrate
- 5.1.3. Hydrazine Sulfate
- 5.1.4. Other Types (Hydrazine Carbonate, etc.)
- 5.2. Market Analysis, Insights and Forecast - by Application
- 5.2.1. Corrosion Inhibitor
- 5.2.2. Explosives
- 5.2.3. Rocket Fuel
- 5.2.4. Medicinal Ingredients
- 5.2.5. Precursor to Pesticides
- 5.2.6. Blowing Agent
- 5.2.7. Other Ap
- 5.3. Market Analysis, Insights and Forecast - by End-user Industry
- 5.3.1. Pharmaceuticals
- 5.3.2. Agrochemicals
- 5.3.3. Industrial
- 5.3.4. Other End-user Industries (Water Treatment, etc.)
- 5.4. Market Analysis, Insights and Forecast - by Region
- 5.4.1. Asia Pacific
- 5.4.2. North America
- 5.4.3. Europe
- 5.4.4. South America
- 5.4.5. Middle East and Africa
- 5.1. Market Analysis, Insights and Forecast - by Type
- 6. Global Hydrazine Market Analysis, Insights and Forecast, 2021-2033
- 6.1. Market Analysis, Insights and Forecast - by Type
- 6.1.1. Hydrazine Hydrate
- 6.1.2. Hydrazine Nitrate
- 6.1.3. Hydrazine Sulfate
- 6.1.4. Other Types (Hydrazine Carbonate, etc.)
- 6.2. Market Analysis, Insights and Forecast - by Application
- 6.2.1. Corrosion Inhibitor
- 6.2.2. Explosives
- 6.2.3. Rocket Fuel
- 6.2.4. Medicinal Ingredients
- 6.2.5. Precursor to Pesticides
- 6.2.6. Blowing Agent
- 6.2.7. Other Ap
- 6.3. Market Analysis, Insights and Forecast - by End-user Industry
- 6.3.1. Pharmaceuticals
- 6.3.2. Agrochemicals
- 6.3.3. Industrial
- 6.3.4. Other End-user Industries (Water Treatment, etc.)
- 6.1. Market Analysis, Insights and Forecast - by Type
- 7. Asia Pacific Hydrazine Market Analysis, Insights and Forecast, 2020-2032
- 7.1. Market Analysis, Insights and Forecast - by Type
- 7.1.1. Hydrazine Hydrate
- 7.1.2. Hydrazine Nitrate
- 7.1.3. Hydrazine Sulfate
- 7.1.4. Other Types (Hydrazine Carbonate, etc.)
- 7.2. Market Analysis, Insights and Forecast - by Application
- 7.2.1. Corrosion Inhibitor
- 7.2.2. Explosives
- 7.2.3. Rocket Fuel
- 7.2.4. Medicinal Ingredients
- 7.2.5. Precursor to Pesticides
- 7.2.6. Blowing Agent
- 7.2.7. Other Ap
- 7.3. Market Analysis, Insights and Forecast - by End-user Industry
- 7.3.1. Pharmaceuticals
- 7.3.2. Agrochemicals
- 7.3.3. Industrial
- 7.3.4. Other End-user Industries (Water Treatment, etc.)
- 7.1. Market Analysis, Insights and Forecast - by Type
- 8. North America Hydrazine Market Analysis, Insights and Forecast, 2020-2032
- 8.1. Market Analysis, Insights and Forecast - by Type
- 8.1.1. Hydrazine Hydrate
- 8.1.2. Hydrazine Nitrate
- 8.1.3. Hydrazine Sulfate
- 8.1.4. Other Types (Hydrazine Carbonate, etc.)
- 8.2. Market Analysis, Insights and Forecast - by Application
- 8.2.1. Corrosion Inhibitor
- 8.2.2. Explosives
- 8.2.3. Rocket Fuel
- 8.2.4. Medicinal Ingredients
- 8.2.5. Precursor to Pesticides
- 8.2.6. Blowing Agent
- 8.2.7. Other Ap
- 8.3. Market Analysis, Insights and Forecast - by End-user Industry
- 8.3.1. Pharmaceuticals
- 8.3.2. Agrochemicals
- 8.3.3. Industrial
- 8.3.4. Other End-user Industries (Water Treatment, etc.)
- 8.1. Market Analysis, Insights and Forecast - by Type
- 9. Europe Hydrazine Market Analysis, Insights and Forecast, 2020-2032
- 9.1. Market Analysis, Insights and Forecast - by Type
- 9.1.1. Hydrazine Hydrate
- 9.1.2. Hydrazine Nitrate
- 9.1.3. Hydrazine Sulfate
- 9.1.4. Other Types (Hydrazine Carbonate, etc.)
- 9.2. Market Analysis, Insights and Forecast - by Application
- 9.2.1. Corrosion Inhibitor
- 9.2.2. Explosives
- 9.2.3. Rocket Fuel
- 9.2.4. Medicinal Ingredients
- 9.2.5. Precursor to Pesticides
- 9.2.6. Blowing Agent
- 9.2.7. Other Ap
- 9.3. Market Analysis, Insights and Forecast - by End-user Industry
- 9.3.1. Pharmaceuticals
- 9.3.2. Agrochemicals
- 9.3.3. Industrial
- 9.3.4. Other End-user Industries (Water Treatment, etc.)
- 9.1. Market Analysis, Insights and Forecast - by Type
- 10. South America Hydrazine Market Analysis, Insights and Forecast, 2020-2032
- 10.1. Market Analysis, Insights and Forecast - by Type
- 10.1.1. Hydrazine Hydrate
- 10.1.2. Hydrazine Nitrate
- 10.1.3. Hydrazine Sulfate
- 10.1.4. Other Types (Hydrazine Carbonate, etc.)
- 10.2. Market Analysis, Insights and Forecast - by Application
- 10.2.1. Corrosion Inhibitor
- 10.2.2. Explosives
- 10.2.3. Rocket Fuel
- 10.2.4. Medicinal Ingredients
- 10.2.5. Precursor to Pesticides
- 10.2.6. Blowing Agent
- 10.2.7. Other Ap
- 10.3. Market Analysis, Insights and Forecast - by End-user Industry
- 10.3.1. Pharmaceuticals
- 10.3.2. Agrochemicals
- 10.3.3. Industrial
- 10.3.4. Other End-user Industries (Water Treatment, etc.)
- 10.1. Market Analysis, Insights and Forecast - by Type
- 11. Middle East and Africa Hydrazine Market Analysis, Insights and Forecast, 2020-2032
- 11.1. Market Analysis, Insights and Forecast - by Type
- 11.1.1. Hydrazine Hydrate
- 11.1.2. Hydrazine Nitrate
- 11.1.3. Hydrazine Sulfate
- 11.1.4. Other Types (Hydrazine Carbonate, etc.)
- 11.2. Market Analysis, Insights and Forecast - by Application
- 11.2.1. Corrosion Inhibitor
- 11.2.2. Explosives
- 11.2.3. Rocket Fuel
- 11.2.4. Medicinal Ingredients
- 11.2.5. Precursor to Pesticides
- 11.2.6. Blowing Agent
- 11.2.7. Other Ap
- 11.3. Market Analysis, Insights and Forecast - by End-user Industry
- 11.3.1. Pharmaceuticals
- 11.3.2. Agrochemicals
- 11.3.3. Industrial
- 11.3.4. Other End-user Industries (Water Treatment, etc.)
- 11.1. Market Analysis, Insights and Forecast - by Type
- 12. Competitive Analysis
- 12.1. Company Profiles
- 12.1.1 Yibin Tianyuan Group*List Not Exhaustive
- 12.1.1.1. Company Overview
- 12.1.1.2. Products
- 12.1.1.3. Company Financials
- 12.1.1.4. SWOT Analysis
- 12.1.2 Arkema
- 12.1.2.1. Company Overview
- 12.1.2.2. Products
- 12.1.2.3. Company Financials
- 12.1.2.4. SWOT Analysis
- 12.1.3 BroadPharm
- 12.1.3.1. Company Overview
- 12.1.3.2. Products
- 12.1.3.3. Company Financials
- 12.1.3.4. SWOT Analysis
- 12.1.4 Arrow Fine Chemicals
- 12.1.4.1. Company Overview
- 12.1.4.2. Products
- 12.1.4.3. Company Financials
- 12.1.4.4. SWOT Analysis
- 12.1.5 Otsuka Chemical Co Ltd
- 12.1.5.1. Company Overview
- 12.1.5.2. Products
- 12.1.5.3. Company Financials
- 12.1.5.4. SWOT Analysis
- 12.1.6 Tokyo Chemical Industry Co Ltd
- 12.1.6.1. Company Overview
- 12.1.6.2. Products
- 12.1.6.3. Company Financials
- 12.1.6.4. SWOT Analysis
- 12.1.7 NIPPON CARBIDE INDUSTRIES CO INC
- 12.1.7.1. Company Overview
- 12.1.7.2. Products
- 12.1.7.3. Company Financials
- 12.1.7.4. SWOT Analysis
- 12.1.8 LANXESS
- 12.1.8.1. Company Overview
- 12.1.8.2. Products
- 12.1.8.3. Company Financials
- 12.1.8.4. SWOT Analysis
- 12.1.9 Innova Corporate
- 12.1.9.1. Company Overview
- 12.1.9.2. Products
- 12.1.9.3. Company Financials
- 12.1.9.4. SWOT Analysis
- 12.1.10 ACURO ORGANICS LIMITED
- 12.1.10.1. Company Overview
- 12.1.10.2. Products
- 12.1.10.3. Company Financials
- 12.1.10.4. SWOT Analysis
- 12.1.11 MERU CHEM PVT LTD
- 12.1.11.1. Company Overview
- 12.1.11.2. Products
- 12.1.11.3. Company Financials
- 12.1.11.4. SWOT Analysis
- 12.1.1 Yibin Tianyuan Group*List Not Exhaustive
- 12.2. Market Entropy
- 12.2.1 Company's Key Areas Served
- 12.2.2 Recent Developments
- 12.3. Company Market Share Analysis 2025
- 12.3.1 Top 5 Companies Market Share Analysis
- 12.3.2 Top 3 Companies Market Share Analysis
- 12.4. List of Potential Customers
- 13. Research Methodology
List of Figures
- Figure 1: Global Hydrazine Market Revenue Breakdown (million, %) by Region 2025 & 2033
- Figure 2: Global Hydrazine Market Volume Breakdown (kilotons, %) by Region 2025 & 2033
- Figure 3: Asia Pacific Hydrazine Market Revenue (million), by Type 2025 & 2033
- Figure 4: Asia Pacific Hydrazine Market Volume (kilotons), by Type 2025 & 2033
- Figure 5: Asia Pacific Hydrazine Market Revenue Share (%), by Type 2025 & 2033
- Figure 6: Asia Pacific Hydrazine Market Volume Share (%), by Type 2025 & 2033
- Figure 7: Asia Pacific Hydrazine Market Revenue (million), by Application 2025 & 2033
- Figure 8: Asia Pacific Hydrazine Market Volume (kilotons), by Application 2025 & 2033
- Figure 9: Asia Pacific Hydrazine Market Revenue Share (%), by Application 2025 & 2033
- Figure 10: Asia Pacific Hydrazine Market Volume Share (%), by Application 2025 & 2033
- Figure 11: Asia Pacific Hydrazine Market Revenue (million), by End-user Industry 2025 & 2033
- Figure 12: Asia Pacific Hydrazine Market Volume (kilotons), by End-user Industry 2025 & 2033
- Figure 13: Asia Pacific Hydrazine Market Revenue Share (%), by End-user Industry 2025 & 2033
- Figure 14: Asia Pacific Hydrazine Market Volume Share (%), by End-user Industry 2025 & 2033
- Figure 15: Asia Pacific Hydrazine Market Revenue (million), by Country 2025 & 2033
- Figure 16: Asia Pacific Hydrazine Market Volume (kilotons), by Country 2025 & 2033
- Figure 17: Asia Pacific Hydrazine Market Revenue Share (%), by Country 2025 & 2033
- Figure 18: Asia Pacific Hydrazine Market Volume Share (%), by Country 2025 & 2033
- Figure 19: North America Hydrazine Market Revenue (million), by Type 2025 & 2033
- Figure 20: North America Hydrazine Market Volume (kilotons), by Type 2025 & 2033
- Figure 21: North America Hydrazine Market Revenue Share (%), by Type 2025 & 2033
- Figure 22: North America Hydrazine Market Volume Share (%), by Type 2025 & 2033
- Figure 23: North America Hydrazine Market Revenue (million), by Application 2025 & 2033
- Figure 24: North America Hydrazine Market Volume (kilotons), by Application 2025 & 2033
- Figure 25: North America Hydrazine Market Revenue Share (%), by Application 2025 & 2033
- Figure 26: North America Hydrazine Market Volume Share (%), by Application 2025 & 2033
- Figure 27: North America Hydrazine Market Revenue (million), by End-user Industry 2025 & 2033
- Figure 28: North America Hydrazine Market Volume (kilotons), by End-user Industry 2025 & 2033
- Figure 29: North America Hydrazine Market Revenue Share (%), by End-user Industry 2025 & 2033
- Figure 30: North America Hydrazine Market Volume Share (%), by End-user Industry 2025 & 2033
- Figure 31: North America Hydrazine Market Revenue (million), by Country 2025 & 2033
- Figure 32: North America Hydrazine Market Volume (kilotons), by Country 2025 & 2033
- Figure 33: North America Hydrazine Market Revenue Share (%), by Country 2025 & 2033
- Figure 34: North America Hydrazine Market Volume Share (%), by Country 2025 & 2033
- Figure 35: Europe Hydrazine Market Revenue (million), by Type 2025 & 2033
- Figure 36: Europe Hydrazine Market Volume (kilotons), by Type 2025 & 2033
- Figure 37: Europe Hydrazine Market Revenue Share (%), by Type 2025 & 2033
- Figure 38: Europe Hydrazine Market Volume Share (%), by Type 2025 & 2033
- Figure 39: Europe Hydrazine Market Revenue (million), by Application 2025 & 2033
- Figure 40: Europe Hydrazine Market Volume (kilotons), by Application 2025 & 2033
- Figure 41: Europe Hydrazine Market Revenue Share (%), by Application 2025 & 2033
- Figure 42: Europe Hydrazine Market Volume Share (%), by Application 2025 & 2033
- Figure 43: Europe Hydrazine Market Revenue (million), by End-user Industry 2025 & 2033
- Figure 44: Europe Hydrazine Market Volume (kilotons), by End-user Industry 2025 & 2033
- Figure 45: Europe Hydrazine Market Revenue Share (%), by End-user Industry 2025 & 2033
- Figure 46: Europe Hydrazine Market Volume Share (%), by End-user Industry 2025 & 2033
- Figure 47: Europe Hydrazine Market Revenue (million), by Country 2025 & 2033
- Figure 48: Europe Hydrazine Market Volume (kilotons), by Country 2025 & 2033
- Figure 49: Europe Hydrazine Market Revenue Share (%), by Country 2025 & 2033
- Figure 50: Europe Hydrazine Market Volume Share (%), by Country 2025 & 2033
- Figure 51: South America Hydrazine Market Revenue (million), by Type 2025 & 2033
- Figure 52: South America Hydrazine Market Volume (kilotons), by Type 2025 & 2033
- Figure 53: South America Hydrazine Market Revenue Share (%), by Type 2025 & 2033
- Figure 54: South America Hydrazine Market Volume Share (%), by Type 2025 & 2033
- Figure 55: South America Hydrazine Market Revenue (million), by Application 2025 & 2033
- Figure 56: South America Hydrazine Market Volume (kilotons), by Application 2025 & 2033
- Figure 57: South America Hydrazine Market Revenue Share (%), by Application 2025 & 2033
- Figure 58: South America Hydrazine Market Volume Share (%), by Application 2025 & 2033
- Figure 59: South America Hydrazine Market Revenue (million), by End-user Industry 2025 & 2033
- Figure 60: South America Hydrazine Market Volume (kilotons), by End-user Industry 2025 & 2033
- Figure 61: South America Hydrazine Market Revenue Share (%), by End-user Industry 2025 & 2033
- Figure 62: South America Hydrazine Market Volume Share (%), by End-user Industry 2025 & 2033
- Figure 63: South America Hydrazine Market Revenue (million), by Country 2025 & 2033
- Figure 64: South America Hydrazine Market Volume (kilotons), by Country 2025 & 2033
- Figure 65: South America Hydrazine Market Revenue Share (%), by Country 2025 & 2033
- Figure 66: South America Hydrazine Market Volume Share (%), by Country 2025 & 2033
- Figure 67: Middle East and Africa Hydrazine Market Revenue (million), by Type 2025 & 2033
- Figure 68: Middle East and Africa Hydrazine Market Volume (kilotons), by Type 2025 & 2033
- Figure 69: Middle East and Africa Hydrazine Market Revenue Share (%), by Type 2025 & 2033
- Figure 70: Middle East and Africa Hydrazine Market Volume Share (%), by Type 2025 & 2033
- Figure 71: Middle East and Africa Hydrazine Market Revenue (million), by Application 2025 & 2033
- Figure 72: Middle East and Africa Hydrazine Market Volume (kilotons), by Application 2025 & 2033
- Figure 73: Middle East and Africa Hydrazine Market Revenue Share (%), by Application 2025 & 2033
- Figure 74: Middle East and Africa Hydrazine Market Volume Share (%), by Application 2025 & 2033
- Figure 75: Middle East and Africa Hydrazine Market Revenue (million), by End-user Industry 2025 & 2033
- Figure 76: Middle East and Africa Hydrazine Market Volume (kilotons), by End-user Industry 2025 & 2033
- Figure 77: Middle East and Africa Hydrazine Market Revenue Share (%), by End-user Industry 2025 & 2033
- Figure 78: Middle East and Africa Hydrazine Market Volume Share (%), by End-user Industry 2025 & 2033
- Figure 79: Middle East and Africa Hydrazine Market Revenue (million), by Country 2025 & 2033
- Figure 80: Middle East and Africa Hydrazine Market Volume (kilotons), by Country 2025 & 2033
- Figure 81: Middle East and Africa Hydrazine Market Revenue Share (%), by Country 2025 & 2033
- Figure 82: Middle East and Africa Hydrazine Market Volume Share (%), by Country 2025 & 2033
List of Tables
- Table 1: Global Hydrazine Market Revenue million Forecast, by Type 2020 & 2033
- Table 2: Global Hydrazine Market Volume kilotons Forecast, by Type 2020 & 2033
- Table 3: Global Hydrazine Market Revenue million Forecast, by Application 2020 & 2033
- Table 4: Global Hydrazine Market Volume kilotons Forecast, by Application 2020 & 2033
- Table 5: Global Hydrazine Market Revenue million Forecast, by End-user Industry 2020 & 2033
- Table 6: Global Hydrazine Market Volume kilotons Forecast, by End-user Industry 2020 & 2033
- Table 7: Global Hydrazine Market Revenue million Forecast, by Region 2020 & 2033
- Table 8: Global Hydrazine Market Volume kilotons Forecast, by Region 2020 & 2033
- Table 9: Global Hydrazine Market Revenue million Forecast, by Type 2020 & 2033
- Table 10: Global Hydrazine Market Volume kilotons Forecast, by Type 2020 & 2033
- Table 11: Global Hydrazine Market Revenue million Forecast, by Application 2020 & 2033
- Table 12: Global Hydrazine Market Volume kilotons Forecast, by Application 2020 & 2033
- Table 13: Global Hydrazine Market Revenue million Forecast, by End-user Industry 2020 & 2033
- Table 14: Global Hydrazine Market Volume kilotons Forecast, by End-user Industry 2020 & 2033
- Table 15: Global Hydrazine Market Revenue million Forecast, by Country 2020 & 2033
- Table 16: Global Hydrazine Market Volume kilotons Forecast, by Country 2020 & 2033
- Table 17: China Hydrazine Market Revenue (million) Forecast, by Application 2020 & 2033
- Table 18: China Hydrazine Market Volume (kilotons) Forecast, by Application 2020 & 2033
- Table 19: India Hydrazine Market Revenue (million) Forecast, by Application 2020 & 2033
- Table 20: India Hydrazine Market Volume (kilotons) Forecast, by Application 2020 & 2033
- Table 21: Japan Hydrazine Market Revenue (million) Forecast, by Application 2020 & 2033
- Table 22: Japan Hydrazine Market Volume (kilotons) Forecast, by Application 2020 & 2033
- Table 23: South Korea Hydrazine Market Revenue (million) Forecast, by Application 2020 & 2033
- Table 24: South Korea Hydrazine Market Volume (kilotons) Forecast, by Application 2020 & 2033
- Table 25: Rest of Asia Pacific Hydrazine Market Revenue (million) Forecast, by Application 2020 & 2033
- Table 26: Rest of Asia Pacific Hydrazine Market Volume (kilotons) Forecast, by Application 2020 & 2033
- Table 27: Global Hydrazine Market Revenue million Forecast, by Type 2020 & 2033
- Table 28: Global Hydrazine Market Volume kilotons Forecast, by Type 2020 & 2033
- Table 29: Global Hydrazine Market Revenue million Forecast, by Application 2020 & 2033
- Table 30: Global Hydrazine Market Volume kilotons Forecast, by Application 2020 & 2033
- Table 31: Global Hydrazine Market Revenue million Forecast, by End-user Industry 2020 & 2033
- Table 32: Global Hydrazine Market Volume kilotons Forecast, by End-user Industry 2020 & 2033
- Table 33: Global Hydrazine Market Revenue million Forecast, by Country 2020 & 2033
- Table 34: Global Hydrazine Market Volume kilotons Forecast, by Country 2020 & 2033
- Table 35: United States Hydrazine Market Revenue (million) Forecast, by Application 2020 & 2033
- Table 36: United States Hydrazine Market Volume (kilotons) Forecast, by Application 2020 & 2033
- Table 37: Canada Hydrazine Market Revenue (million) Forecast, by Application 2020 & 2033
- Table 38: Canada Hydrazine Market Volume (kilotons) Forecast, by Application 2020 & 2033
- Table 39: Mexico Hydrazine Market Revenue (million) Forecast, by Application 2020 & 2033
- Table 40: Mexico Hydrazine Market Volume (kilotons) Forecast, by Application 2020 & 2033
- Table 41: Global Hydrazine Market Revenue million Forecast, by Type 2020 & 2033
- Table 42: Global Hydrazine Market Volume kilotons Forecast, by Type 2020 & 2033
- Table 43: Global Hydrazine Market Revenue million Forecast, by Application 2020 & 2033
- Table 44: Global Hydrazine Market Volume kilotons Forecast, by Application 2020 & 2033
- Table 45: Global Hydrazine Market Revenue million Forecast, by End-user Industry 2020 & 2033
- Table 46: Global Hydrazine Market Volume kilotons Forecast, by End-user Industry 2020 & 2033
- Table 47: Global Hydrazine Market Revenue million Forecast, by Country 2020 & 2033
- Table 48: Global Hydrazine Market Volume kilotons Forecast, by Country 2020 & 2033
- Table 49: Germany Hydrazine Market Revenue (million) Forecast, by Application 2020 & 2033
- Table 50: Germany Hydrazine Market Volume (kilotons) Forecast, by Application 2020 & 2033
- Table 51: United Kingdom Hydrazine Market Revenue (million) Forecast, by Application 2020 & 2033
- Table 52: United Kingdom Hydrazine Market Volume (kilotons) Forecast, by Application 2020 & 2033
- Table 53: Italy Hydrazine Market Revenue (million) Forecast, by Application 2020 & 2033
- Table 54: Italy Hydrazine Market Volume (kilotons) Forecast, by Application 2020 & 2033
- Table 55: France Hydrazine Market Revenue (million) Forecast, by Application 2020 & 2033
- Table 56: France Hydrazine Market Volume (kilotons) Forecast, by Application 2020 & 2033
- Table 57: Rest of Europe Hydrazine Market Revenue (million) Forecast, by Application 2020 & 2033
- Table 58: Rest of Europe Hydrazine Market Volume (kilotons) Forecast, by Application 2020 & 2033
- Table 59: Global Hydrazine Market Revenue million Forecast, by Type 2020 & 2033
- Table 60: Global Hydrazine Market Volume kilotons Forecast, by Type 2020 & 2033
- Table 61: Global Hydrazine Market Revenue million Forecast, by Application 2020 & 2033
- Table 62: Global Hydrazine Market Volume kilotons Forecast, by Application 2020 & 2033
- Table 63: Global Hydrazine Market Revenue million Forecast, by End-user Industry 2020 & 2033
- Table 64: Global Hydrazine Market Volume kilotons Forecast, by End-user Industry 2020 & 2033
- Table 65: Global Hydrazine Market Revenue million Forecast, by Country 2020 & 2033
- Table 66: Global Hydrazine Market Volume kilotons Forecast, by Country 2020 & 2033
- Table 67: Brazil Hydrazine Market Revenue (million) Forecast, by Application 2020 & 2033
- Table 68: Brazil Hydrazine Market Volume (kilotons) Forecast, by Application 2020 & 2033
- Table 69: Argentina Hydrazine Market Revenue (million) Forecast, by Application 2020 & 2033
- Table 70: Argentina Hydrazine Market Volume (kilotons) Forecast, by Application 2020 & 2033
- Table 71: Rest of South America Hydrazine Market Revenue (million) Forecast, by Application 2020 & 2033
- Table 72: Rest of South America Hydrazine Market Volume (kilotons) Forecast, by Application 2020 & 2033
- Table 73: Global Hydrazine Market Revenue million Forecast, by Type 2020 & 2033
- Table 74: Global Hydrazine Market Volume kilotons Forecast, by Type 2020 & 2033
- Table 75: Global Hydrazine Market Revenue million Forecast, by Application 2020 & 2033
- Table 76: Global Hydrazine Market Volume kilotons Forecast, by Application 2020 & 2033
- Table 77: Global Hydrazine Market Revenue million Forecast, by End-user Industry 2020 & 2033
- Table 78: Global Hydrazine Market Volume kilotons Forecast, by End-user Industry 2020 & 2033
- Table 79: Global Hydrazine Market Revenue million Forecast, by Country 2020 & 2033
- Table 80: Global Hydrazine Market Volume kilotons Forecast, by Country 2020 & 2033
- Table 81: Saudi Arabia Hydrazine Market Revenue (million) Forecast, by Application 2020 & 2033
- Table 82: Saudi Arabia Hydrazine Market Volume (kilotons) Forecast, by Application 2020 & 2033
- Table 83: South Africa Hydrazine Market Revenue (million) Forecast, by Application 2020 & 2033
- Table 84: South Africa Hydrazine Market Volume (kilotons) Forecast, by Application 2020 & 2033
- Table 85: Rest of Middle East and Africa Hydrazine Market Revenue (million) Forecast, by Application 2020 & 2033
- Table 86: Rest of Middle East and Africa Hydrazine Market Volume (kilotons) Forecast, by Application 2020 & 2033
Frequently Asked Questions
1. What is the projected Compound Annual Growth Rate (CAGR) of the Hydrazine Market?
The projected CAGR is approximately 6%.
2. Which companies are prominent players in the Hydrazine Market?
Key companies in the market include Yibin Tianyuan Group*List Not Exhaustive, Arkema, BroadPharm, Arrow Fine Chemicals, Otsuka Chemical Co Ltd, Tokyo Chemical Industry Co Ltd, NIPPON CARBIDE INDUSTRIES CO INC, LANXESS, Innova Corporate, ACURO ORGANICS LIMITED, MERU CHEM PVT LTD.
3. What are the main segments of the Hydrazine Market?
The market segments include Type, Application, End-user Industry.
4. Can you provide details about the market size?
The market size is estimated to be USD 543 million as of 2022.
5. What are some drivers contributing to market growth?
Increasing Demand from Agrochemicals; Growing Applications in Pharmaceutical Industry; Other Drivers.
6. What are the notable trends driving market growth?
Increasing Demand from Pharmaceutical Sector.
7. Are there any restraints impacting market growth?
Highly Toxic Nature of Hydrazine; Other Restraints.
8. Can you provide examples of recent developments in the market?
May 2023: SynCrest Inc., a peptide and nucleotide CRDMO (Contract Research, Development, and Manufacturing Organization), announced the availability of its services for pharmaceutical companies and research institutions in Japan, Europe, North America, and South America. (Hydrazine is used in the manufacturing of pharmaceutical drugs.)
9. What pricing options are available for accessing the report?
Pricing options include single-user, multi-user, and enterprise licenses priced at USD 4750, USD 5250, and USD 8750 respectively.
10. Is the market size provided in terms of value or volume?
The market size is provided in terms of value, measured in million and volume, measured in kilotons.
11. Are there any specific market keywords associated with the report?
Yes, the market keyword associated with the report is "Hydrazine Market," which aids in identifying and referencing the specific market segment covered.
12. How do I determine which pricing option suits my needs best?
The pricing options vary based on user requirements and access needs. Individual users may opt for single-user licenses, while businesses requiring broader access may choose multi-user or enterprise licenses for cost-effective access to the report.
13. Are there any additional resources or data provided in the Hydrazine Market report?
While the report offers comprehensive insights, it's advisable to review the specific contents or supplementary materials provided to ascertain if additional resources or data are available.
14. How can I stay updated on further developments or reports in the Hydrazine Market?
To stay informed about further developments, trends, and reports in the Hydrazine Market, consider subscribing to industry newsletters, following relevant companies and organizations, or regularly checking reputable industry news sources and publications.
Methodology
Step 1 - Identification of Relevant Samples Size from Population Database


Step 2 - Approaches for Defining Global Market Size (Value, Volume* & Price*)

Note*: In applicable scenarios
Step 3 - Data Sources
Primary Research
- Web Analytics
- Survey Reports
- Research Institute
- Latest Research Reports
- Opinion Leaders
Secondary Research
- Annual Reports
- White Paper
- Latest Press Release
- Industry Association
- Paid Database
- Investor Presentations

Step 4 - Data Triangulation
Involves using different sources of information in order to increase the validity of a study
These sources are likely to be stakeholders in a program - participants, other researchers, program staff, other community members, and so on.
Then we put all data in single framework & apply various statistical tools to find out the dynamic on the market.
During the analysis stage, feedback from the stakeholder groups would be compared to determine areas of agreement as well as areas of divergence