

Key Insights
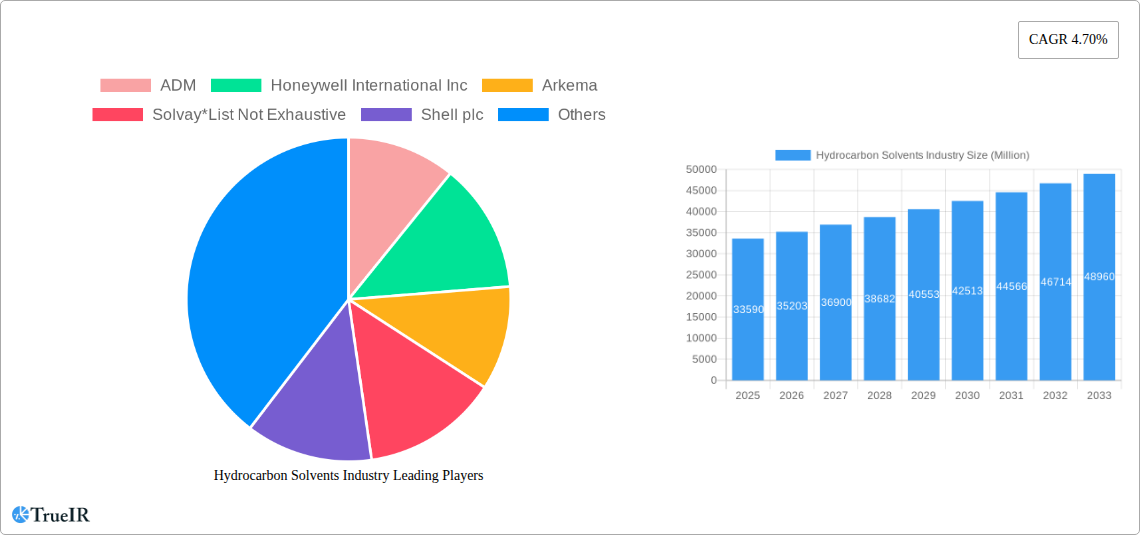
The global hydrocarbon solvents market, valued at approximately $33.59 billion in 2025, is projected to experience robust growth, driven by a compound annual growth rate (CAGR) of 4.70% from 2025 to 2033. This expansion is fueled by several key factors. The increasing demand for hydrocarbon solvents in the paints and coatings industry, particularly in construction and automotive applications, constitutes a significant driver. Furthermore, the burgeoning personal care and pharmaceutical sectors contribute significantly to market growth, as these solvents are essential components in various formulations. Growth in developing economies, especially within Asia Pacific, further accelerates market expansion due to increasing industrialization and infrastructure development. The diverse applications of hydrocarbon solvents across various sectors contribute to their consistent market demand. However, stringent environmental regulations regarding volatile organic compound (VOC) emissions pose a significant challenge. Companies are actively investing in research and development to produce more environmentally friendly alternatives, mitigating this restraint. The market's segmentation, categorized by solvent type (e.g., aliphatic, aromatic) and application (e.g., adhesives, inks), allows for targeted market analysis and strategic planning by industry players.
The competitive landscape is characterized by a mix of multinational corporations and regional players. Major players like ExxonMobil, Shell, and BASF dominate the market, leveraging their established distribution networks and technological expertise. However, smaller, specialized companies are also finding niches, focusing on specific solvent types or applications. The market's future trajectory will likely be influenced by technological advancements, sustainable practices, and fluctuating crude oil prices. The ongoing shift towards environmentally conscious manufacturing processes necessitates innovation in solvent production and usage. Companies are investing in cleaner production methods and exploring alternative solvents to comply with stricter environmental regulations and meet growing consumer demand for sustainable products. The long-term outlook remains positive, with continued growth expected, driven by evolving industrial needs and the development of more sustainable solvent solutions.
Hydrocarbon Solvents Industry: A Comprehensive Market Report (2019-2033)
This in-depth report provides a comprehensive analysis of the global Hydrocarbon Solvents industry, offering invaluable insights for stakeholders seeking to navigate this dynamic market. The study period covers 2019-2033, with 2025 as the base and estimated year, and a forecast period of 2025-2033. The report leverages extensive primary and secondary research to deliver a robust understanding of market trends, competitive dynamics, and future growth potential. The market size in 2025 is estimated at $XX Million, projected to reach $YY Million by 2033, exhibiting a CAGR of Z%.
Hydrocarbon Solvents Industry Market Structure & Competitive Landscape
The Hydrocarbon Solvents market is characterized by a moderately concentrated structure, with several multinational corporations holding significant market share. The Herfindahl-Hirschman Index (HHI) for 2025 is estimated at XX, indicating a moderately concentrated market. Key players include: ADM, Honeywell International Inc, Arkema, Solvay, Shell plc, Bharat Petroleum Corporation Limited, Exxon Mobil Corporation, INEOS, Celanese Corporation, GROUPE BERKEM, Ashland, BASF SE, LyondellBasell Industries Holdings B V, Huntsman International LLC, Sasol Limited, Gandhar Oil Refinery (India) Limited, Dow, and Eastman Chemical Company. This list is not exhaustive.
- Innovation Drivers: Continuous advancements in solvent technology, focusing on improved performance, reduced environmental impact, and enhanced safety are driving market growth.
- Regulatory Impacts: Stringent environmental regulations regarding volatile organic compounds (VOCs) and hazardous air pollutants (HAPs) are influencing the adoption of cleaner and more sustainable hydrocarbon solvents.
- Product Substitutes: The market faces competition from bio-based solvents and other alternative solvents, driving innovation in the development of more sustainable hydrocarbon-based options.
- End-User Segmentation: Major end-use segments include adhesives, paints and coatings, personal care products, pharmaceuticals, polymer production, and other applications (printing inks, agricultural chemicals, metal cleaning).
- M&A Trends: The industry has witnessed several mergers and acquisitions in recent years, driven by a desire for expansion, technological synergy, and market consolidation. The total M&A volume in the past 5 years is estimated at $XX Million.
Hydrocarbon Solvents Industry Market Trends & Opportunities
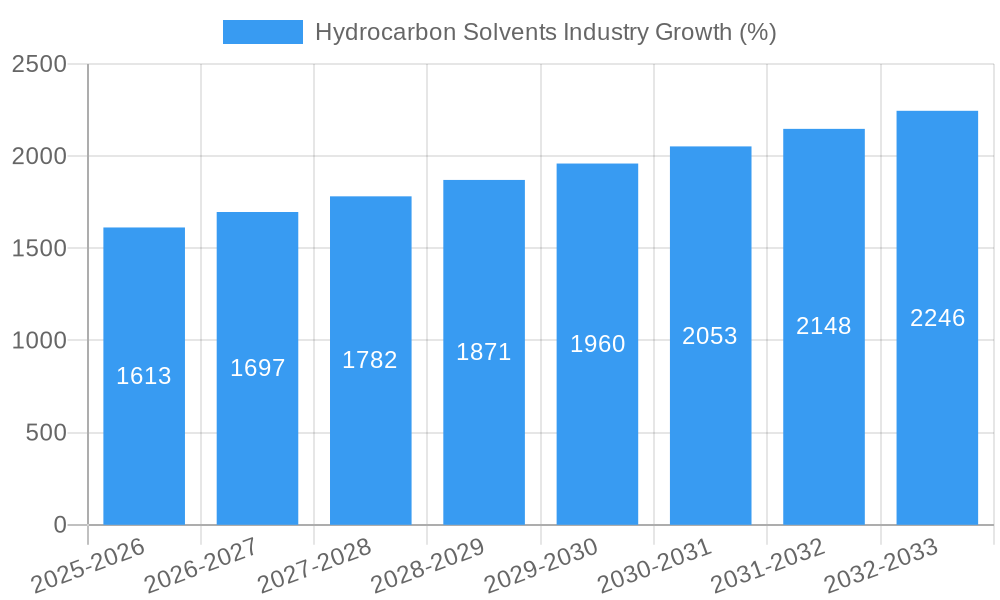
The global Hydrocarbon Solvents market is experiencing significant growth, driven by increasing demand from various end-use industries. Technological advancements, such as the development of high-performance solvents with improved properties, are playing a crucial role. Consumer preferences are shifting towards environmentally friendly and sustainable products, creating opportunities for the development and adoption of bio-based alternatives. However, intense competition among established players and the emergence of new entrants pose challenges. The market is expected to witness further consolidation through mergers and acquisitions. Growth is also influenced by fluctuating crude oil prices and economic conditions. Specific regional variations exist, influenced by economic development and infrastructure development.
Dominant Markets & Segments in Hydrocarbon Solvents Industry
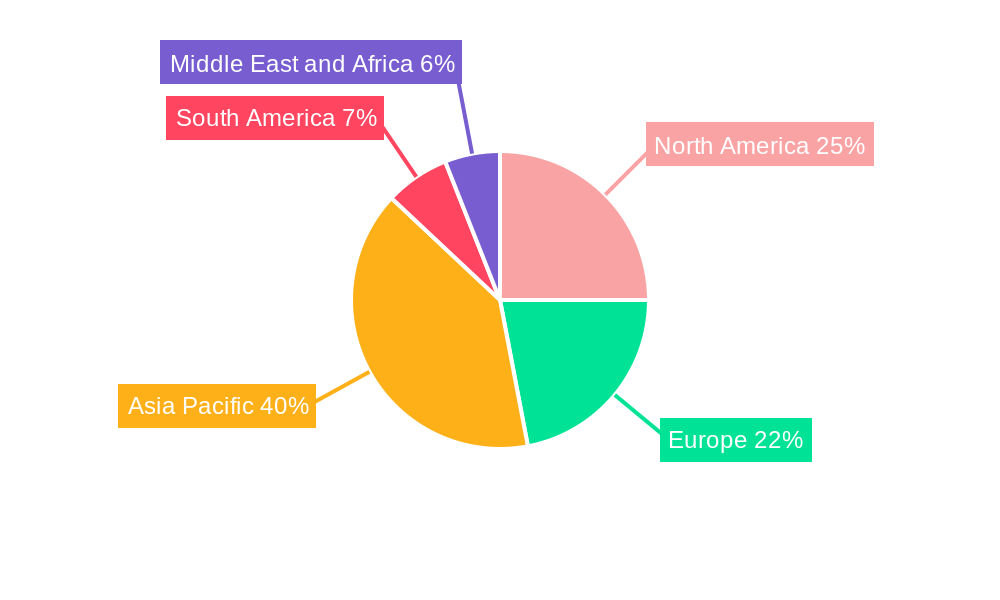
Leading Regions: Asia Pacific is expected to dominate the market due to rapid industrialization and economic growth. North America and Europe also hold significant market shares.
Leading Countries: China, India, and the United States are key contributors to market growth.
Leading Segments by Source: Petrochemical-based solvents currently hold the largest market share, followed by bio-based solvents, which are gaining traction due to increasing demand for sustainable products. The bio-based segment is expected to exhibit the highest CAGR during the forecast period.
Leading Segments by Type: Hydrocarbon solvents comprise the dominant segment by type, owing to their wide applicability. However, oxygenated solvents are also showing considerable growth, driven by their versatility and performance advantages in certain applications.
Leading Segments by Application: Paints and coatings remain the largest application segment, followed by adhesives and polymer production. Growth in the personal care and pharmaceutical segments is also significant.
Key Growth Drivers:
- Rapid industrialization and urbanization in developing economies.
- Growing demand for paints and coatings in construction and automotive sectors.
- Increasing demand for sustainable and eco-friendly solvents.
- Favorable government policies and regulations promoting sustainable manufacturing practices.
Hydrocarbon Solvents Industry Product Analysis
The hydrocarbon solvents market offers a diverse range of products with varying properties and applications. Recent innovations focus on developing solvents with improved performance, lower toxicity, and better environmental profiles. This includes advancements in solvent design using computational chemistry and green chemistry principles. The competitive advantage stems from efficiency, cost-effectiveness, and the ability to meet stringent environmental regulations.
Key Drivers, Barriers & Challenges in Hydrocarbon Solvents Industry
Key Drivers:
- Increasing demand from various end-use industries.
- Technological advancements in solvent production and application.
- Growing consumer awareness of environmental sustainability.
Key Challenges:
- Fluctuating crude oil prices impacting production costs.
- Stringent environmental regulations on VOC emissions and HAPs.
- Intense competition from bio-based and other alternative solvents.
- Supply chain disruptions and volatility due to geopolitical factors. For example, disruptions in 2022 impacted supply chains and caused price increases of XX%.
Growth Drivers in the Hydrocarbon Solvents Industry Market
The growth of the hydrocarbon solvents market is propelled by robust demand from diverse sectors including paints and coatings, adhesives, and personal care. Technological advancements lead to the development of higher-performing, environmentally friendly solvents, further boosting market expansion. Favorable government policies supporting industrial growth and infrastructure development in key regions contribute significantly to market expansion.
Challenges Impacting Hydrocarbon Solvents Industry Growth
Challenges include fluctuating crude oil prices, which directly impact production costs and profitability. Stringent environmental regulations increase the need for compliance and may limit the use of certain solvents. Furthermore, intense competition from substitute products and the emergence of new players create a dynamic and challenging market landscape.
Key Players Shaping the Hydrocarbon Solvents Industry Market
- ADM
- Honeywell International Inc
- Arkema
- Solvay
- Shell plc
- Bharat Petroleum Corporation Limited
- Exxon Mobil Corporation
- INEOS
- Celanese Corporation
- GROUPE BERKEM
- Ashland
- BASF SE
- LyondellBasell Industries Holdings B V
- Huntsman International LLC
- Sasol Limited
- Gandhar Oil Refinery (India) Limited
- Dow
- Eastman Chemical Company
Significant Hydrocarbon Solvents Industry Milestones
- 2020: X Company launched a new line of low-VOC hydrocarbon solvents.
- 2021: Y Company acquired Z Company, expanding its market reach and product portfolio.
- 2022: New environmental regulations in the EU impacted solvent production and distribution across Europe.
- 2023: Several major players announced investments in sustainable solvent technologies.
Future Outlook for Hydrocarbon Solvents Industry Market
The hydrocarbon solvents market is poised for continued growth, driven by increasing industrial activity and advancements in solvent technology. Strategic investments in sustainable and environmentally friendly solvents will be crucial for long-term success. Opportunities exist in emerging markets and developing economies. The focus will be on innovation, sustainability, and meeting evolving regulatory requirements.
Hydrocarbon Solvents Industry Segmentation
-
1. Source
- 1.1. Bio-based Solvents
- 1.2. Petrochemical-based Solvents
-
2. Type
- 2.1. Oxygenated Solvents
- 2.2. Hydrocarbon Solvents
- 2.3. Halogenated Solvents
-
3. Application
- 3.1. Adhesives
- 3.2. Paints and Coatings
- 3.3. Personal Care
- 3.4. Pharmaceuticals
- 3.5. Polymer Production
- 3.6. Other Ap
Hydrocarbon Solvents Industry Segmentation By Geography
-
1. Asia Pacific
- 1.1. China
- 1.2. India
- 1.3. Japan
- 1.4. South Korea
- 1.5. Malaysia
- 1.6. Thailand
- 1.7. Indonesia
- 1.8. Vietnam
- 1.9. Rest of Asia Pacific
-
2. North America
- 2.1. United States
- 2.2. Canada
- 2.3. Mexico
-
3. Europe
- 3.1. Germany
- 3.2. United Kingdom
- 3.3. France
- 3.4. Italy
- 3.5. Spain
- 3.6. NORDIC Countries
- 3.7. Turkey
- 3.8. Russia
- 3.9. Rest of Europe
-
4. South America
- 4.1. Brazil
- 4.2. Argentina
- 4.3. Colombia
- 4.4. Rest of South America
-
5. Middle East and Africa
- 5.1. Saudi Arabia
- 5.2. Qatar
- 5.3. United Arab Emirates
- 5.4. Nigeria
- 5.5. Egypt
- 5.6. South Africa
- 5.7. Rest of Middle East and Africa
Hydrocarbon Solvents Industry REPORT HIGHLIGHTS
| Aspects | Details |
|---|---|
| Study Period | 2019-2033 |
| Base Year | 2024 |
| Estimated Year | 2025 |
| Forecast Period | 2025-2033 |
| Historical Period | 2019-2024 |
| Growth Rate | CAGR of 4.70% from 2019-2033 |
| Segmentation |
|
Table of Contents
- 1. Introduction
- 1.1. Research Scope
- 1.2. Market Segmentation
- 1.3. Research Methodology
- 1.4. Definitions and Assumptions
- 2. Executive Summary
- 2.1. Introduction
- 3. Market Dynamics
- 3.1. Introduction
- 3.2. Market Drivers
- 3.2.1. Surging Demand from the Paints & Coatings Sector; Stringent Regulations in Place to Minimize VOC Emissions; Other Drivers
- 3.3. Market Restrains
- 3.3.1. High Manufacturing Costs and Performance Issues of Solvents; Detrimental Effects of Chemical Solvents
- 3.4. Market Trends
- 3.4.1. Significant Demand from Construction and Automotive Industry
- 4. Market Factor Analysis
- 4.1. Porters Five Forces
- 4.2. Supply/Value Chain
- 4.3. PESTEL analysis
- 4.4. Market Entropy
- 4.5. Patent/Trademark Analysis
- 5. Global Hydrocarbon Solvents Industry Analysis, Insights and Forecast, 2019-2031
- 5.1. Market Analysis, Insights and Forecast - by Source
- 5.1.1. Bio-based Solvents
- 5.1.2. Petrochemical-based Solvents
- 5.2. Market Analysis, Insights and Forecast - by Type
- 5.2.1. Oxygenated Solvents
- 5.2.2. Hydrocarbon Solvents
- 5.2.3. Halogenated Solvents
- 5.3. Market Analysis, Insights and Forecast - by Application
- 5.3.1. Adhesives
- 5.3.2. Paints and Coatings
- 5.3.3. Personal Care
- 5.3.4. Pharmaceuticals
- 5.3.5. Polymer Production
- 5.3.6. Other Ap
- 5.4. Market Analysis, Insights and Forecast - by Region
- 5.4.1. Asia Pacific
- 5.4.2. North America
- 5.4.3. Europe
- 5.4.4. South America
- 5.4.5. Middle East and Africa
- 5.1. Market Analysis, Insights and Forecast - by Source
- 6. Asia Pacific Hydrocarbon Solvents Industry Analysis, Insights and Forecast, 2019-2031
- 6.1. Market Analysis, Insights and Forecast - by Source
- 6.1.1. Bio-based Solvents
- 6.1.2. Petrochemical-based Solvents
- 6.2. Market Analysis, Insights and Forecast - by Type
- 6.2.1. Oxygenated Solvents
- 6.2.2. Hydrocarbon Solvents
- 6.2.3. Halogenated Solvents
- 6.3. Market Analysis, Insights and Forecast - by Application
- 6.3.1. Adhesives
- 6.3.2. Paints and Coatings
- 6.3.3. Personal Care
- 6.3.4. Pharmaceuticals
- 6.3.5. Polymer Production
- 6.3.6. Other Ap
- 6.1. Market Analysis, Insights and Forecast - by Source
- 7. North America Hydrocarbon Solvents Industry Analysis, Insights and Forecast, 2019-2031
- 7.1. Market Analysis, Insights and Forecast - by Source
- 7.1.1. Bio-based Solvents
- 7.1.2. Petrochemical-based Solvents
- 7.2. Market Analysis, Insights and Forecast - by Type
- 7.2.1. Oxygenated Solvents
- 7.2.2. Hydrocarbon Solvents
- 7.2.3. Halogenated Solvents
- 7.3. Market Analysis, Insights and Forecast - by Application
- 7.3.1. Adhesives
- 7.3.2. Paints and Coatings
- 7.3.3. Personal Care
- 7.3.4. Pharmaceuticals
- 7.3.5. Polymer Production
- 7.3.6. Other Ap
- 7.1. Market Analysis, Insights and Forecast - by Source
- 8. Europe Hydrocarbon Solvents Industry Analysis, Insights and Forecast, 2019-2031
- 8.1. Market Analysis, Insights and Forecast - by Source
- 8.1.1. Bio-based Solvents
- 8.1.2. Petrochemical-based Solvents
- 8.2. Market Analysis, Insights and Forecast - by Type
- 8.2.1. Oxygenated Solvents
- 8.2.2. Hydrocarbon Solvents
- 8.2.3. Halogenated Solvents
- 8.3. Market Analysis, Insights and Forecast - by Application
- 8.3.1. Adhesives
- 8.3.2. Paints and Coatings
- 8.3.3. Personal Care
- 8.3.4. Pharmaceuticals
- 8.3.5. Polymer Production
- 8.3.6. Other Ap
- 8.1. Market Analysis, Insights and Forecast - by Source
- 9. South America Hydrocarbon Solvents Industry Analysis, Insights and Forecast, 2019-2031
- 9.1. Market Analysis, Insights and Forecast - by Source
- 9.1.1. Bio-based Solvents
- 9.1.2. Petrochemical-based Solvents
- 9.2. Market Analysis, Insights and Forecast - by Type
- 9.2.1. Oxygenated Solvents
- 9.2.2. Hydrocarbon Solvents
- 9.2.3. Halogenated Solvents
- 9.3. Market Analysis, Insights and Forecast - by Application
- 9.3.1. Adhesives
- 9.3.2. Paints and Coatings
- 9.3.3. Personal Care
- 9.3.4. Pharmaceuticals
- 9.3.5. Polymer Production
- 9.3.6. Other Ap
- 9.1. Market Analysis, Insights and Forecast - by Source
- 10. Middle East and Africa Hydrocarbon Solvents Industry Analysis, Insights and Forecast, 2019-2031
- 10.1. Market Analysis, Insights and Forecast - by Source
- 10.1.1. Bio-based Solvents
- 10.1.2. Petrochemical-based Solvents
- 10.2. Market Analysis, Insights and Forecast - by Type
- 10.2.1. Oxygenated Solvents
- 10.2.2. Hydrocarbon Solvents
- 10.2.3. Halogenated Solvents
- 10.3. Market Analysis, Insights and Forecast - by Application
- 10.3.1. Adhesives
- 10.3.2. Paints and Coatings
- 10.3.3. Personal Care
- 10.3.4. Pharmaceuticals
- 10.3.5. Polymer Production
- 10.3.6. Other Ap
- 10.1. Market Analysis, Insights and Forecast - by Source
- 11. Asia Pacific Hydrocarbon Solvents Industry Analysis, Insights and Forecast, 2019-2031
- 11.1. Market Analysis, Insights and Forecast - By Country/Sub-region
- 11.1.1 China
- 11.1.2 India
- 11.1.3 Japan
- 11.1.4 South Korea
- 11.1.5 Rest of Asia Pacific
- 12. North America Hydrocarbon Solvents Industry Analysis, Insights and Forecast, 2019-2031
- 12.1. Market Analysis, Insights and Forecast - By Country/Sub-region
- 12.1.1 United States
- 12.1.2 Canada
- 12.1.3 Mexico
- 13. Europe Hydrocarbon Solvents Industry Analysis, Insights and Forecast, 2019-2031
- 13.1. Market Analysis, Insights and Forecast - By Country/Sub-region
- 13.1.1 Germany
- 13.1.2 United Kingdom
- 13.1.3 France
- 13.1.4 Italy
- 13.1.5 Rest of Europe
- 14. South America Hydrocarbon Solvents Industry Analysis, Insights and Forecast, 2019-2031
- 14.1. Market Analysis, Insights and Forecast - By Country/Sub-region
- 14.1.1 Brazil
- 14.1.2 Argentina
- 14.1.3 Rest of South America
- 15. Middle East and Africa Hydrocarbon Solvents Industry Analysis, Insights and Forecast, 2019-2031
- 15.1. Market Analysis, Insights and Forecast - By Country/Sub-region
- 15.1.1 Saudi Arabia
- 15.1.2 South Africa
- 15.1.3 Rest of Middle East and Africa
- 16. Competitive Analysis
- 16.1. Global Market Share Analysis 2024
- 16.2. Company Profiles
- 16.2.1 ADM
- 16.2.1.1. Overview
- 16.2.1.2. Products
- 16.2.1.3. SWOT Analysis
- 16.2.1.4. Recent Developments
- 16.2.1.5. Financials (Based on Availability)
- 16.2.2 Honeywell International Inc
- 16.2.2.1. Overview
- 16.2.2.2. Products
- 16.2.2.3. SWOT Analysis
- 16.2.2.4. Recent Developments
- 16.2.2.5. Financials (Based on Availability)
- 16.2.3 Arkema
- 16.2.3.1. Overview
- 16.2.3.2. Products
- 16.2.3.3. SWOT Analysis
- 16.2.3.4. Recent Developments
- 16.2.3.5. Financials (Based on Availability)
- 16.2.4 Solvay*List Not Exhaustive
- 16.2.4.1. Overview
- 16.2.4.2. Products
- 16.2.4.3. SWOT Analysis
- 16.2.4.4. Recent Developments
- 16.2.4.5. Financials (Based on Availability)
- 16.2.5 Shell plc
- 16.2.5.1. Overview
- 16.2.5.2. Products
- 16.2.5.3. SWOT Analysis
- 16.2.5.4. Recent Developments
- 16.2.5.5. Financials (Based on Availability)
- 16.2.6 Bharat Petroleum Corporation Limited
- 16.2.6.1. Overview
- 16.2.6.2. Products
- 16.2.6.3. SWOT Analysis
- 16.2.6.4. Recent Developments
- 16.2.6.5. Financials (Based on Availability)
- 16.2.7 Exxon Mobil Corporation
- 16.2.7.1. Overview
- 16.2.7.2. Products
- 16.2.7.3. SWOT Analysis
- 16.2.7.4. Recent Developments
- 16.2.7.5. Financials (Based on Availability)
- 16.2.8 INEOS
- 16.2.8.1. Overview
- 16.2.8.2. Products
- 16.2.8.3. SWOT Analysis
- 16.2.8.4. Recent Developments
- 16.2.8.5. Financials (Based on Availability)
- 16.2.9 Celanese Corporation
- 16.2.9.1. Overview
- 16.2.9.2. Products
- 16.2.9.3. SWOT Analysis
- 16.2.9.4. Recent Developments
- 16.2.9.5. Financials (Based on Availability)
- 16.2.10 GROUPE BERKEM
- 16.2.10.1. Overview
- 16.2.10.2. Products
- 16.2.10.3. SWOT Analysis
- 16.2.10.4. Recent Developments
- 16.2.10.5. Financials (Based on Availability)
- 16.2.11 Ashland
- 16.2.11.1. Overview
- 16.2.11.2. Products
- 16.2.11.3. SWOT Analysis
- 16.2.11.4. Recent Developments
- 16.2.11.5. Financials (Based on Availability)
- 16.2.12 BASF SE
- 16.2.12.1. Overview
- 16.2.12.2. Products
- 16.2.12.3. SWOT Analysis
- 16.2.12.4. Recent Developments
- 16.2.12.5. Financials (Based on Availability)
- 16.2.13 LyondellBasell Industries Holdings B V
- 16.2.13.1. Overview
- 16.2.13.2. Products
- 16.2.13.3. SWOT Analysis
- 16.2.13.4. Recent Developments
- 16.2.13.5. Financials (Based on Availability)
- 16.2.14 Huntsman International LLC
- 16.2.14.1. Overview
- 16.2.14.2. Products
- 16.2.14.3. SWOT Analysis
- 16.2.14.4. Recent Developments
- 16.2.14.5. Financials (Based on Availability)
- 16.2.15 Sasol Limited
- 16.2.15.1. Overview
- 16.2.15.2. Products
- 16.2.15.3. SWOT Analysis
- 16.2.15.4. Recent Developments
- 16.2.15.5. Financials (Based on Availability)
- 16.2.16 Gandhar Oil Refinery (India) Limited
- 16.2.16.1. Overview
- 16.2.16.2. Products
- 16.2.16.3. SWOT Analysis
- 16.2.16.4. Recent Developments
- 16.2.16.5. Financials (Based on Availability)
- 16.2.17 Dow
- 16.2.17.1. Overview
- 16.2.17.2. Products
- 16.2.17.3. SWOT Analysis
- 16.2.17.4. Recent Developments
- 16.2.17.5. Financials (Based on Availability)
- 16.2.18 Eastman Chemical Company
- 16.2.18.1. Overview
- 16.2.18.2. Products
- 16.2.18.3. SWOT Analysis
- 16.2.18.4. Recent Developments
- 16.2.18.5. Financials (Based on Availability)
- 16.2.1 ADM
List of Figures
- Figure 1: Global Hydrocarbon Solvents Industry Revenue Breakdown (Million, %) by Region 2024 & 2032
- Figure 2: Asia Pacific Hydrocarbon Solvents Industry Revenue (Million), by Country 2024 & 2032
- Figure 3: Asia Pacific Hydrocarbon Solvents Industry Revenue Share (%), by Country 2024 & 2032
- Figure 4: North America Hydrocarbon Solvents Industry Revenue (Million), by Country 2024 & 2032
- Figure 5: North America Hydrocarbon Solvents Industry Revenue Share (%), by Country 2024 & 2032
- Figure 6: Europe Hydrocarbon Solvents Industry Revenue (Million), by Country 2024 & 2032
- Figure 7: Europe Hydrocarbon Solvents Industry Revenue Share (%), by Country 2024 & 2032
- Figure 8: South America Hydrocarbon Solvents Industry Revenue (Million), by Country 2024 & 2032
- Figure 9: South America Hydrocarbon Solvents Industry Revenue Share (%), by Country 2024 & 2032
- Figure 10: Middle East and Africa Hydrocarbon Solvents Industry Revenue (Million), by Country 2024 & 2032
- Figure 11: Middle East and Africa Hydrocarbon Solvents Industry Revenue Share (%), by Country 2024 & 2032
- Figure 12: Asia Pacific Hydrocarbon Solvents Industry Revenue (Million), by Source 2024 & 2032
- Figure 13: Asia Pacific Hydrocarbon Solvents Industry Revenue Share (%), by Source 2024 & 2032
- Figure 14: Asia Pacific Hydrocarbon Solvents Industry Revenue (Million), by Type 2024 & 2032
- Figure 15: Asia Pacific Hydrocarbon Solvents Industry Revenue Share (%), by Type 2024 & 2032
- Figure 16: Asia Pacific Hydrocarbon Solvents Industry Revenue (Million), by Application 2024 & 2032
- Figure 17: Asia Pacific Hydrocarbon Solvents Industry Revenue Share (%), by Application 2024 & 2032
- Figure 18: Asia Pacific Hydrocarbon Solvents Industry Revenue (Million), by Country 2024 & 2032
- Figure 19: Asia Pacific Hydrocarbon Solvents Industry Revenue Share (%), by Country 2024 & 2032
- Figure 20: North America Hydrocarbon Solvents Industry Revenue (Million), by Source 2024 & 2032
- Figure 21: North America Hydrocarbon Solvents Industry Revenue Share (%), by Source 2024 & 2032
- Figure 22: North America Hydrocarbon Solvents Industry Revenue (Million), by Type 2024 & 2032
- Figure 23: North America Hydrocarbon Solvents Industry Revenue Share (%), by Type 2024 & 2032
- Figure 24: North America Hydrocarbon Solvents Industry Revenue (Million), by Application 2024 & 2032
- Figure 25: North America Hydrocarbon Solvents Industry Revenue Share (%), by Application 2024 & 2032
- Figure 26: North America Hydrocarbon Solvents Industry Revenue (Million), by Country 2024 & 2032
- Figure 27: North America Hydrocarbon Solvents Industry Revenue Share (%), by Country 2024 & 2032
- Figure 28: Europe Hydrocarbon Solvents Industry Revenue (Million), by Source 2024 & 2032
- Figure 29: Europe Hydrocarbon Solvents Industry Revenue Share (%), by Source 2024 & 2032
- Figure 30: Europe Hydrocarbon Solvents Industry Revenue (Million), by Type 2024 & 2032
- Figure 31: Europe Hydrocarbon Solvents Industry Revenue Share (%), by Type 2024 & 2032
- Figure 32: Europe Hydrocarbon Solvents Industry Revenue (Million), by Application 2024 & 2032
- Figure 33: Europe Hydrocarbon Solvents Industry Revenue Share (%), by Application 2024 & 2032
- Figure 34: Europe Hydrocarbon Solvents Industry Revenue (Million), by Country 2024 & 2032
- Figure 35: Europe Hydrocarbon Solvents Industry Revenue Share (%), by Country 2024 & 2032
- Figure 36: South America Hydrocarbon Solvents Industry Revenue (Million), by Source 2024 & 2032
- Figure 37: South America Hydrocarbon Solvents Industry Revenue Share (%), by Source 2024 & 2032
- Figure 38: South America Hydrocarbon Solvents Industry Revenue (Million), by Type 2024 & 2032
- Figure 39: South America Hydrocarbon Solvents Industry Revenue Share (%), by Type 2024 & 2032
- Figure 40: South America Hydrocarbon Solvents Industry Revenue (Million), by Application 2024 & 2032
- Figure 41: South America Hydrocarbon Solvents Industry Revenue Share (%), by Application 2024 & 2032
- Figure 42: South America Hydrocarbon Solvents Industry Revenue (Million), by Country 2024 & 2032
- Figure 43: South America Hydrocarbon Solvents Industry Revenue Share (%), by Country 2024 & 2032
- Figure 44: Middle East and Africa Hydrocarbon Solvents Industry Revenue (Million), by Source 2024 & 2032
- Figure 45: Middle East and Africa Hydrocarbon Solvents Industry Revenue Share (%), by Source 2024 & 2032
- Figure 46: Middle East and Africa Hydrocarbon Solvents Industry Revenue (Million), by Type 2024 & 2032
- Figure 47: Middle East and Africa Hydrocarbon Solvents Industry Revenue Share (%), by Type 2024 & 2032
- Figure 48: Middle East and Africa Hydrocarbon Solvents Industry Revenue (Million), by Application 2024 & 2032
- Figure 49: Middle East and Africa Hydrocarbon Solvents Industry Revenue Share (%), by Application 2024 & 2032
- Figure 50: Middle East and Africa Hydrocarbon Solvents Industry Revenue (Million), by Country 2024 & 2032
- Figure 51: Middle East and Africa Hydrocarbon Solvents Industry Revenue Share (%), by Country 2024 & 2032
List of Tables
- Table 1: Global Hydrocarbon Solvents Industry Revenue Million Forecast, by Region 2019 & 2032
- Table 2: Global Hydrocarbon Solvents Industry Revenue Million Forecast, by Source 2019 & 2032
- Table 3: Global Hydrocarbon Solvents Industry Revenue Million Forecast, by Type 2019 & 2032
- Table 4: Global Hydrocarbon Solvents Industry Revenue Million Forecast, by Application 2019 & 2032
- Table 5: Global Hydrocarbon Solvents Industry Revenue Million Forecast, by Region 2019 & 2032
- Table 6: Global Hydrocarbon Solvents Industry Revenue Million Forecast, by Country 2019 & 2032
- Table 7: China Hydrocarbon Solvents Industry Revenue (Million) Forecast, by Application 2019 & 2032
- Table 8: India Hydrocarbon Solvents Industry Revenue (Million) Forecast, by Application 2019 & 2032
- Table 9: Japan Hydrocarbon Solvents Industry Revenue (Million) Forecast, by Application 2019 & 2032
- Table 10: South Korea Hydrocarbon Solvents Industry Revenue (Million) Forecast, by Application 2019 & 2032
- Table 11: Rest of Asia Pacific Hydrocarbon Solvents Industry Revenue (Million) Forecast, by Application 2019 & 2032
- Table 12: Global Hydrocarbon Solvents Industry Revenue Million Forecast, by Country 2019 & 2032
- Table 13: United States Hydrocarbon Solvents Industry Revenue (Million) Forecast, by Application 2019 & 2032
- Table 14: Canada Hydrocarbon Solvents Industry Revenue (Million) Forecast, by Application 2019 & 2032
- Table 15: Mexico Hydrocarbon Solvents Industry Revenue (Million) Forecast, by Application 2019 & 2032
- Table 16: Global Hydrocarbon Solvents Industry Revenue Million Forecast, by Country 2019 & 2032
- Table 17: Germany Hydrocarbon Solvents Industry Revenue (Million) Forecast, by Application 2019 & 2032
- Table 18: United Kingdom Hydrocarbon Solvents Industry Revenue (Million) Forecast, by Application 2019 & 2032
- Table 19: France Hydrocarbon Solvents Industry Revenue (Million) Forecast, by Application 2019 & 2032
- Table 20: Italy Hydrocarbon Solvents Industry Revenue (Million) Forecast, by Application 2019 & 2032
- Table 21: Rest of Europe Hydrocarbon Solvents Industry Revenue (Million) Forecast, by Application 2019 & 2032
- Table 22: Global Hydrocarbon Solvents Industry Revenue Million Forecast, by Country 2019 & 2032
- Table 23: Brazil Hydrocarbon Solvents Industry Revenue (Million) Forecast, by Application 2019 & 2032
- Table 24: Argentina Hydrocarbon Solvents Industry Revenue (Million) Forecast, by Application 2019 & 2032
- Table 25: Rest of South America Hydrocarbon Solvents Industry Revenue (Million) Forecast, by Application 2019 & 2032
- Table 26: Global Hydrocarbon Solvents Industry Revenue Million Forecast, by Country 2019 & 2032
- Table 27: Saudi Arabia Hydrocarbon Solvents Industry Revenue (Million) Forecast, by Application 2019 & 2032
- Table 28: South Africa Hydrocarbon Solvents Industry Revenue (Million) Forecast, by Application 2019 & 2032
- Table 29: Rest of Middle East and Africa Hydrocarbon Solvents Industry Revenue (Million) Forecast, by Application 2019 & 2032
- Table 30: Global Hydrocarbon Solvents Industry Revenue Million Forecast, by Source 2019 & 2032
- Table 31: Global Hydrocarbon Solvents Industry Revenue Million Forecast, by Type 2019 & 2032
- Table 32: Global Hydrocarbon Solvents Industry Revenue Million Forecast, by Application 2019 & 2032
- Table 33: Global Hydrocarbon Solvents Industry Revenue Million Forecast, by Country 2019 & 2032
- Table 34: China Hydrocarbon Solvents Industry Revenue (Million) Forecast, by Application 2019 & 2032
- Table 35: India Hydrocarbon Solvents Industry Revenue (Million) Forecast, by Application 2019 & 2032
- Table 36: Japan Hydrocarbon Solvents Industry Revenue (Million) Forecast, by Application 2019 & 2032
- Table 37: South Korea Hydrocarbon Solvents Industry Revenue (Million) Forecast, by Application 2019 & 2032
- Table 38: Malaysia Hydrocarbon Solvents Industry Revenue (Million) Forecast, by Application 2019 & 2032
- Table 39: Thailand Hydrocarbon Solvents Industry Revenue (Million) Forecast, by Application 2019 & 2032
- Table 40: Indonesia Hydrocarbon Solvents Industry Revenue (Million) Forecast, by Application 2019 & 2032
- Table 41: Vietnam Hydrocarbon Solvents Industry Revenue (Million) Forecast, by Application 2019 & 2032
- Table 42: Rest of Asia Pacific Hydrocarbon Solvents Industry Revenue (Million) Forecast, by Application 2019 & 2032
- Table 43: Global Hydrocarbon Solvents Industry Revenue Million Forecast, by Source 2019 & 2032
- Table 44: Global Hydrocarbon Solvents Industry Revenue Million Forecast, by Type 2019 & 2032
- Table 45: Global Hydrocarbon Solvents Industry Revenue Million Forecast, by Application 2019 & 2032
- Table 46: Global Hydrocarbon Solvents Industry Revenue Million Forecast, by Country 2019 & 2032
- Table 47: United States Hydrocarbon Solvents Industry Revenue (Million) Forecast, by Application 2019 & 2032
- Table 48: Canada Hydrocarbon Solvents Industry Revenue (Million) Forecast, by Application 2019 & 2032
- Table 49: Mexico Hydrocarbon Solvents Industry Revenue (Million) Forecast, by Application 2019 & 2032
- Table 50: Global Hydrocarbon Solvents Industry Revenue Million Forecast, by Source 2019 & 2032
- Table 51: Global Hydrocarbon Solvents Industry Revenue Million Forecast, by Type 2019 & 2032
- Table 52: Global Hydrocarbon Solvents Industry Revenue Million Forecast, by Application 2019 & 2032
- Table 53: Global Hydrocarbon Solvents Industry Revenue Million Forecast, by Country 2019 & 2032
- Table 54: Germany Hydrocarbon Solvents Industry Revenue (Million) Forecast, by Application 2019 & 2032
- Table 55: United Kingdom Hydrocarbon Solvents Industry Revenue (Million) Forecast, by Application 2019 & 2032
- Table 56: France Hydrocarbon Solvents Industry Revenue (Million) Forecast, by Application 2019 & 2032
- Table 57: Italy Hydrocarbon Solvents Industry Revenue (Million) Forecast, by Application 2019 & 2032
- Table 58: Spain Hydrocarbon Solvents Industry Revenue (Million) Forecast, by Application 2019 & 2032
- Table 59: NORDIC Countries Hydrocarbon Solvents Industry Revenue (Million) Forecast, by Application 2019 & 2032
- Table 60: Turkey Hydrocarbon Solvents Industry Revenue (Million) Forecast, by Application 2019 & 2032
- Table 61: Russia Hydrocarbon Solvents Industry Revenue (Million) Forecast, by Application 2019 & 2032
- Table 62: Rest of Europe Hydrocarbon Solvents Industry Revenue (Million) Forecast, by Application 2019 & 2032
- Table 63: Global Hydrocarbon Solvents Industry Revenue Million Forecast, by Source 2019 & 2032
- Table 64: Global Hydrocarbon Solvents Industry Revenue Million Forecast, by Type 2019 & 2032
- Table 65: Global Hydrocarbon Solvents Industry Revenue Million Forecast, by Application 2019 & 2032
- Table 66: Global Hydrocarbon Solvents Industry Revenue Million Forecast, by Country 2019 & 2032
- Table 67: Brazil Hydrocarbon Solvents Industry Revenue (Million) Forecast, by Application 2019 & 2032
- Table 68: Argentina Hydrocarbon Solvents Industry Revenue (Million) Forecast, by Application 2019 & 2032
- Table 69: Colombia Hydrocarbon Solvents Industry Revenue (Million) Forecast, by Application 2019 & 2032
- Table 70: Rest of South America Hydrocarbon Solvents Industry Revenue (Million) Forecast, by Application 2019 & 2032
- Table 71: Global Hydrocarbon Solvents Industry Revenue Million Forecast, by Source 2019 & 2032
- Table 72: Global Hydrocarbon Solvents Industry Revenue Million Forecast, by Type 2019 & 2032
- Table 73: Global Hydrocarbon Solvents Industry Revenue Million Forecast, by Application 2019 & 2032
- Table 74: Global Hydrocarbon Solvents Industry Revenue Million Forecast, by Country 2019 & 2032
- Table 75: Saudi Arabia Hydrocarbon Solvents Industry Revenue (Million) Forecast, by Application 2019 & 2032
- Table 76: Qatar Hydrocarbon Solvents Industry Revenue (Million) Forecast, by Application 2019 & 2032
- Table 77: United Arab Emirates Hydrocarbon Solvents Industry Revenue (Million) Forecast, by Application 2019 & 2032
- Table 78: Nigeria Hydrocarbon Solvents Industry Revenue (Million) Forecast, by Application 2019 & 2032
- Table 79: Egypt Hydrocarbon Solvents Industry Revenue (Million) Forecast, by Application 2019 & 2032
- Table 80: South Africa Hydrocarbon Solvents Industry Revenue (Million) Forecast, by Application 2019 & 2032
- Table 81: Rest of Middle East and Africa Hydrocarbon Solvents Industry Revenue (Million) Forecast, by Application 2019 & 2032
Frequently Asked Questions
1. What is the projected Compound Annual Growth Rate (CAGR) of the Hydrocarbon Solvents Industry?
The projected CAGR is approximately 4.70%.
2. Which companies are prominent players in the Hydrocarbon Solvents Industry?
Key companies in the market include ADM, Honeywell International Inc, Arkema, Solvay*List Not Exhaustive, Shell plc, Bharat Petroleum Corporation Limited, Exxon Mobil Corporation, INEOS, Celanese Corporation, GROUPE BERKEM, Ashland, BASF SE, LyondellBasell Industries Holdings B V, Huntsman International LLC, Sasol Limited, Gandhar Oil Refinery (India) Limited, Dow, Eastman Chemical Company.
3. What are the main segments of the Hydrocarbon Solvents Industry?
The market segments include Source, Type, Application.
4. Can you provide details about the market size?
The market size is estimated to be USD 33.59 Million as of 2022.
5. What are some drivers contributing to market growth?
Surging Demand from the Paints & Coatings Sector; Stringent Regulations in Place to Minimize VOC Emissions; Other Drivers.
6. What are the notable trends driving market growth?
Significant Demand from Construction and Automotive Industry.
7. Are there any restraints impacting market growth?
High Manufacturing Costs and Performance Issues of Solvents; Detrimental Effects of Chemical Solvents.
8. Can you provide examples of recent developments in the market?
N/A
9. What pricing options are available for accessing the report?
Pricing options include single-user, multi-user, and enterprise licenses priced at USD 4750, USD 5250, and USD 8750 respectively.
10. Is the market size provided in terms of value or volume?
The market size is provided in terms of value, measured in Million.
11. Are there any specific market keywords associated with the report?
Yes, the market keyword associated with the report is "Hydrocarbon Solvents Industry," which aids in identifying and referencing the specific market segment covered.
12. How do I determine which pricing option suits my needs best?
The pricing options vary based on user requirements and access needs. Individual users may opt for single-user licenses, while businesses requiring broader access may choose multi-user or enterprise licenses for cost-effective access to the report.
13. Are there any additional resources or data provided in the Hydrocarbon Solvents Industry report?
While the report offers comprehensive insights, it's advisable to review the specific contents or supplementary materials provided to ascertain if additional resources or data are available.
14. How can I stay updated on further developments or reports in the Hydrocarbon Solvents Industry?
To stay informed about further developments, trends, and reports in the Hydrocarbon Solvents Industry, consider subscribing to industry newsletters, following relevant companies and organizations, or regularly checking reputable industry news sources and publications.
Methodology
Step 1 - Identification of Relevant Samples Size from Population Database


Step 2 - Approaches for Defining Global Market Size (Value, Volume* & Price*)

Note*: In applicable scenarios
Step 3 - Data Sources
Primary Research
- Web Analytics
- Survey Reports
- Research Institute
- Latest Research Reports
- Opinion Leaders
Secondary Research
- Annual Reports
- White Paper
- Latest Press Release
- Industry Association
- Paid Database
- Investor Presentations

Step 4 - Data Triangulation
Involves using different sources of information in order to increase the validity of a study
These sources are likely to be stakeholders in a program - participants, other researchers, program staff, other community members, and so on.
Then we put all data in single framework & apply various statistical tools to find out the dynamic on the market.
During the analysis stage, feedback from the stakeholder groups would be compared to determine areas of agreement as well as areas of divergence
