

Key Insights
The global hydrogen gas market, projected to reach $204.86 billion by 2025, is poised for substantial expansion. Driven by the urgent global shift towards decarbonization and the increasing demand for sustainable energy solutions, the market is expected to witness a compound annual growth rate (CAGR) of 8.6% from 2025 to 2033. Key growth catalysts include the expanding fuel cell vehicle (FCV) sector, increased hydrogen utilization in ammonia production, and its growing application in refining processes and direct reduced iron (DRI) manufacturing. Supportive government policies and incentives for renewable energy further bolster market dynamics. Emerging challenges, such as infrastructure constraints and production costs, are being addressed through ongoing technological innovations in hydrogen production and storage.
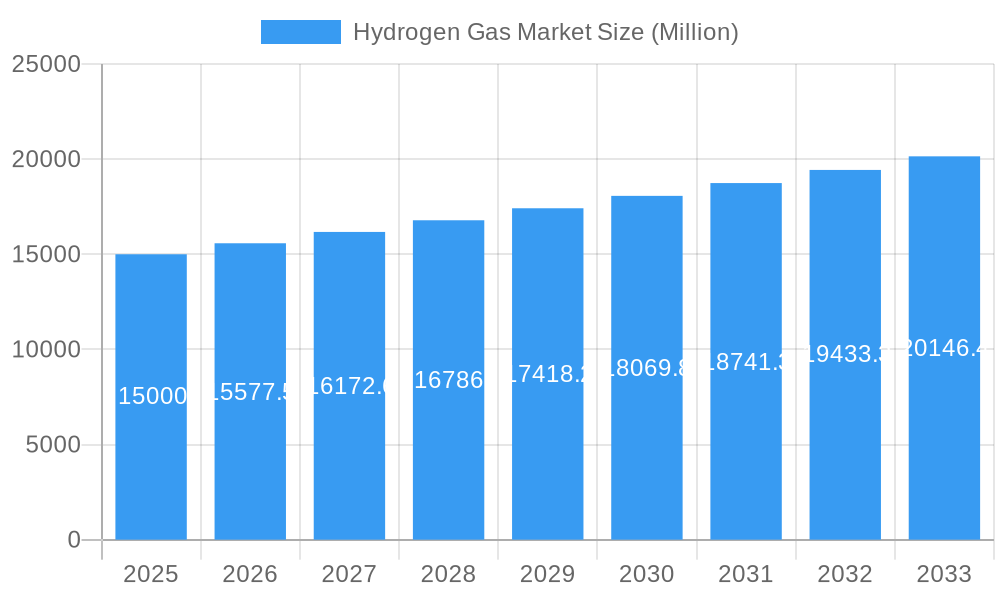
Hydrogen Gas Market Market Size (In Billion)
The market is segmented by distribution channels including pipelines, high-pressure tube trailers, and cylinders, and by applications such as ammonia, methanol, refining, DRI, FCVs, and others. The Asia Pacific region, led by China and India, is anticipated to be a significant growth engine due to substantial investments in renewable energy and burgeoning industrial activity. North America and Europe also command significant market shares, supported by robust government backing for hydrogen initiatives and well-established industrial infrastructure.
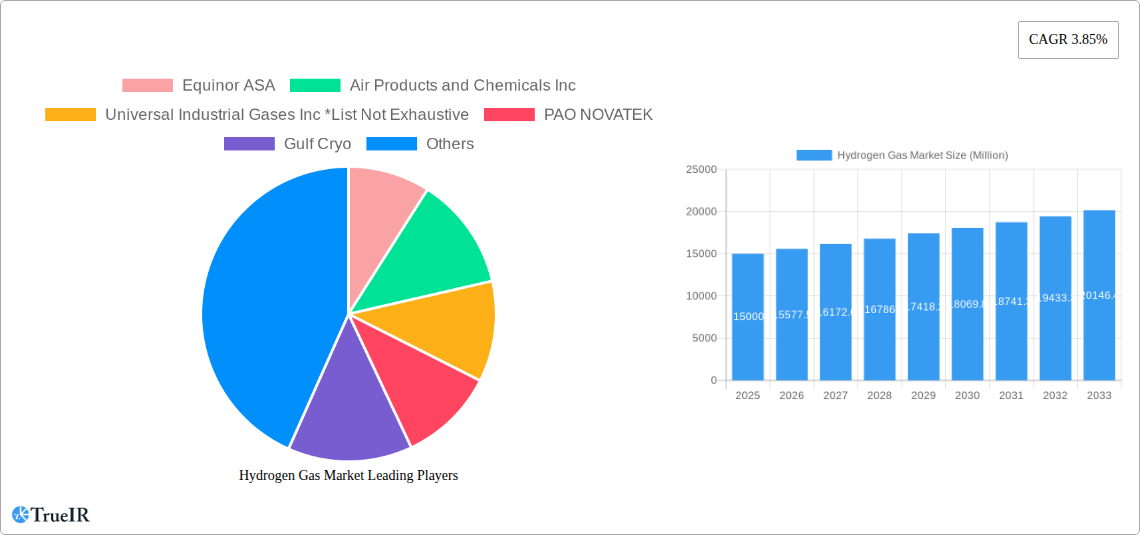
Hydrogen Gas Market Company Market Share
The competitive environment features prominent global players such as Air Products and Chemicals, Linde plc, Air Liquide, and BASF SE, alongside specialized regional entities. These companies are actively pursuing strategic investments in expanding production capabilities, pioneering innovative technologies, and forming key partnerships to solidify their market positions. Continued technological advancements, leading to reduced production costs and broader adoption of hydrogen-based energy solutions across diverse industries, will be crucial for unlocking the market's full potential. Innovations in hydrogen storage and transportation technologies are expected to play a pivotal role in this advancement.
Hydrogen Gas Market Report: A Comprehensive Analysis (2019-2033)
This dynamic report provides a comprehensive analysis of the Hydrogen Gas Market, offering invaluable insights for industry stakeholders, investors, and researchers. Leveraging extensive data from 2019-2024 (historical period) and projections through 2033, this report delivers a robust forecast based on the estimated year 2025. We cover market size, segmentation, competitive landscape, and future growth potential, incorporating recent industry developments and key player strategies. The study period encompasses 2019-2033, with a focus on the forecast period of 2025-2033 and a base year of 2025.
Hydrogen Gas Market Structure & Competitive Landscape
The Hydrogen Gas Market exhibits a moderately concentrated structure, with several multinational corporations and regional players vying for market share. While precise concentration ratios require further detailed analysis, a few key players hold a significant portion of the global market. The market is characterized by ongoing innovation in production technologies (e.g., electrolysis, steam methane reforming), storage solutions, and distribution infrastructure. Stringent environmental regulations, particularly concerning carbon emissions, are major drivers shaping the market landscape. The emergence of green hydrogen production methods further complicates the competitive landscape and incentivizes innovation. Product substitutes, such as natural gas and other fossil fuels, are under increasing pressure due to sustainability concerns. Significant M&A activity, as detailed in the "Industry Milestones" section, indicates a trend towards consolidation and vertical integration. The market displays distinct end-user segmentation across various sectors, including ammonia production, refining, methanol synthesis, and fuel cell vehicles. The total M&A volume within the last 5 years was approximately xx Million.
Hydrogen Gas Market Trends & Opportunities
The global hydrogen gas market is experiencing substantial growth, with a projected CAGR of xx% during the forecast period (2025-2033). This expansion is driven by several key factors: escalating demand for clean energy, increasing government incentives for renewable hydrogen production, and advancements in hydrogen storage and transportation technologies. Market penetration rates for hydrogen in various applications are increasing steadily, particularly in the transportation and industrial sectors. A notable technological shift involves the transition from grey (fossil fuel-based) hydrogen to green (renewable energy-based) hydrogen, significantly altering the production landscape and creating new opportunities for technology providers. Shifting consumer preferences towards environmentally friendly products and services are fueling this trend. The competitive dynamics are characterized by intense R&D activities, strategic partnerships, and mergers and acquisitions, all aiming to gain a competitive edge. The global market size in 2025 is estimated to be xx Million. By 2033, it is projected to reach xx Million.
Dominant Markets & Segments in Hydrogen Gas Market
While the market is expanding globally, certain regions and segments are experiencing faster growth.
Leading Regions/Countries: Currently, xx are leading the market, but xx is expected to witness significant growth in the coming years.
Dominant Distribution Segments: Pipelines currently dominate the distribution segment due to their efficiency in transporting large volumes of hydrogen. However, high-pressure tube trailers are gaining traction for medium-range transportation, while cylinders remain significant for smaller-scale applications.
Leading Application Segments: The refining and ammonia sectors currently consume the majority of hydrogen gas. However, the fuel cell vehicle (FCV) segment is expected to witness rapid growth, driven by increasing adoption of hydrogen-powered vehicles and government support for this transition.
Key Growth Drivers:
- Government Policies and Incentives: Significant investments and supportive policies in several countries are accelerating hydrogen adoption.
- Infrastructure Development: Investments in hydrogen pipelines, storage facilities, and refueling stations are facilitating market expansion.
- Technological Advancements: Improvements in hydrogen production, storage, and transportation technologies are making it more cost-effective and efficient.
Hydrogen Gas Market Product Analysis
The hydrogen gas market showcases a diverse range of products, each catering to specific applications. Innovations focus on improving production efficiency, reducing costs, and enhancing safety. The key differentiators are often related to purity levels, pressure, and delivery methods. Green hydrogen production technologies are gaining significant traction, providing a competitive advantage due to their lower carbon footprint compared to grey hydrogen. The market is witnessing increased adoption of advanced storage and transportation solutions, such as high-pressure cylinders and specialized pipelines, which enhance safety and efficiency.
Key Drivers, Barriers & Challenges in Hydrogen Gas Market
Key Drivers: The market is propelled by factors such as rising environmental concerns, supportive government policies, and the decreasing cost of renewable energy sources, leading to increased green hydrogen production. Technological advancements in electrolysis and fuel cell technology further accelerate adoption.
Key Challenges: High production costs for green hydrogen, limited infrastructure for storage and distribution, and safety concerns related to hydrogen handling are significant hurdles. Furthermore, strong competition from established fossil fuel industries poses a challenge to market penetration. Supply chain disruptions may lead to price volatility and limited availability of critical materials.
Growth Drivers in the Hydrogen Gas Market Market
The growth of the hydrogen gas market is driven by technological advancements in hydrogen production, namely electrolysis, and the increasing demand for clean energy sources. Favorable government policies and regulations, promoting the use of hydrogen in various applications, further fuel this growth. Furthermore, the declining cost of renewable energy sources is making green hydrogen production more economically viable.
Challenges Impacting Hydrogen Gas Market Growth
The major barriers hindering market growth include the high initial investment required for infrastructure development, safety concerns related to hydrogen storage and transportation, and the lack of a fully developed hydrogen supply chain. Furthermore, competition from conventional energy sources and regulatory uncertainties in some regions could also hinder expansion.
Key Players Shaping the Hydrogen Gas Market Market
- Equinor ASA
- Air Products and Chemicals Inc
- Universal Industrial Gases Inc
- PAO NOVATEK
- Gulf Cryo
- Lords Chloro Alkali Limited
- Gujarat Alkalies and Chemicals Limited
- Matheson Tri-Gas Inc
- BASF SE
- Aditya Birla Chemicals
- Linde plc
- TAIYO NIPPON SANSO CORPORATION
- Air Liquide
- Messer SE & Co KGaA
Significant Hydrogen Gas Market Industry Milestones
- June 2022: BASF and Shell collaborated to advance green hydrogen production technologies.
- June 2022: Equinor and SSE Thermal acquired Triton Power, aiming to integrate hydrogen into existing power generation infrastructure.
- July 2022: Air Products and VPI partnered to develop the Humber Hydrogen Hub, a large-scale low-carbon hydrogen production facility.
Future Outlook for Hydrogen Gas Market Market
The hydrogen gas market is poised for significant growth, driven by increasing government support, technological advancements, and the urgent need to decarbonize various sectors. Strategic investments in infrastructure and continued innovation in production methods will play a crucial role in shaping the market's trajectory. The potential for hydrogen to become a major energy carrier is substantial, offering numerous opportunities for companies across the value chain.
Hydrogen Gas Market Segmentation
-
1. Distribution
- 1.1. Pipelines
- 1.2. High-pressure Tube Trailers
- 1.3. Cylinders
-
2. Application
- 2.1. Ammonia
- 2.2. Methanol
- 2.3. Refining
- 2.4. Direct Reduced Iron (DRI)
- 2.5. Fuel Cell Vehicles (FCV)
- 2.6. Other Ap
Hydrogen Gas Market Segmentation By Geography
-
1. Asia Pacific
- 1.1. China
- 1.2. India
- 1.3. Japan
- 1.4. South Korea
- 1.5. Malaysia
- 1.6. Thailand
- 1.7. Indonesia
- 1.8. Vietnam
- 1.9. Rest of Asia Pacific
-
2. North America
- 2.1. United States
- 2.2. Canada
- 2.3. Mexico
-
3. Europe
- 3.1. Germany
- 3.2. United Kingdom
- 3.3. Italy
- 3.4. France
- 3.5. Spain
- 3.6. NORDIC
- 3.7. Turkey
- 3.8. Russia
- 3.9. Rest of Europe
-
4. South America
- 4.1. Brazil
- 4.2. Argentina
- 4.3. Colombia
- 4.4. Rest of South America
-
5. Middle East and Africa
- 5.1. Saudi Arabia
- 5.2. South Africa
- 5.3. Nigeria
- 5.4. Qatar
- 5.5. Egypt
- 5.6. United Arab Emirates
- 5.7. Rest of Middle East and Africa
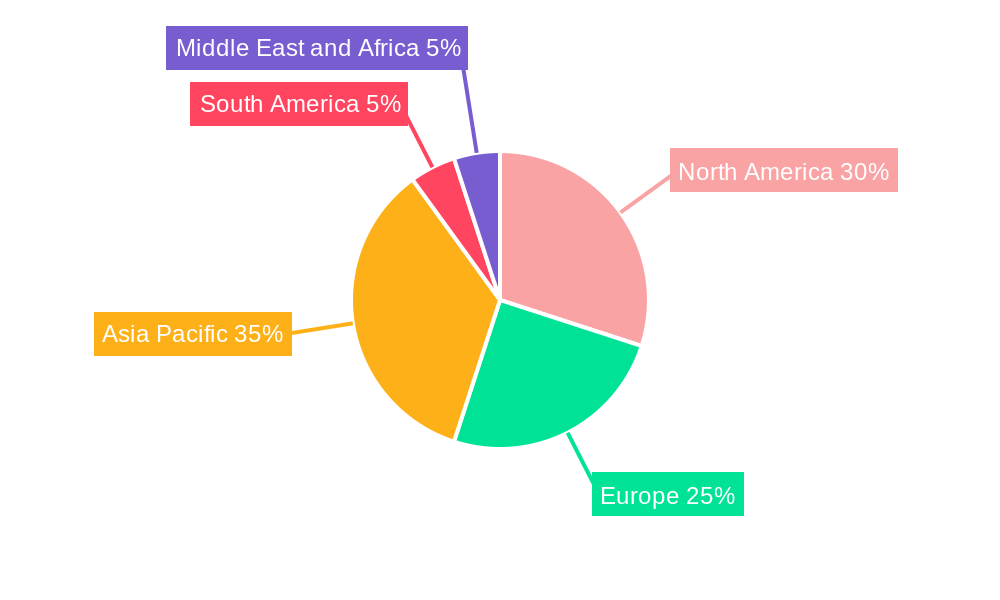
Hydrogen Gas Market Regional Market Share
Geographic Coverage of Hydrogen Gas Market
Hydrogen Gas Market REPORT HIGHLIGHTS
| Aspects | Details |
|---|---|
| Study Period | 2020-2034 |
| Base Year | 2025 |
| Estimated Year | 2026 |
| Forecast Period | 2026-2034 |
| Historical Period | 2020-2025 |
| Growth Rate | CAGR of 8.6% from 2020-2034 |
| Segmentation |
|
Table of Contents
- 1. Introduction
- 1.1. Research Scope
- 1.2. Market Segmentation
- 1.3. Research Objective
- 1.4. Definitions and Assumptions
- 2. Executive Summary
- 2.1. Market Snapshot
- 3. Market Dynamics
- 3.1. Market Drivers
- 3.2. Market Restrains
- 3.3. Market Trends
- 3.4. Market Opportunities
- 4. Market Factor Analysis
- 4.1. Porters Five Forces
- 4.1.1. Bargaining Power of Suppliers
- 4.1.2. Bargaining Power of Buyers
- 4.1.3. Threat of New Entrants
- 4.1.4. Threat of Substitutes
- 4.1.5. Competitive Rivalry
- 4.2. PESTEL analysis
- 4.3. BCG Analysis
- 4.3.1. Stars (High Growth, High Market Share)
- 4.3.2. Cash Cows (Low Growth, High Market Share)
- 4.3.3. Question Mark (High Growth, Low Market Share)
- 4.3.4. Dogs (Low Growth, Low Market Share)
- 4.4. Ansoff Matrix Analysis
- 4.5. Supply Chain Analysis
- 4.6. Regulatory Landscape
- 4.7. Current Market Potential and Opportunity Assessment (TAM–SAM–SOM Framework)
- 4.8. TIR Analyst Note
- 4.1. Porters Five Forces
- 5. Market Analysis, Insights and Forecast 2021-2033
- 5.1. Market Analysis, Insights and Forecast - by Distribution
- 5.1.1. Pipelines
- 5.1.2. High-pressure Tube Trailers
- 5.1.3. Cylinders
- 5.2. Market Analysis, Insights and Forecast - by Application
- 5.2.1. Ammonia
- 5.2.2. Methanol
- 5.2.3. Refining
- 5.2.4. Direct Reduced Iron (DRI)
- 5.2.5. Fuel Cell Vehicles (FCV)
- 5.2.6. Other Ap
- 5.3. Market Analysis, Insights and Forecast - by Region
- 5.3.1. Asia Pacific
- 5.3.2. North America
- 5.3.3. Europe
- 5.3.4. South America
- 5.3.5. Middle East and Africa
- 5.1. Market Analysis, Insights and Forecast - by Distribution
- 6. Global Hydrogen Gas Market Analysis, Insights and Forecast, 2021-2033
- 6.1. Market Analysis, Insights and Forecast - by Distribution
- 6.1.1. Pipelines
- 6.1.2. High-pressure Tube Trailers
- 6.1.3. Cylinders
- 6.2. Market Analysis, Insights and Forecast - by Application
- 6.2.1. Ammonia
- 6.2.2. Methanol
- 6.2.3. Refining
- 6.2.4. Direct Reduced Iron (DRI)
- 6.2.5. Fuel Cell Vehicles (FCV)
- 6.2.6. Other Ap
- 6.1. Market Analysis, Insights and Forecast - by Distribution
- 7. Asia Pacific Hydrogen Gas Market Analysis, Insights and Forecast, 2020-2032
- 7.1. Market Analysis, Insights and Forecast - by Distribution
- 7.1.1. Pipelines
- 7.1.2. High-pressure Tube Trailers
- 7.1.3. Cylinders
- 7.2. Market Analysis, Insights and Forecast - by Application
- 7.2.1. Ammonia
- 7.2.2. Methanol
- 7.2.3. Refining
- 7.2.4. Direct Reduced Iron (DRI)
- 7.2.5. Fuel Cell Vehicles (FCV)
- 7.2.6. Other Ap
- 7.1. Market Analysis, Insights and Forecast - by Distribution
- 8. North America Hydrogen Gas Market Analysis, Insights and Forecast, 2020-2032
- 8.1. Market Analysis, Insights and Forecast - by Distribution
- 8.1.1. Pipelines
- 8.1.2. High-pressure Tube Trailers
- 8.1.3. Cylinders
- 8.2. Market Analysis, Insights and Forecast - by Application
- 8.2.1. Ammonia
- 8.2.2. Methanol
- 8.2.3. Refining
- 8.2.4. Direct Reduced Iron (DRI)
- 8.2.5. Fuel Cell Vehicles (FCV)
- 8.2.6. Other Ap
- 8.1. Market Analysis, Insights and Forecast - by Distribution
- 9. Europe Hydrogen Gas Market Analysis, Insights and Forecast, 2020-2032
- 9.1. Market Analysis, Insights and Forecast - by Distribution
- 9.1.1. Pipelines
- 9.1.2. High-pressure Tube Trailers
- 9.1.3. Cylinders
- 9.2. Market Analysis, Insights and Forecast - by Application
- 9.2.1. Ammonia
- 9.2.2. Methanol
- 9.2.3. Refining
- 9.2.4. Direct Reduced Iron (DRI)
- 9.2.5. Fuel Cell Vehicles (FCV)
- 9.2.6. Other Ap
- 9.1. Market Analysis, Insights and Forecast - by Distribution
- 10. South America Hydrogen Gas Market Analysis, Insights and Forecast, 2020-2032
- 10.1. Market Analysis, Insights and Forecast - by Distribution
- 10.1.1. Pipelines
- 10.1.2. High-pressure Tube Trailers
- 10.1.3. Cylinders
- 10.2. Market Analysis, Insights and Forecast - by Application
- 10.2.1. Ammonia
- 10.2.2. Methanol
- 10.2.3. Refining
- 10.2.4. Direct Reduced Iron (DRI)
- 10.2.5. Fuel Cell Vehicles (FCV)
- 10.2.6. Other Ap
- 10.1. Market Analysis, Insights and Forecast - by Distribution
- 11. Middle East and Africa Hydrogen Gas Market Analysis, Insights and Forecast, 2020-2032
- 11.1. Market Analysis, Insights and Forecast - by Distribution
- 11.1.1. Pipelines
- 11.1.2. High-pressure Tube Trailers
- 11.1.3. Cylinders
- 11.2. Market Analysis, Insights and Forecast - by Application
- 11.2.1. Ammonia
- 11.2.2. Methanol
- 11.2.3. Refining
- 11.2.4. Direct Reduced Iron (DRI)
- 11.2.5. Fuel Cell Vehicles (FCV)
- 11.2.6. Other Ap
- 11.1. Market Analysis, Insights and Forecast - by Distribution
- 12. Competitive Analysis
- 12.1. Company Profiles
- 12.1.1 Equinor ASA
- 12.1.1.1. Company Overview
- 12.1.1.2. Products
- 12.1.1.3. Company Financials
- 12.1.1.4. SWOT Analysis
- 12.1.2 Air Products and Chemicals Inc
- 12.1.2.1. Company Overview
- 12.1.2.2. Products
- 12.1.2.3. Company Financials
- 12.1.2.4. SWOT Analysis
- 12.1.3 Universal Industrial Gases Inc *List Not Exhaustive
- 12.1.3.1. Company Overview
- 12.1.3.2. Products
- 12.1.3.3. Company Financials
- 12.1.3.4. SWOT Analysis
- 12.1.4 PAO NOVATEK
- 12.1.4.1. Company Overview
- 12.1.4.2. Products
- 12.1.4.3. Company Financials
- 12.1.4.4. SWOT Analysis
- 12.1.5 Gulf Cryo
- 12.1.5.1. Company Overview
- 12.1.5.2. Products
- 12.1.5.3. Company Financials
- 12.1.5.4. SWOT Analysis
- 12.1.6 Lords Chloro Alkali Limited
- 12.1.6.1. Company Overview
- 12.1.6.2. Products
- 12.1.6.3. Company Financials
- 12.1.6.4. SWOT Analysis
- 12.1.7 Gujarat Alkalies and Chemicals Limited
- 12.1.7.1. Company Overview
- 12.1.7.2. Products
- 12.1.7.3. Company Financials
- 12.1.7.4. SWOT Analysis
- 12.1.8 Matheson Tri-Gas Inc
- 12.1.8.1. Company Overview
- 12.1.8.2. Products
- 12.1.8.3. Company Financials
- 12.1.8.4. SWOT Analysis
- 12.1.9 BASF SE
- 12.1.9.1. Company Overview
- 12.1.9.2. Products
- 12.1.9.3. Company Financials
- 12.1.9.4. SWOT Analysis
- 12.1.10 Aditya Birla Chemicals
- 12.1.10.1. Company Overview
- 12.1.10.2. Products
- 12.1.10.3. Company Financials
- 12.1.10.4. SWOT Analysis
- 12.1.11 Linde plc
- 12.1.11.1. Company Overview
- 12.1.11.2. Products
- 12.1.11.3. Company Financials
- 12.1.11.4. SWOT Analysis
- 12.1.12 TAIYO NIPPON SANSO CORPORATION
- 12.1.12.1. Company Overview
- 12.1.12.2. Products
- 12.1.12.3. Company Financials
- 12.1.12.4. SWOT Analysis
- 12.1.13 Air Liquide
- 12.1.13.1. Company Overview
- 12.1.13.2. Products
- 12.1.13.3. Company Financials
- 12.1.13.4. SWOT Analysis
- 12.1.14 Messer SE & Co KGaA
- 12.1.14.1. Company Overview
- 12.1.14.2. Products
- 12.1.14.3. Company Financials
- 12.1.14.4. SWOT Analysis
- 12.1.1 Equinor ASA
- 12.2. Market Entropy
- 12.2.1 Company's Key Areas Served
- 12.2.2 Recent Developments
- 12.3. Company Market Share Analysis 2025
- 12.3.1 Top 5 Companies Market Share Analysis
- 12.3.2 Top 3 Companies Market Share Analysis
- 12.4. List of Potential Customers
- 13. Research Methodology
List of Figures
- Figure 1: Global Hydrogen Gas Market Revenue Breakdown (billion, %) by Region 2025 & 2033
- Figure 2: Global Hydrogen Gas Market Volume Breakdown (Million, %) by Region 2025 & 2033
- Figure 3: Asia Pacific Hydrogen Gas Market Revenue (billion), by Distribution 2025 & 2033
- Figure 4: Asia Pacific Hydrogen Gas Market Volume (Million), by Distribution 2025 & 2033
- Figure 5: Asia Pacific Hydrogen Gas Market Revenue Share (%), by Distribution 2025 & 2033
- Figure 6: Asia Pacific Hydrogen Gas Market Volume Share (%), by Distribution 2025 & 2033
- Figure 7: Asia Pacific Hydrogen Gas Market Revenue (billion), by Application 2025 & 2033
- Figure 8: Asia Pacific Hydrogen Gas Market Volume (Million), by Application 2025 & 2033
- Figure 9: Asia Pacific Hydrogen Gas Market Revenue Share (%), by Application 2025 & 2033
- Figure 10: Asia Pacific Hydrogen Gas Market Volume Share (%), by Application 2025 & 2033
- Figure 11: Asia Pacific Hydrogen Gas Market Revenue (billion), by Country 2025 & 2033
- Figure 12: Asia Pacific Hydrogen Gas Market Volume (Million), by Country 2025 & 2033
- Figure 13: Asia Pacific Hydrogen Gas Market Revenue Share (%), by Country 2025 & 2033
- Figure 14: Asia Pacific Hydrogen Gas Market Volume Share (%), by Country 2025 & 2033
- Figure 15: North America Hydrogen Gas Market Revenue (billion), by Distribution 2025 & 2033
- Figure 16: North America Hydrogen Gas Market Volume (Million), by Distribution 2025 & 2033
- Figure 17: North America Hydrogen Gas Market Revenue Share (%), by Distribution 2025 & 2033
- Figure 18: North America Hydrogen Gas Market Volume Share (%), by Distribution 2025 & 2033
- Figure 19: North America Hydrogen Gas Market Revenue (billion), by Application 2025 & 2033
- Figure 20: North America Hydrogen Gas Market Volume (Million), by Application 2025 & 2033
- Figure 21: North America Hydrogen Gas Market Revenue Share (%), by Application 2025 & 2033
- Figure 22: North America Hydrogen Gas Market Volume Share (%), by Application 2025 & 2033
- Figure 23: North America Hydrogen Gas Market Revenue (billion), by Country 2025 & 2033
- Figure 24: North America Hydrogen Gas Market Volume (Million), by Country 2025 & 2033
- Figure 25: North America Hydrogen Gas Market Revenue Share (%), by Country 2025 & 2033
- Figure 26: North America Hydrogen Gas Market Volume Share (%), by Country 2025 & 2033
- Figure 27: Europe Hydrogen Gas Market Revenue (billion), by Distribution 2025 & 2033
- Figure 28: Europe Hydrogen Gas Market Volume (Million), by Distribution 2025 & 2033
- Figure 29: Europe Hydrogen Gas Market Revenue Share (%), by Distribution 2025 & 2033
- Figure 30: Europe Hydrogen Gas Market Volume Share (%), by Distribution 2025 & 2033
- Figure 31: Europe Hydrogen Gas Market Revenue (billion), by Application 2025 & 2033
- Figure 32: Europe Hydrogen Gas Market Volume (Million), by Application 2025 & 2033
- Figure 33: Europe Hydrogen Gas Market Revenue Share (%), by Application 2025 & 2033
- Figure 34: Europe Hydrogen Gas Market Volume Share (%), by Application 2025 & 2033
- Figure 35: Europe Hydrogen Gas Market Revenue (billion), by Country 2025 & 2033
- Figure 36: Europe Hydrogen Gas Market Volume (Million), by Country 2025 & 2033
- Figure 37: Europe Hydrogen Gas Market Revenue Share (%), by Country 2025 & 2033
- Figure 38: Europe Hydrogen Gas Market Volume Share (%), by Country 2025 & 2033
- Figure 39: South America Hydrogen Gas Market Revenue (billion), by Distribution 2025 & 2033
- Figure 40: South America Hydrogen Gas Market Volume (Million), by Distribution 2025 & 2033
- Figure 41: South America Hydrogen Gas Market Revenue Share (%), by Distribution 2025 & 2033
- Figure 42: South America Hydrogen Gas Market Volume Share (%), by Distribution 2025 & 2033
- Figure 43: South America Hydrogen Gas Market Revenue (billion), by Application 2025 & 2033
- Figure 44: South America Hydrogen Gas Market Volume (Million), by Application 2025 & 2033
- Figure 45: South America Hydrogen Gas Market Revenue Share (%), by Application 2025 & 2033
- Figure 46: South America Hydrogen Gas Market Volume Share (%), by Application 2025 & 2033
- Figure 47: South America Hydrogen Gas Market Revenue (billion), by Country 2025 & 2033
- Figure 48: South America Hydrogen Gas Market Volume (Million), by Country 2025 & 2033
- Figure 49: South America Hydrogen Gas Market Revenue Share (%), by Country 2025 & 2033
- Figure 50: South America Hydrogen Gas Market Volume Share (%), by Country 2025 & 2033
- Figure 51: Middle East and Africa Hydrogen Gas Market Revenue (billion), by Distribution 2025 & 2033
- Figure 52: Middle East and Africa Hydrogen Gas Market Volume (Million), by Distribution 2025 & 2033
- Figure 53: Middle East and Africa Hydrogen Gas Market Revenue Share (%), by Distribution 2025 & 2033
- Figure 54: Middle East and Africa Hydrogen Gas Market Volume Share (%), by Distribution 2025 & 2033
- Figure 55: Middle East and Africa Hydrogen Gas Market Revenue (billion), by Application 2025 & 2033
- Figure 56: Middle East and Africa Hydrogen Gas Market Volume (Million), by Application 2025 & 2033
- Figure 57: Middle East and Africa Hydrogen Gas Market Revenue Share (%), by Application 2025 & 2033
- Figure 58: Middle East and Africa Hydrogen Gas Market Volume Share (%), by Application 2025 & 2033
- Figure 59: Middle East and Africa Hydrogen Gas Market Revenue (billion), by Country 2025 & 2033
- Figure 60: Middle East and Africa Hydrogen Gas Market Volume (Million), by Country 2025 & 2033
- Figure 61: Middle East and Africa Hydrogen Gas Market Revenue Share (%), by Country 2025 & 2033
- Figure 62: Middle East and Africa Hydrogen Gas Market Volume Share (%), by Country 2025 & 2033
List of Tables
- Table 1: Global Hydrogen Gas Market Revenue billion Forecast, by Distribution 2020 & 2033
- Table 2: Global Hydrogen Gas Market Volume Million Forecast, by Distribution 2020 & 2033
- Table 3: Global Hydrogen Gas Market Revenue billion Forecast, by Application 2020 & 2033
- Table 4: Global Hydrogen Gas Market Volume Million Forecast, by Application 2020 & 2033
- Table 5: Global Hydrogen Gas Market Revenue billion Forecast, by Region 2020 & 2033
- Table 6: Global Hydrogen Gas Market Volume Million Forecast, by Region 2020 & 2033
- Table 7: Global Hydrogen Gas Market Revenue billion Forecast, by Distribution 2020 & 2033
- Table 8: Global Hydrogen Gas Market Volume Million Forecast, by Distribution 2020 & 2033
- Table 9: Global Hydrogen Gas Market Revenue billion Forecast, by Application 2020 & 2033
- Table 10: Global Hydrogen Gas Market Volume Million Forecast, by Application 2020 & 2033
- Table 11: Global Hydrogen Gas Market Revenue billion Forecast, by Country 2020 & 2033
- Table 12: Global Hydrogen Gas Market Volume Million Forecast, by Country 2020 & 2033
- Table 13: China Hydrogen Gas Market Revenue (billion) Forecast, by Application 2020 & 2033
- Table 14: China Hydrogen Gas Market Volume (Million) Forecast, by Application 2020 & 2033
- Table 15: India Hydrogen Gas Market Revenue (billion) Forecast, by Application 2020 & 2033
- Table 16: India Hydrogen Gas Market Volume (Million) Forecast, by Application 2020 & 2033
- Table 17: Japan Hydrogen Gas Market Revenue (billion) Forecast, by Application 2020 & 2033
- Table 18: Japan Hydrogen Gas Market Volume (Million) Forecast, by Application 2020 & 2033
- Table 19: South Korea Hydrogen Gas Market Revenue (billion) Forecast, by Application 2020 & 2033
- Table 20: South Korea Hydrogen Gas Market Volume (Million) Forecast, by Application 2020 & 2033
- Table 21: Malaysia Hydrogen Gas Market Revenue (billion) Forecast, by Application 2020 & 2033
- Table 22: Malaysia Hydrogen Gas Market Volume (Million) Forecast, by Application 2020 & 2033
- Table 23: Thailand Hydrogen Gas Market Revenue (billion) Forecast, by Application 2020 & 2033
- Table 24: Thailand Hydrogen Gas Market Volume (Million) Forecast, by Application 2020 & 2033
- Table 25: Indonesia Hydrogen Gas Market Revenue (billion) Forecast, by Application 2020 & 2033
- Table 26: Indonesia Hydrogen Gas Market Volume (Million) Forecast, by Application 2020 & 2033
- Table 27: Vietnam Hydrogen Gas Market Revenue (billion) Forecast, by Application 2020 & 2033
- Table 28: Vietnam Hydrogen Gas Market Volume (Million) Forecast, by Application 2020 & 2033
- Table 29: Rest of Asia Pacific Hydrogen Gas Market Revenue (billion) Forecast, by Application 2020 & 2033
- Table 30: Rest of Asia Pacific Hydrogen Gas Market Volume (Million) Forecast, by Application 2020 & 2033
- Table 31: Global Hydrogen Gas Market Revenue billion Forecast, by Distribution 2020 & 2033
- Table 32: Global Hydrogen Gas Market Volume Million Forecast, by Distribution 2020 & 2033
- Table 33: Global Hydrogen Gas Market Revenue billion Forecast, by Application 2020 & 2033
- Table 34: Global Hydrogen Gas Market Volume Million Forecast, by Application 2020 & 2033
- Table 35: Global Hydrogen Gas Market Revenue billion Forecast, by Country 2020 & 2033
- Table 36: Global Hydrogen Gas Market Volume Million Forecast, by Country 2020 & 2033
- Table 37: United States Hydrogen Gas Market Revenue (billion) Forecast, by Application 2020 & 2033
- Table 38: United States Hydrogen Gas Market Volume (Million) Forecast, by Application 2020 & 2033
- Table 39: Canada Hydrogen Gas Market Revenue (billion) Forecast, by Application 2020 & 2033
- Table 40: Canada Hydrogen Gas Market Volume (Million) Forecast, by Application 2020 & 2033
- Table 41: Mexico Hydrogen Gas Market Revenue (billion) Forecast, by Application 2020 & 2033
- Table 42: Mexico Hydrogen Gas Market Volume (Million) Forecast, by Application 2020 & 2033
- Table 43: Global Hydrogen Gas Market Revenue billion Forecast, by Distribution 2020 & 2033
- Table 44: Global Hydrogen Gas Market Volume Million Forecast, by Distribution 2020 & 2033
- Table 45: Global Hydrogen Gas Market Revenue billion Forecast, by Application 2020 & 2033
- Table 46: Global Hydrogen Gas Market Volume Million Forecast, by Application 2020 & 2033
- Table 47: Global Hydrogen Gas Market Revenue billion Forecast, by Country 2020 & 2033
- Table 48: Global Hydrogen Gas Market Volume Million Forecast, by Country 2020 & 2033
- Table 49: Germany Hydrogen Gas Market Revenue (billion) Forecast, by Application 2020 & 2033
- Table 50: Germany Hydrogen Gas Market Volume (Million) Forecast, by Application 2020 & 2033
- Table 51: United Kingdom Hydrogen Gas Market Revenue (billion) Forecast, by Application 2020 & 2033
- Table 52: United Kingdom Hydrogen Gas Market Volume (Million) Forecast, by Application 2020 & 2033
- Table 53: Italy Hydrogen Gas Market Revenue (billion) Forecast, by Application 2020 & 2033
- Table 54: Italy Hydrogen Gas Market Volume (Million) Forecast, by Application 2020 & 2033
- Table 55: France Hydrogen Gas Market Revenue (billion) Forecast, by Application 2020 & 2033
- Table 56: France Hydrogen Gas Market Volume (Million) Forecast, by Application 2020 & 2033
- Table 57: Spain Hydrogen Gas Market Revenue (billion) Forecast, by Application 2020 & 2033
- Table 58: Spain Hydrogen Gas Market Volume (Million) Forecast, by Application 2020 & 2033
- Table 59: NORDIC Hydrogen Gas Market Revenue (billion) Forecast, by Application 2020 & 2033
- Table 60: NORDIC Hydrogen Gas Market Volume (Million) Forecast, by Application 2020 & 2033
- Table 61: Turkey Hydrogen Gas Market Revenue (billion) Forecast, by Application 2020 & 2033
- Table 62: Turkey Hydrogen Gas Market Volume (Million) Forecast, by Application 2020 & 2033
- Table 63: Russia Hydrogen Gas Market Revenue (billion) Forecast, by Application 2020 & 2033
- Table 64: Russia Hydrogen Gas Market Volume (Million) Forecast, by Application 2020 & 2033
- Table 65: Rest of Europe Hydrogen Gas Market Revenue (billion) Forecast, by Application 2020 & 2033
- Table 66: Rest of Europe Hydrogen Gas Market Volume (Million) Forecast, by Application 2020 & 2033
- Table 67: Global Hydrogen Gas Market Revenue billion Forecast, by Distribution 2020 & 2033
- Table 68: Global Hydrogen Gas Market Volume Million Forecast, by Distribution 2020 & 2033
- Table 69: Global Hydrogen Gas Market Revenue billion Forecast, by Application 2020 & 2033
- Table 70: Global Hydrogen Gas Market Volume Million Forecast, by Application 2020 & 2033
- Table 71: Global Hydrogen Gas Market Revenue billion Forecast, by Country 2020 & 2033
- Table 72: Global Hydrogen Gas Market Volume Million Forecast, by Country 2020 & 2033
- Table 73: Brazil Hydrogen Gas Market Revenue (billion) Forecast, by Application 2020 & 2033
- Table 74: Brazil Hydrogen Gas Market Volume (Million) Forecast, by Application 2020 & 2033
- Table 75: Argentina Hydrogen Gas Market Revenue (billion) Forecast, by Application 2020 & 2033
- Table 76: Argentina Hydrogen Gas Market Volume (Million) Forecast, by Application 2020 & 2033
- Table 77: Colombia Hydrogen Gas Market Revenue (billion) Forecast, by Application 2020 & 2033
- Table 78: Colombia Hydrogen Gas Market Volume (Million) Forecast, by Application 2020 & 2033
- Table 79: Rest of South America Hydrogen Gas Market Revenue (billion) Forecast, by Application 2020 & 2033
- Table 80: Rest of South America Hydrogen Gas Market Volume (Million) Forecast, by Application 2020 & 2033
- Table 81: Global Hydrogen Gas Market Revenue billion Forecast, by Distribution 2020 & 2033
- Table 82: Global Hydrogen Gas Market Volume Million Forecast, by Distribution 2020 & 2033
- Table 83: Global Hydrogen Gas Market Revenue billion Forecast, by Application 2020 & 2033
- Table 84: Global Hydrogen Gas Market Volume Million Forecast, by Application 2020 & 2033
- Table 85: Global Hydrogen Gas Market Revenue billion Forecast, by Country 2020 & 2033
- Table 86: Global Hydrogen Gas Market Volume Million Forecast, by Country 2020 & 2033
- Table 87: Saudi Arabia Hydrogen Gas Market Revenue (billion) Forecast, by Application 2020 & 2033
- Table 88: Saudi Arabia Hydrogen Gas Market Volume (Million) Forecast, by Application 2020 & 2033
- Table 89: South Africa Hydrogen Gas Market Revenue (billion) Forecast, by Application 2020 & 2033
- Table 90: South Africa Hydrogen Gas Market Volume (Million) Forecast, by Application 2020 & 2033
- Table 91: Nigeria Hydrogen Gas Market Revenue (billion) Forecast, by Application 2020 & 2033
- Table 92: Nigeria Hydrogen Gas Market Volume (Million) Forecast, by Application 2020 & 2033
- Table 93: Qatar Hydrogen Gas Market Revenue (billion) Forecast, by Application 2020 & 2033
- Table 94: Qatar Hydrogen Gas Market Volume (Million) Forecast, by Application 2020 & 2033
- Table 95: Egypt Hydrogen Gas Market Revenue (billion) Forecast, by Application 2020 & 2033
- Table 96: Egypt Hydrogen Gas Market Volume (Million) Forecast, by Application 2020 & 2033
- Table 97: United Arab Emirates Hydrogen Gas Market Revenue (billion) Forecast, by Application 2020 & 2033
- Table 98: United Arab Emirates Hydrogen Gas Market Volume (Million) Forecast, by Application 2020 & 2033
- Table 99: Rest of Middle East and Africa Hydrogen Gas Market Revenue (billion) Forecast, by Application 2020 & 2033
- Table 100: Rest of Middle East and Africa Hydrogen Gas Market Volume (Million) Forecast, by Application 2020 & 2033
Frequently Asked Questions
1. What is the projected Compound Annual Growth Rate (CAGR) of the Hydrogen Gas Market?
The projected CAGR is approximately 8.6%.
2. Which companies are prominent players in the Hydrogen Gas Market?
Key companies in the market include Equinor ASA, Air Products and Chemicals Inc, Universal Industrial Gases Inc *List Not Exhaustive, PAO NOVATEK, Gulf Cryo, Lords Chloro Alkali Limited, Gujarat Alkalies and Chemicals Limited, Matheson Tri-Gas Inc, BASF SE, Aditya Birla Chemicals, Linde plc, TAIYO NIPPON SANSO CORPORATION, Air Liquide, Messer SE & Co KGaA.
3. What are the main segments of the Hydrogen Gas Market?
The market segments include Distribution, Application.
4. Can you provide details about the market size?
The market size is estimated to be USD 204.86 billion as of 2022.
5. What are some drivers contributing to market growth?
Increasing Demand From Chemical Industry; Expanding Usage Of Hydrogen In Refinery.
6. What are the notable trends driving market growth?
Ammonia Production to Dominate the Market Demand.
7. Are there any restraints impacting market growth?
High Production Cost Of Blue And Green Hydrogen; High Transportation And Storage Cost.
8. Can you provide examples of recent developments in the market?
July 2022: Air Products and VPI (a power generator company) signed a joint development agreement for driving the 'Humber Hydrogen Hub' or 'H3', which seeks to develop an 800 MW low-carbon hydrogen production facility in Immingham, United Kingdom.
9. What pricing options are available for accessing the report?
Pricing options include single-user, multi-user, and enterprise licenses priced at USD 4750, USD 5250, and USD 8750 respectively.
10. Is the market size provided in terms of value or volume?
The market size is provided in terms of value, measured in billion and volume, measured in Million.
11. Are there any specific market keywords associated with the report?
Yes, the market keyword associated with the report is "Hydrogen Gas Market," which aids in identifying and referencing the specific market segment covered.
12. How do I determine which pricing option suits my needs best?
The pricing options vary based on user requirements and access needs. Individual users may opt for single-user licenses, while businesses requiring broader access may choose multi-user or enterprise licenses for cost-effective access to the report.
13. Are there any additional resources or data provided in the Hydrogen Gas Market report?
While the report offers comprehensive insights, it's advisable to review the specific contents or supplementary materials provided to ascertain if additional resources or data are available.
14. How can I stay updated on further developments or reports in the Hydrogen Gas Market?
To stay informed about further developments, trends, and reports in the Hydrogen Gas Market, consider subscribing to industry newsletters, following relevant companies and organizations, or regularly checking reputable industry news sources and publications.
Methodology
Step 1 - Identification of Relevant Samples Size from Population Database


Step 2 - Approaches for Defining Global Market Size (Value, Volume* & Price*)

Note*: In applicable scenarios
Step 3 - Data Sources
Primary Research
- Web Analytics
- Survey Reports
- Research Institute
- Latest Research Reports
- Opinion Leaders
Secondary Research
- Annual Reports
- White Paper
- Latest Press Release
- Industry Association
- Paid Database
- Investor Presentations

Step 4 - Data Triangulation
Involves using different sources of information in order to increase the validity of a study
These sources are likely to be stakeholders in a program - participants, other researchers, program staff, other community members, and so on.
Then we put all data in single framework & apply various statistical tools to find out the dynamic on the market.
During the analysis stage, feedback from the stakeholder groups would be compared to determine areas of agreement as well as areas of divergence