

Key Insights
India's Engineering, Procurement, and Construction (EPC) sector for power generation is poised for substantial growth. The market is projected to expand at a Compound Annual Growth Rate (CAGR) of 6.4% from a base year of 2024. This expansion is primarily driven by India's aggressive renewable energy objectives, necessitating significant investment across thermal, hydro, nuclear, and particularly non-hydro renewable energy projects. Government policies aimed at energy self-sufficiency and sustainable development, coupled with escalating energy demand from a burgeoning population and industrial base, are key growth catalysts. The market is segmented by power generation source, with non-hydro renewables such as solar and wind experiencing the most rapid development due to falling costs and favorable policies. Leading companies including Larsen & Toubro, Sterling and Wilson Solar, and Bharat Heavy Electricals Limited are strategically positioned to benefit from this upward trend. Intense competition is anticipated, with the emergence of international players and specialized domestic EPC firms focused on renewable energy. Significant growth is also expected in regions like North and West India, attributed to superior solar irradiation and established infrastructure.
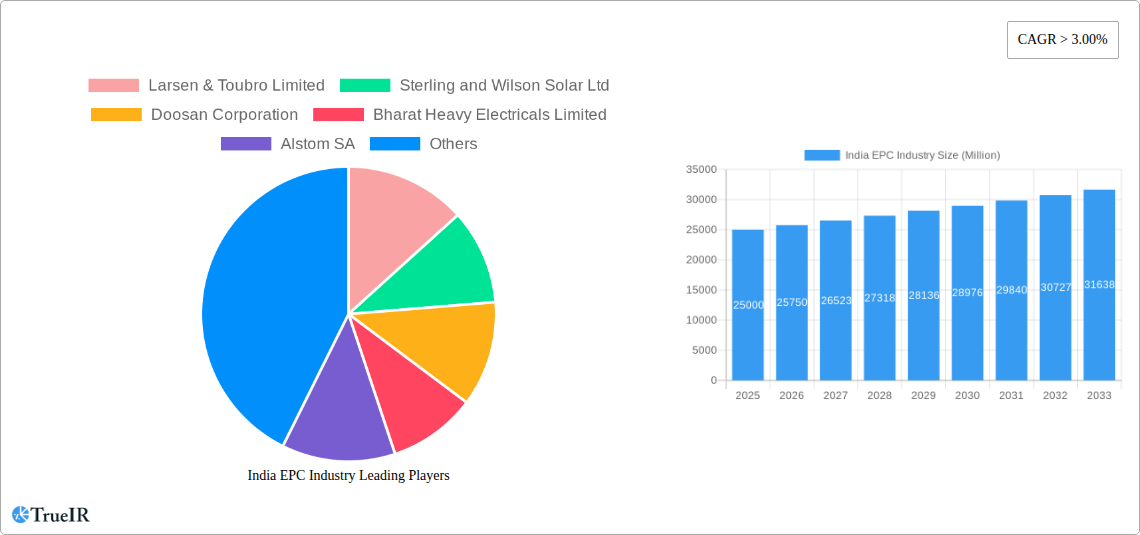
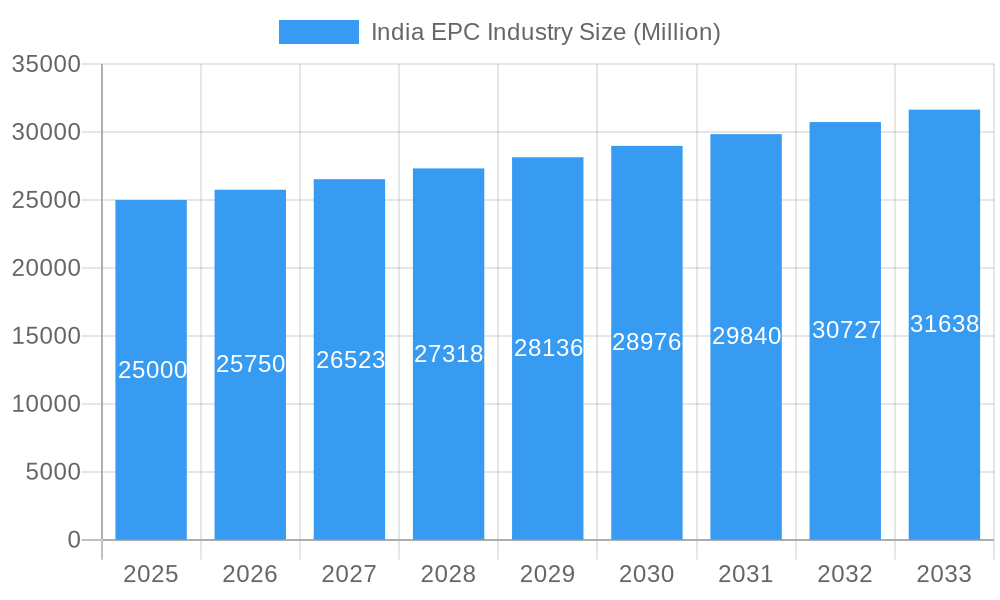
India EPC Industry Market Size (In Billion)
Despite the positive outlook, challenges persist, including land acquisition complexities, regulatory obstacles, and the intermittent availability of financing, which can impact project schedules and financial outcomes. The industry is also under pressure to integrate sustainable methodologies and bolster supply chain robustness. Company success will hinge on adaptability to technological innovations, proficient risk management, and securing a robust project pipeline within this dynamic and competitive environment. Sustained growth is expected to attract increased foreign direct investment and domestic private sector engagement, further enhancing sector expansion and modernization. The adoption of digitalization and advanced technologies will be crucial for optimizing project execution and improving operational efficiency. The market size is estimated at 39.1 billion.
India EPC Industry Company Market Share
India EPC Industry Report: 2019-2033 Forecast
This comprehensive report provides a detailed analysis of the burgeoning India EPC (Engineering, Procurement, and Construction) industry, offering invaluable insights for investors, industry professionals, and strategic planners. The study covers the period 2019-2033, with a base year of 2025 and a forecast period from 2025-2033. This in-depth analysis leverages extensive market research and data to provide a clear understanding of market size, growth drivers, key players, and future trends. Expect detailed breakdowns of market segments, competitive landscapes, and regulatory influences shaping this dynamic sector. The report is packed with actionable data points and strategic recommendations.
India EPC Industry Market Structure & Competitive Landscape
The Indian EPC market is characterized by a moderately concentrated structure, with a few large players dominating various segments. The Herfindahl-Hirschman Index (HHI) for the overall market in 2024 is estimated at xx, indicating a moderately concentrated market. This concentration is driven by the significant capital investment required for large-scale projects and the expertise needed to manage complex EPC contracts. Innovation is fueled by the demand for cost-effective and sustainable solutions, particularly in renewable energy. Regulatory changes, such as stricter environmental norms and streamlined approval processes, significantly impact market dynamics. Product substitution is evident with increasing adoption of renewable energy technologies. The market comprises various end-user segments, including power generation companies, industrial manufacturers, and infrastructure developers. The M&A activity in the Indian EPC sector witnessed a volume of xx deals valued at approximately xx Million USD in the historical period.
- Market Concentration: Moderately concentrated, with HHI at xx in 2024.
- Innovation Drivers: Demand for sustainable and cost-effective solutions, particularly in renewable energy.
- Regulatory Impacts: Stringent environmental norms and streamlined approval processes are major influences.
- Product Substitutes: Increasing adoption of renewable energy technologies, creating competition with traditional power generation methods.
- End-User Segmentation: Power generation, industrial manufacturing, and infrastructure development are key segments.
- M&A Trends: xx deals with a total value of approximately xx Million USD during 2019-2024.
India EPC Industry Market Trends & Opportunities
The Indian EPC industry is poised for significant growth, driven by robust infrastructure development initiatives, increasing energy demand, and a focus on renewable energy. The market size is projected to reach xx Million USD by 2033, registering a Compound Annual Growth Rate (CAGR) of xx% during the forecast period (2025-2033). This growth is fueled by several factors, including government investments in infrastructure projects, the rising adoption of renewable energy sources, and technological advancements in construction techniques. The market penetration rate of renewable energy EPC projects is expected to increase from xx% in 2024 to xx% by 2033. Technological advancements are streamlining project management, enhancing efficiency, and driving cost reductions. Consumer preferences are shifting toward sustainable and environmentally friendly EPC solutions. Competitive dynamics remain intense, with companies focusing on differentiation through technological innovation, strategic partnerships, and cost optimization.
Dominant Markets & Segments in India EPC Industry
The power generation segment, particularly non-hydro renewables, dominates the Indian EPC market. Within this segment, solar and wind power projects are experiencing the most rapid growth. The thermal power segment, while still significant, faces challenges due to environmental concerns and policy shifts. The hydro power segment experiences moderate growth, impacted by environmental concerns and project approval processes. Nuclear power projects are comparatively fewer in number but highly capital intensive.
- Key Growth Drivers for Non-Hydro Renewables:
- Government incentives and supportive policies, like the Production Linked Incentive (PLI) scheme.
- Declining costs of renewable energy technologies.
- Increasing awareness and demand for sustainable energy solutions.
- Abundant solar and wind resources.
- Market Dominance Analysis: Non-hydro renewables (primarily solar and wind) represent the fastest growing and most dominant segment within the Indian EPC market, contributing significantly to the overall market size growth and CAGR. This dominance is expected to continue through the forecast period, driven by strong policy support and the increasing cost-competitiveness of renewable energy technologies.
India EPC Industry Product Analysis
Product innovation within the Indian EPC industry focuses on enhancing efficiency, sustainability, and cost-effectiveness. Advanced technologies like Building Information Modeling (BIM), 3D printing, and prefabrication are being increasingly adopted. This improves project management, reduces construction time, and minimizes waste. The integration of smart technologies enhances operational efficiency and minimizes lifecycle costs. The competitive advantage stems from technological proficiency, project management expertise, and cost-effective solutions tailored to specific client needs.
Key Drivers, Barriers & Challenges in India EPC Industry
Key Drivers: Increased government spending on infrastructure, a rise in energy demand, the growth of renewable energy projects, and technological advancements are driving the market forward.
Challenges: Regulatory complexities, land acquisition issues, environmental clearances, and competition from international players pose significant challenges. Supply chain disruptions can lead to cost overruns and project delays. A quantifiable impact could be a xx% increase in project costs due to supply chain issues.
Growth Drivers in the India EPC Industry Market
Government initiatives promoting infrastructure development, rising energy demand, and the push towards renewable energy are significant growth drivers. Technological advancements such as BIM and prefabrication improve efficiency. Favorable regulatory policies supporting renewable energy adoption also significantly contribute to growth.
Challenges Impacting India EPC Industry Growth
Land acquisition complexities, environmental clearances, and bureaucratic hurdles create delays. Competition from global EPC players and fluctuating commodity prices impact profitability. Supply chain disruptions and skilled labor shortages further constrain growth.
Key Players Shaping the India EPC Industry Market
- Larsen & Toubro Limited
- Sterling and Wilson Solar Ltd
- Doosan Corporation
- Bharat Heavy Electricals Limited
- Alstom SA
- Reliance Infrastructure Ltd (Reliance Group)
- Tata Group
- MECON Limited
- BGR Energy Systems Ltd
- Sterlite Power Transmission Limited
Significant India EPC Industry Industry Milestones
- 2020: Launch of the Production Linked Incentive (PLI) scheme for renewable energy manufacturing, significantly boosting the sector.
- 2021: Several large-scale renewable energy projects awarded, signifying market expansion.
- 2022: Increased adoption of advanced technologies like BIM and prefabrication in major EPC projects.
- 2023: Merger of two major EPC companies announced, leading to a greater market share. (Further details would be needed to specify actual events).
Future Outlook for India EPC Industry Market
The Indian EPC industry is poised for sustained growth, driven by continued infrastructure development and renewable energy deployment. Opportunities exist in emerging technologies, digitalization, and sustainable construction practices. The market's potential is vast, with significant opportunities for both domestic and international players to capitalize on the country's infrastructure needs and commitment to renewable energy.
India EPC Industry Segmentation
-
1. Power Generation
- 1.1. Thermal
- 1.2. Hydro
- 1.3. Nuclear
- 1.4. Non-Hydro Renewables
- 2. Power Transmission and Distribution
India EPC Industry Segmentation By Geography
- 1. India
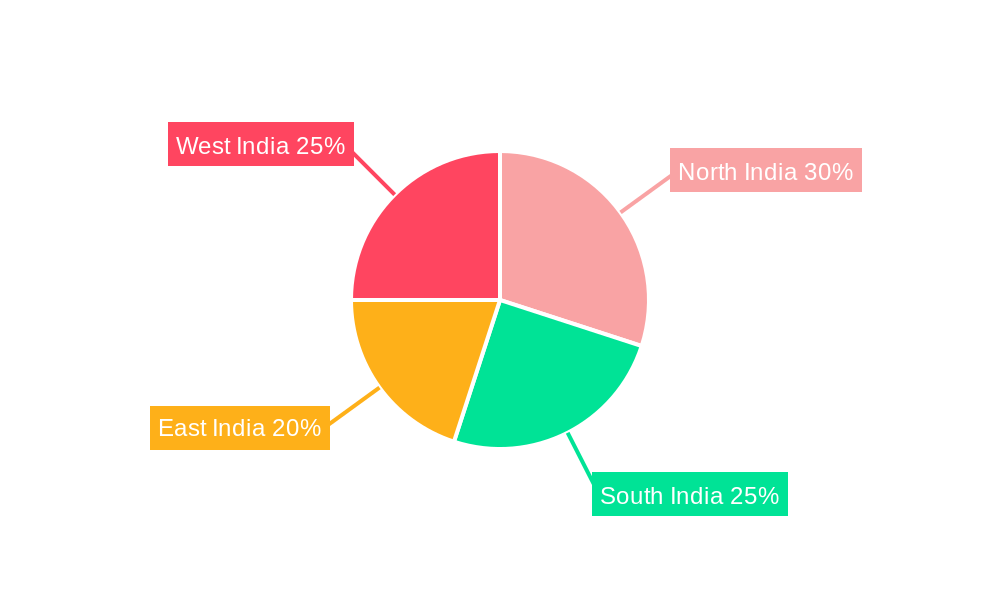
India EPC Industry Regional Market Share
Geographic Coverage of India EPC Industry
India EPC Industry REPORT HIGHLIGHTS
| Aspects | Details |
|---|---|
| Study Period | 2020-2034 |
| Base Year | 2025 |
| Estimated Year | 2026 |
| Forecast Period | 2026-2034 |
| Historical Period | 2020-2025 |
| Growth Rate | CAGR of 6.4% from 2020-2034 |
| Segmentation |
|
Table of Contents
- 1. Introduction
- 1.1. Research Scope
- 1.2. Market Segmentation
- 1.3. Research Methodology
- 1.4. Definitions and Assumptions
- 2. Executive Summary
- 2.1. Introduction
- 3. Market Dynamics
- 3.1. Introduction
- 3.2. Market Drivers
- 3.2.1. 4.; Increase in Prices of Electricity Procured from Conventional Mechanisms 4.; Decline in Cost of Solar Energy Infrastructure
- 3.3. Market Restrains
- 3.3.1. 4.; Competition from Other Alternative Energy Sources
- 3.4. Market Trends
- 3.4.1. Conventional Thermal Segment Expected to Dominate the Market
- 4. Market Factor Analysis
- 4.1. Porters Five Forces
- 4.2. Supply/Value Chain
- 4.3. PESTEL analysis
- 4.4. Market Entropy
- 4.5. Patent/Trademark Analysis
- 5. India EPC Industry Analysis, Insights and Forecast, 2020-2032
- 5.1. Market Analysis, Insights and Forecast - by Power Generation
- 5.1.1. Thermal
- 5.1.2. Hydro
- 5.1.3. Nuclear
- 5.1.4. Non-Hydro Renewables
- 5.2. Market Analysis, Insights and Forecast - by Power Transmission and Distribution
- 5.3. Market Analysis, Insights and Forecast - by Region
- 5.3.1. India
- 5.1. Market Analysis, Insights and Forecast - by Power Generation
- 6. Competitive Analysis
- 6.1. Market Share Analysis 2025
- 6.2. Company Profiles
- 6.2.1 Larsen & Toubro Limited
- 6.2.1.1. Overview
- 6.2.1.2. Products
- 6.2.1.3. SWOT Analysis
- 6.2.1.4. Recent Developments
- 6.2.1.5. Financials (Based on Availability)
- 6.2.2 Sterling and Wilson Solar Ltd
- 6.2.2.1. Overview
- 6.2.2.2. Products
- 6.2.2.3. SWOT Analysis
- 6.2.2.4. Recent Developments
- 6.2.2.5. Financials (Based on Availability)
- 6.2.3 Doosan Corporation
- 6.2.3.1. Overview
- 6.2.3.2. Products
- 6.2.3.3. SWOT Analysis
- 6.2.3.4. Recent Developments
- 6.2.3.5. Financials (Based on Availability)
- 6.2.4 Bharat Heavy Electricals Limited
- 6.2.4.1. Overview
- 6.2.4.2. Products
- 6.2.4.3. SWOT Analysis
- 6.2.4.4. Recent Developments
- 6.2.4.5. Financials (Based on Availability)
- 6.2.5 Alstom SA
- 6.2.5.1. Overview
- 6.2.5.2. Products
- 6.2.5.3. SWOT Analysis
- 6.2.5.4. Recent Developments
- 6.2.5.5. Financials (Based on Availability)
- 6.2.6 Reliance Infrastructure Ltd (Reliance Group)
- 6.2.6.1. Overview
- 6.2.6.2. Products
- 6.2.6.3. SWOT Analysis
- 6.2.6.4. Recent Developments
- 6.2.6.5. Financials (Based on Availability)
- 6.2.7 Tata Group
- 6.2.7.1. Overview
- 6.2.7.2. Products
- 6.2.7.3. SWOT Analysis
- 6.2.7.4. Recent Developments
- 6.2.7.5. Financials (Based on Availability)
- 6.2.8 MECON Limited*List Not Exhaustive
- 6.2.8.1. Overview
- 6.2.8.2. Products
- 6.2.8.3. SWOT Analysis
- 6.2.8.4. Recent Developments
- 6.2.8.5. Financials (Based on Availability)
- 6.2.9 BGR Energy Systems Ltd
- 6.2.9.1. Overview
- 6.2.9.2. Products
- 6.2.9.3. SWOT Analysis
- 6.2.9.4. Recent Developments
- 6.2.9.5. Financials (Based on Availability)
- 6.2.10 Sterlite Power Transmission Limited
- 6.2.10.1. Overview
- 6.2.10.2. Products
- 6.2.10.3. SWOT Analysis
- 6.2.10.4. Recent Developments
- 6.2.10.5. Financials (Based on Availability)
- 6.2.1 Larsen & Toubro Limited
List of Figures
- Figure 1: India EPC Industry Revenue Breakdown (billion, %) by Product 2025 & 2033
- Figure 2: India EPC Industry Share (%) by Company 2025
List of Tables
- Table 1: India EPC Industry Revenue billion Forecast, by Power Generation 2020 & 2033
- Table 2: India EPC Industry Revenue billion Forecast, by Power Transmission and Distribution 2020 & 2033
- Table 3: India EPC Industry Revenue billion Forecast, by Region 2020 & 2033
- Table 4: India EPC Industry Revenue billion Forecast, by Power Generation 2020 & 2033
- Table 5: India EPC Industry Revenue billion Forecast, by Power Transmission and Distribution 2020 & 2033
- Table 6: India EPC Industry Revenue billion Forecast, by Country 2020 & 2033
Frequently Asked Questions
1. What is the projected Compound Annual Growth Rate (CAGR) of the India EPC Industry?
The projected CAGR is approximately 6.4%.
2. Which companies are prominent players in the India EPC Industry?
Key companies in the market include Larsen & Toubro Limited, Sterling and Wilson Solar Ltd, Doosan Corporation, Bharat Heavy Electricals Limited, Alstom SA, Reliance Infrastructure Ltd (Reliance Group), Tata Group, MECON Limited*List Not Exhaustive, BGR Energy Systems Ltd, Sterlite Power Transmission Limited.
3. What are the main segments of the India EPC Industry?
The market segments include Power Generation , Power Transmission and Distribution.
4. Can you provide details about the market size?
The market size is estimated to be USD 39.1 billion as of 2022.
5. What are some drivers contributing to market growth?
4.; Increase in Prices of Electricity Procured from Conventional Mechanisms 4.; Decline in Cost of Solar Energy Infrastructure.
6. What are the notable trends driving market growth?
Conventional Thermal Segment Expected to Dominate the Market.
7. Are there any restraints impacting market growth?
4.; Competition from Other Alternative Energy Sources.
8. Can you provide examples of recent developments in the market?
N/A
9. What pricing options are available for accessing the report?
Pricing options include single-user, multi-user, and enterprise licenses priced at USD 3800, USD 4500, and USD 5800 respectively.
10. Is the market size provided in terms of value or volume?
The market size is provided in terms of value, measured in billion.
11. Are there any specific market keywords associated with the report?
Yes, the market keyword associated with the report is "India EPC Industry," which aids in identifying and referencing the specific market segment covered.
12. How do I determine which pricing option suits my needs best?
The pricing options vary based on user requirements and access needs. Individual users may opt for single-user licenses, while businesses requiring broader access may choose multi-user or enterprise licenses for cost-effective access to the report.
13. Are there any additional resources or data provided in the India EPC Industry report?
While the report offers comprehensive insights, it's advisable to review the specific contents or supplementary materials provided to ascertain if additional resources or data are available.
14. How can I stay updated on further developments or reports in the India EPC Industry?
To stay informed about further developments, trends, and reports in the India EPC Industry, consider subscribing to industry newsletters, following relevant companies and organizations, or regularly checking reputable industry news sources and publications.
Methodology
Step 1 - Identification of Relevant Samples Size from Population Database


Step 2 - Approaches for Defining Global Market Size (Value, Volume* & Price*)

Note*: In applicable scenarios
Step 3 - Data Sources
Primary Research
- Web Analytics
- Survey Reports
- Research Institute
- Latest Research Reports
- Opinion Leaders
Secondary Research
- Annual Reports
- White Paper
- Latest Press Release
- Industry Association
- Paid Database
- Investor Presentations

Step 4 - Data Triangulation
Involves using different sources of information in order to increase the validity of a study
These sources are likely to be stakeholders in a program - participants, other researchers, program staff, other community members, and so on.
Then we put all data in single framework & apply various statistical tools to find out the dynamic on the market.
During the analysis stage, feedback from the stakeholder groups would be compared to determine areas of agreement as well as areas of divergence