

Key Insights
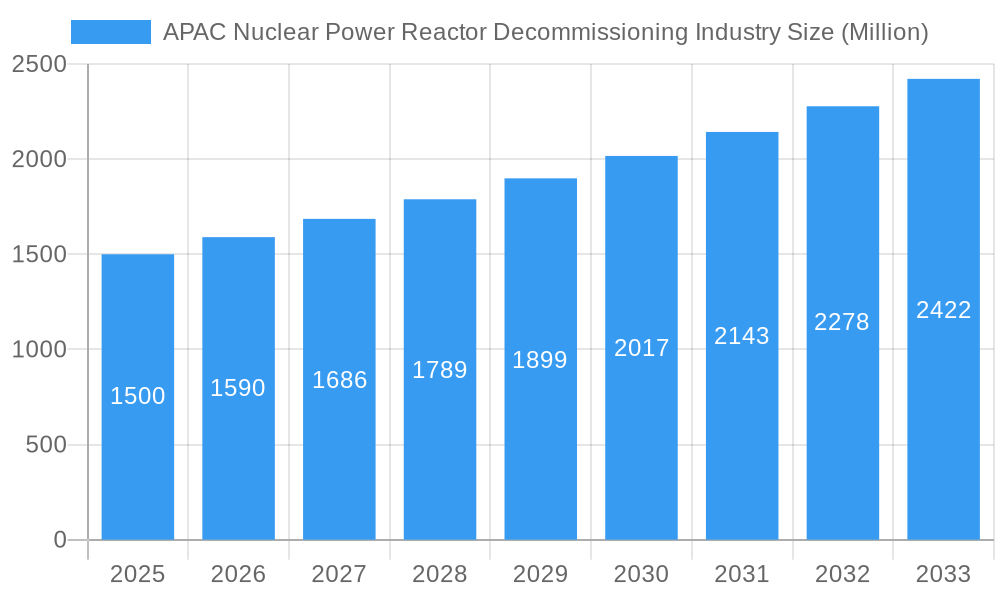
The Asia-Pacific (APAC) nuclear power reactor decommissioning market is experiencing robust growth, driven by aging infrastructure and stringent regulatory mandates for safe and efficient shutdown. This market is projected to reach a size of 8.01 billion by 2033, with a Compound Annual Growth Rate (CAGR) of 3.59%. Key growth factors include the increasing number of reactors reaching end-of-life, particularly in Japan and South Korea, alongside heightened environmental awareness and regulatory pressures. Challenges such as high costs and technical complexities are being addressed through technological advancements and the rise of specialized service providers. The market is segmented by reactor type, application, and capacity, enabling targeted strategies. Japan and South Korea lead the market due to their established decommissioning programs and high concentration of aging reactors. China's expanding nuclear sector presents a future growth opportunity. Investment is expected to increase in robotics, advanced waste management, and decontamination techniques, fostering opportunities for established and emerging players.
APAC Nuclear Power Reactor Decommissioning Industry Market Size (In Billion)
Government initiatives promoting nuclear safety and waste management are crucial drivers for the APAC nuclear power reactor decommissioning market. Enhanced collaboration among governments, utilities, and private entities is accelerating decommissioning processes and encouraging technology adoption. The competitive landscape features both international and regional specialists. While economic volatility and regulatory delays pose potential risks, the long-term outlook remains positive, fueled by the inevitable aging of nuclear fleets and a growing emphasis on environmental stewardship. The market is transitioning towards sustainable and efficient methods, integrating digital technologies and optimized waste management for reduced environmental impact and cost-effectiveness.
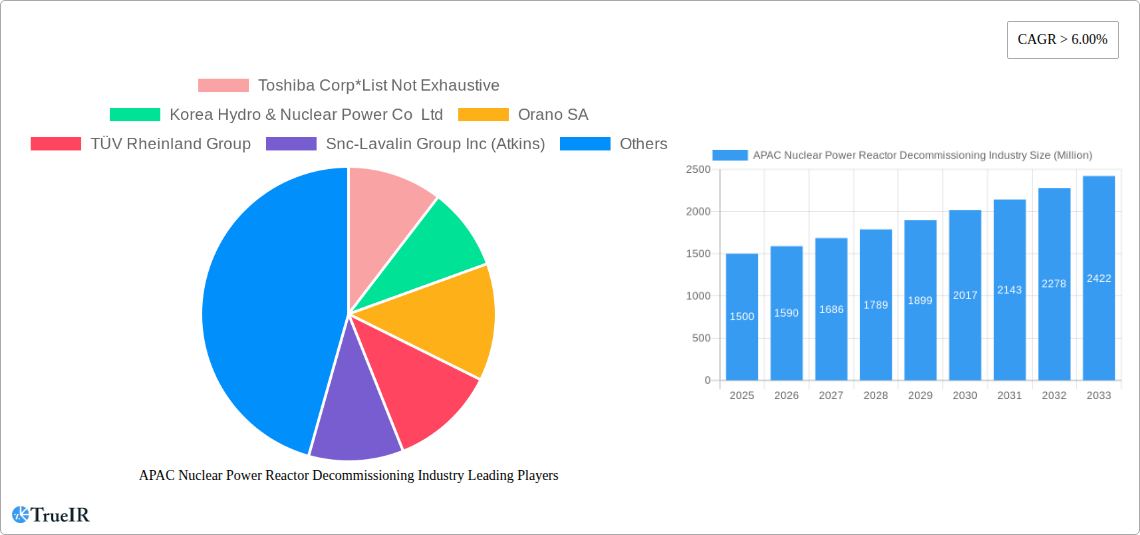
APAC Nuclear Power Reactor Decommissioning Industry Company Market Share
This comprehensive report analyzes the Asia-Pacific (APAC) nuclear power reactor decommissioning industry, offering critical insights for stakeholders and professionals. Utilizing data from 2019 to 2033 (base year: 2025, forecast period: 2025-2033), the report details market trends, competitive dynamics, and future growth. Key players like Toshiba Corp, Korea Hydro & Nuclear Power Co Ltd, and Orano SA are featured. Segmentation includes reactor type, application, and capacity (below 100 MW, 100-1000 MW, above 1000 MW), with regional analysis for Japan, China, and the Rest of APAC. Significant industry events, such as the Fukushima Daiichi decommissioning, are also covered.
APAC Nuclear Power Reactor Decommissioning Industry Market Structure & Competitive Landscape
The APAC nuclear power reactor decommissioning market exhibits a moderately concentrated structure. While a few large multinational players dominate, several regional specialists and smaller firms contribute significantly to the overall market share. The Herfindahl-Hirschman Index (HHI) for 2024 is estimated at xx, indicating a moderately competitive environment. However, the market is experiencing increasing consolidation through mergers and acquisitions (M&A). The total M&A volume in the sector from 2019 to 2024 reached approximately xx Million USD.
- Innovation Drivers: Advancements in robotics, AI-powered decommissioning technologies, and waste management solutions are driving innovation and efficiency.
- Regulatory Impacts: Stringent safety regulations and environmental protection policies significantly influence market dynamics and investment decisions. Variations in regulatory frameworks across APAC nations create distinct market opportunities and challenges.
- Product Substitutes: While there are no direct substitutes for specialized decommissioning services, alternative approaches to waste management are influencing the overall industry landscape.
- End-User Segmentation: The major end-users include government agencies, nuclear power plant operators, and specialized decommissioning contractors.
- M&A Trends: The ongoing consolidation is driven by economies of scale, access to advanced technologies, and the need to manage the complexities of large-scale decommissioning projects.
APAC Nuclear Power Reactor Decommissioning Industry Market Trends & Opportunities
The APAC nuclear power reactor decommissioning market is projected to witness substantial growth, driven by the aging nuclear infrastructure and increasing government initiatives to address nuclear waste. The market size in 2024 is estimated at xx Million USD, and it is forecasted to reach xx Million USD by 2033, exhibiting a Compound Annual Growth Rate (CAGR) of xx% during the forecast period.
This growth is fueled by several key trends:
- Technological advancements: The increasing adoption of advanced robotics, remote-operated vehicles (ROVs), and AI-powered systems is enhancing efficiency and reducing operational risks in decommissioning projects.
- Government regulations and policies: Stringent safety and environmental regulations are driving the demand for specialized decommissioning services and technologies. Many governments are introducing financial incentives for safe and efficient decommissioning, further boosting market growth.
- Aging nuclear power plants: A significant number of nuclear power plants in the APAC region are nearing the end of their operational lifespan, leading to a surge in decommissioning projects.
- Market consolidation: Strategic mergers and acquisitions are shaping the market landscape, leading to the emergence of larger, more integrated players capable of handling large-scale decommissioning projects.
- Rise in environmental awareness: Growing public and regulatory focus on environmental protection and the safe handling of radioactive waste is further pushing the market forward.
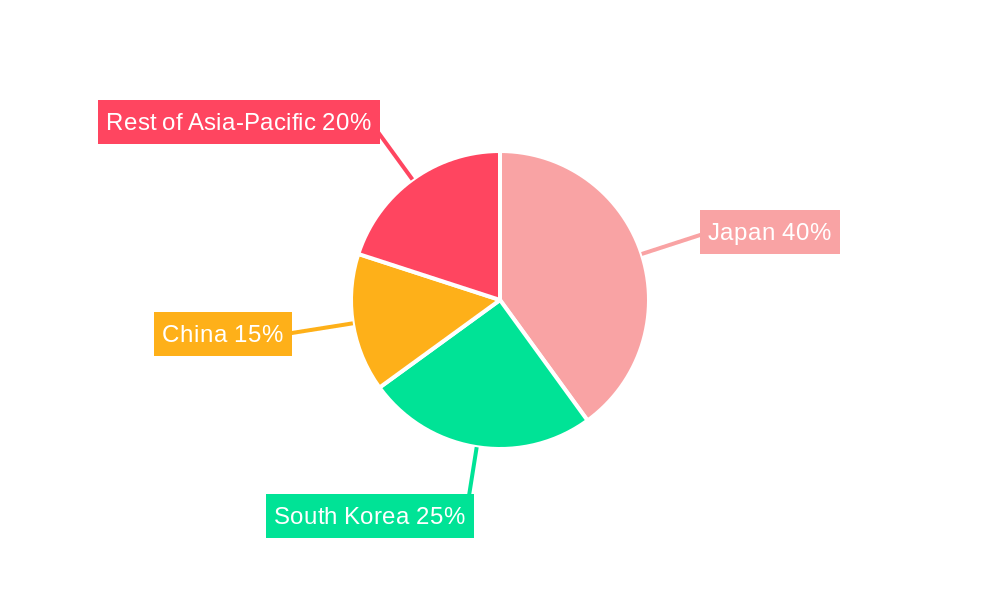
Dominant Markets & Segments in APAC Nuclear Power Reactor Decommissioning Industry
Japan currently holds the dominant position in the APAC nuclear power reactor decommissioning market, primarily due to the Fukushima Daiichi accident and the subsequent need for extensive decommissioning efforts. China is also experiencing significant growth, driven by the increasing number of aging nuclear power plants. The Rest of Asia-Pacific region is expected to show moderate growth, driven by individual national decommissioning plans and projects.
Key Growth Drivers:
- Japan: Government funding for Fukushima decommissioning and aging reactor retirement. Stringent regulatory oversight pushing for advanced technologies.
- China: Increasing number of aging reactors requiring decommissioning and a growing domestic industry. Government support for nuclear waste management.
- Rest of Asia-Pacific: Gradual increase in decommissioning activities, driven by national policies and aging reactor fleets.
Market Dominance Analysis:
Japan's dominance stems from the scale of the Fukushima Daiichi decommissioning project, which represents a significant portion of the regional market. The extensive work required to remediate the site, coupled with ongoing research and development efforts in decommissioning technologies, significantly drives the growth and influence of Japanese companies in this sector. China's rapidly expanding nuclear power industry ensures a significant pipeline of future decommissioning projects, leading to the prediction of China becoming a leading market in coming years.
APAC Nuclear Power Reactor Decommissioning Industry Product Analysis
The APAC nuclear power reactor decommissioning market features a wide range of products and services, including specialized robots, remote-handling systems, shielding equipment, waste characterization and treatment technologies, and decommissioning consulting services. Technological advancements, including the use of advanced robotics and AI-powered systems, are enhancing the efficiency and safety of decommissioning operations, while also addressing the challenges associated with handling highly radioactive materials. This technological innovation is crucial for attracting investors and driving market growth.
Key Drivers, Barriers & Challenges in APAC Nuclear Power Reactor Decommissioning Industry
Key Drivers:
- Aging nuclear power plant fleet necessitates decommissioning.
- Stringent regulatory frameworks and increased environmental awareness are increasing the demand for safe and efficient decommissioning.
- Technological advancements are improving the efficiency and cost-effectiveness of decommissioning processes.
- Government funding and incentives are supporting decommissioning projects in key regions like Japan.
Key Challenges:
- High decommissioning costs pose a significant financial burden for plant operators and governments. The overall cost of decommissioning a nuclear power plant is estimated to be between xx Million USD and xx Million USD, depending on the size and complexity of the project.
- The long duration of decommissioning projects, often spanning several decades, poses logistical and management challenges.
- The management and disposal of radioactive waste continue to present significant technical and regulatory hurdles. The long-term storage or disposal of radioactive waste represents a significant technical and environmental challenge that needs careful consideration. Finding suitable storage and disposal solutions is a crucial aspect of the decommissioning process.
Growth Drivers in the APAC Nuclear Power Reactor Decommissioning Industry Market
The APAC nuclear decommissioning market is primarily driven by the increasing number of aging reactors reaching the end of their operational life, coupled with stringent government regulations and the rising awareness of environmental concerns. Furthermore, technological advancements in robotics, AI, and waste management are enabling safer, more efficient, and cost-effective decommissioning processes. Government initiatives and funding in key markets like Japan further propel market growth.
Challenges Impacting APAC Nuclear Power Reactor Decommissioning Industry Growth
Challenges facing the APAC nuclear decommissioning industry include the substantial capital investment required for projects, the long timelines associated with decommissioning, and managing radioactive waste disposal. Regulatory hurdles and varying policy frameworks across different APAC nations also create complexities. Competition for skilled labor and specialized technologies adds further challenges, particularly in fast-growing markets.
Key Players Shaping the APAC Nuclear Power Reactor Decommissioning Industry Market
- Toshiba Corp
- Korea Hydro & Nuclear Power Co Ltd
- Orano SA
- TÜV Rheinland Group
- Snc-Lavalin Group Inc (Atkins)
- The Japan Atomic Power Co
- GE- Hitachi Nuclear Energy Ltd
- Tokyo Electric Power Company Holdings Inc
Significant APAC Nuclear Power Reactor Decommissioning Industry Industry Milestones
January 2022: The Japanese government announced plans to release 1.25 Million tonnes of treated wastewater from the Fukushima Daiichi nuclear power plant into the Pacific Ocean, a key milestone in the plant's decommissioning process. This decision, while controversial, significantly impacts the market by creating a large volume of work related to monitoring and managing the release and its long-term environmental effects.
May 2022: Jacobs Engineering Group was selected by Tokyo Electric Power Company (TEPCO) to support decommissioning efforts at the Fukushima Daiichi plant. This signifies a significant collaboration between international and Japanese companies, highlighting the complexity and scale of the undertaking and the need for specialized expertise.
Future Outlook for APAC Nuclear Power Reactor Decommissioning Industry Market
The APAC nuclear power reactor decommissioning market is poised for significant growth, driven by the increasing number of aging reactors and the rising demand for safe and efficient decommissioning services. Technological advancements, government regulations, and environmental concerns will continue to shape the market landscape. Strategic partnerships and investments in innovative technologies are expected to drive further expansion and innovation within the industry. The market offers considerable potential for companies with expertise in robotics, AI, waste management, and project management. A focus on efficient waste management solutions and innovative technologies will be crucial for future success in this growing market.
APAC Nuclear Power Reactor Decommissioning Industry Segmentation
-
1. Reactor Type
- 1.1. Pressurized Water Reactor
- 1.2. Pressurized Heavy Water Reactor
- 1.3. Boiling Water Reactor
- 1.4. High-temperature Gas-cooled Reactor
- 1.5. Liquid Metal Fast Breeder Reactor
- 1.6. Other Reactor Types
-
2. Application
- 2.1. Commercial Power Reactor
- 2.2. Prototype Power Reactor
- 2.3. Research Reactor
-
3. Capacity
- 3.1. Below 100 MW
- 3.2. 100-1000 MW
- 3.3. Above 1000 MW
APAC Nuclear Power Reactor Decommissioning Industry Segmentation By Geography
-
1. North America
- 1.1. United States
- 1.2. Canada
- 1.3. Mexico
-
2. South America
- 2.1. Brazil
- 2.2. Argentina
- 2.3. Rest of South America
-
3. Europe
- 3.1. United Kingdom
- 3.2. Germany
- 3.3. France
- 3.4. Italy
- 3.5. Spain
- 3.6. Russia
- 3.7. Benelux
- 3.8. Nordics
- 3.9. Rest of Europe
-
4. Middle East & Africa
- 4.1. Turkey
- 4.2. Israel
- 4.3. GCC
- 4.4. North Africa
- 4.5. South Africa
- 4.6. Rest of Middle East & Africa
-
5. Asia Pacific
- 5.1. China
- 5.2. India
- 5.3. Japan
- 5.4. South Korea
- 5.5. ASEAN
- 5.6. Oceania
- 5.7. Rest of Asia Pacific
APAC Nuclear Power Reactor Decommissioning Industry Regional Market Share
Geographic Coverage of APAC Nuclear Power Reactor Decommissioning Industry
APAC Nuclear Power Reactor Decommissioning Industry REPORT HIGHLIGHTS
| Aspects | Details |
|---|---|
| Study Period | 2020-2034 |
| Base Year | 2025 |
| Estimated Year | 2026 |
| Forecast Period | 2026-2034 |
| Historical Period | 2020-2025 |
| Growth Rate | CAGR of 3.59% from 2020-2034 |
| Segmentation |
|
Table of Contents
- 1. Introduction
- 1.1. Research Scope
- 1.2. Market Segmentation
- 1.3. Research Objective
- 1.4. Definitions and Assumptions
- 2. Executive Summary
- 2.1. Market Snapshot
- 3. Market Dynamics
- 3.1. Market Drivers
- 3.2. Market Restrains
- 3.3. Market Trends
- 3.4. Market Opportunities
- 4. Market Factor Analysis
- 4.1. Porters Five Forces
- 4.1.1. Bargaining Power of Suppliers
- 4.1.2. Bargaining Power of Buyers
- 4.1.3. Threat of New Entrants
- 4.1.4. Threat of Substitutes
- 4.1.5. Competitive Rivalry
- 4.2. PESTEL analysis
- 4.3. BCG Analysis
- 4.3.1. Stars (High Growth, High Market Share)
- 4.3.2. Cash Cows (Low Growth, High Market Share)
- 4.3.3. Question Mark (High Growth, Low Market Share)
- 4.3.4. Dogs (Low Growth, Low Market Share)
- 4.4. Ansoff Matrix Analysis
- 4.5. Supply Chain Analysis
- 4.6. Regulatory Landscape
- 4.7. Current Market Potential and Opportunity Assessment (TAM–SAM–SOM Framework)
- 4.8. TIR Analyst Note
- 4.1. Porters Five Forces
- 5. Market Analysis, Insights and Forecast 2021-2033
- 5.1. Market Analysis, Insights and Forecast - by Reactor Type
- 5.1.1. Pressurized Water Reactor
- 5.1.2. Pressurized Heavy Water Reactor
- 5.1.3. Boiling Water Reactor
- 5.1.4. High-temperature Gas-cooled Reactor
- 5.1.5. Liquid Metal Fast Breeder Reactor
- 5.1.6. Other Reactor Types
- 5.2. Market Analysis, Insights and Forecast - by Application
- 5.2.1. Commercial Power Reactor
- 5.2.2. Prototype Power Reactor
- 5.2.3. Research Reactor
- 5.3. Market Analysis, Insights and Forecast - by Capacity
- 5.3.1. Below 100 MW
- 5.3.2. 100-1000 MW
- 5.3.3. Above 1000 MW
- 5.4. Market Analysis, Insights and Forecast - by Region
- 5.4.1. North America
- 5.4.2. South America
- 5.4.3. Europe
- 5.4.4. Middle East & Africa
- 5.4.5. Asia Pacific
- 5.1. Market Analysis, Insights and Forecast - by Reactor Type
- 6. Global APAC Nuclear Power Reactor Decommissioning Industry Analysis, Insights and Forecast, 2021-2033
- 6.1. Market Analysis, Insights and Forecast - by Reactor Type
- 6.1.1. Pressurized Water Reactor
- 6.1.2. Pressurized Heavy Water Reactor
- 6.1.3. Boiling Water Reactor
- 6.1.4. High-temperature Gas-cooled Reactor
- 6.1.5. Liquid Metal Fast Breeder Reactor
- 6.1.6. Other Reactor Types
- 6.2. Market Analysis, Insights and Forecast - by Application
- 6.2.1. Commercial Power Reactor
- 6.2.2. Prototype Power Reactor
- 6.2.3. Research Reactor
- 6.3. Market Analysis, Insights and Forecast - by Capacity
- 6.3.1. Below 100 MW
- 6.3.2. 100-1000 MW
- 6.3.3. Above 1000 MW
- 6.1. Market Analysis, Insights and Forecast - by Reactor Type
- 7. North America APAC Nuclear Power Reactor Decommissioning Industry Analysis, Insights and Forecast, 2020-2032
- 7.1. Market Analysis, Insights and Forecast - by Reactor Type
- 7.1.1. Pressurized Water Reactor
- 7.1.2. Pressurized Heavy Water Reactor
- 7.1.3. Boiling Water Reactor
- 7.1.4. High-temperature Gas-cooled Reactor
- 7.1.5. Liquid Metal Fast Breeder Reactor
- 7.1.6. Other Reactor Types
- 7.2. Market Analysis, Insights and Forecast - by Application
- 7.2.1. Commercial Power Reactor
- 7.2.2. Prototype Power Reactor
- 7.2.3. Research Reactor
- 7.3. Market Analysis, Insights and Forecast - by Capacity
- 7.3.1. Below 100 MW
- 7.3.2. 100-1000 MW
- 7.3.3. Above 1000 MW
- 7.1. Market Analysis, Insights and Forecast - by Reactor Type
- 8. South America APAC Nuclear Power Reactor Decommissioning Industry Analysis, Insights and Forecast, 2020-2032
- 8.1. Market Analysis, Insights and Forecast - by Reactor Type
- 8.1.1. Pressurized Water Reactor
- 8.1.2. Pressurized Heavy Water Reactor
- 8.1.3. Boiling Water Reactor
- 8.1.4. High-temperature Gas-cooled Reactor
- 8.1.5. Liquid Metal Fast Breeder Reactor
- 8.1.6. Other Reactor Types
- 8.2. Market Analysis, Insights and Forecast - by Application
- 8.2.1. Commercial Power Reactor
- 8.2.2. Prototype Power Reactor
- 8.2.3. Research Reactor
- 8.3. Market Analysis, Insights and Forecast - by Capacity
- 8.3.1. Below 100 MW
- 8.3.2. 100-1000 MW
- 8.3.3. Above 1000 MW
- 8.1. Market Analysis, Insights and Forecast - by Reactor Type
- 9. Europe APAC Nuclear Power Reactor Decommissioning Industry Analysis, Insights and Forecast, 2020-2032
- 9.1. Market Analysis, Insights and Forecast - by Reactor Type
- 9.1.1. Pressurized Water Reactor
- 9.1.2. Pressurized Heavy Water Reactor
- 9.1.3. Boiling Water Reactor
- 9.1.4. High-temperature Gas-cooled Reactor
- 9.1.5. Liquid Metal Fast Breeder Reactor
- 9.1.6. Other Reactor Types
- 9.2. Market Analysis, Insights and Forecast - by Application
- 9.2.1. Commercial Power Reactor
- 9.2.2. Prototype Power Reactor
- 9.2.3. Research Reactor
- 9.3. Market Analysis, Insights and Forecast - by Capacity
- 9.3.1. Below 100 MW
- 9.3.2. 100-1000 MW
- 9.3.3. Above 1000 MW
- 9.1. Market Analysis, Insights and Forecast - by Reactor Type
- 10. Middle East & Africa APAC Nuclear Power Reactor Decommissioning Industry Analysis, Insights and Forecast, 2020-2032
- 10.1. Market Analysis, Insights and Forecast - by Reactor Type
- 10.1.1. Pressurized Water Reactor
- 10.1.2. Pressurized Heavy Water Reactor
- 10.1.3. Boiling Water Reactor
- 10.1.4. High-temperature Gas-cooled Reactor
- 10.1.5. Liquid Metal Fast Breeder Reactor
- 10.1.6. Other Reactor Types
- 10.2. Market Analysis, Insights and Forecast - by Application
- 10.2.1. Commercial Power Reactor
- 10.2.2. Prototype Power Reactor
- 10.2.3. Research Reactor
- 10.3. Market Analysis, Insights and Forecast - by Capacity
- 10.3.1. Below 100 MW
- 10.3.2. 100-1000 MW
- 10.3.3. Above 1000 MW
- 10.1. Market Analysis, Insights and Forecast - by Reactor Type
- 11. Asia Pacific APAC Nuclear Power Reactor Decommissioning Industry Analysis, Insights and Forecast, 2020-2032
- 11.1. Market Analysis, Insights and Forecast - by Reactor Type
- 11.1.1. Pressurized Water Reactor
- 11.1.2. Pressurized Heavy Water Reactor
- 11.1.3. Boiling Water Reactor
- 11.1.4. High-temperature Gas-cooled Reactor
- 11.1.5. Liquid Metal Fast Breeder Reactor
- 11.1.6. Other Reactor Types
- 11.2. Market Analysis, Insights and Forecast - by Application
- 11.2.1. Commercial Power Reactor
- 11.2.2. Prototype Power Reactor
- 11.2.3. Research Reactor
- 11.3. Market Analysis, Insights and Forecast - by Capacity
- 11.3.1. Below 100 MW
- 11.3.2. 100-1000 MW
- 11.3.3. Above 1000 MW
- 11.1. Market Analysis, Insights and Forecast - by Reactor Type
- 12. Competitive Analysis
- 12.1. Company Profiles
- 12.1.1 Toshiba Corp*List Not Exhaustive
- 12.1.1.1. Company Overview
- 12.1.1.2. Products
- 12.1.1.3. Company Financials
- 12.1.1.4. SWOT Analysis
- 12.1.2 Korea Hydro & Nuclear Power Co Ltd
- 12.1.2.1. Company Overview
- 12.1.2.2. Products
- 12.1.2.3. Company Financials
- 12.1.2.4. SWOT Analysis
- 12.1.3 Orano SA
- 12.1.3.1. Company Overview
- 12.1.3.2. Products
- 12.1.3.3. Company Financials
- 12.1.3.4. SWOT Analysis
- 12.1.4 TÜV Rheinland Group
- 12.1.4.1. Company Overview
- 12.1.4.2. Products
- 12.1.4.3. Company Financials
- 12.1.4.4. SWOT Analysis
- 12.1.5 Snc-Lavalin Group Inc (Atkins)
- 12.1.5.1. Company Overview
- 12.1.5.2. Products
- 12.1.5.3. Company Financials
- 12.1.5.4. SWOT Analysis
- 12.1.6 The Japan Atomic Power Co
- 12.1.6.1. Company Overview
- 12.1.6.2. Products
- 12.1.6.3. Company Financials
- 12.1.6.4. SWOT Analysis
- 12.1.7 GE- Hitachi Nuclear Energy Ltd
- 12.1.7.1. Company Overview
- 12.1.7.2. Products
- 12.1.7.3. Company Financials
- 12.1.7.4. SWOT Analysis
- 12.1.8 Tokyo Electric Power Company Holdings Inc
- 12.1.8.1. Company Overview
- 12.1.8.2. Products
- 12.1.8.3. Company Financials
- 12.1.8.4. SWOT Analysis
- 12.1.1 Toshiba Corp*List Not Exhaustive
- 12.2. Market Entropy
- 12.2.1 Company's Key Areas Served
- 12.2.2 Recent Developments
- 12.3. Company Market Share Analysis 2025
- 12.3.1 Top 5 Companies Market Share Analysis
- 12.3.2 Top 3 Companies Market Share Analysis
- 12.4. List of Potential Customers
- 13. Research Methodology
List of Figures
- Figure 1: Global APAC Nuclear Power Reactor Decommissioning Industry Revenue Breakdown (billion, %) by Region 2025 & 2033
- Figure 2: North America APAC Nuclear Power Reactor Decommissioning Industry Revenue (billion), by Reactor Type 2025 & 2033
- Figure 3: North America APAC Nuclear Power Reactor Decommissioning Industry Revenue Share (%), by Reactor Type 2025 & 2033
- Figure 4: North America APAC Nuclear Power Reactor Decommissioning Industry Revenue (billion), by Application 2025 & 2033
- Figure 5: North America APAC Nuclear Power Reactor Decommissioning Industry Revenue Share (%), by Application 2025 & 2033
- Figure 6: North America APAC Nuclear Power Reactor Decommissioning Industry Revenue (billion), by Capacity 2025 & 2033
- Figure 7: North America APAC Nuclear Power Reactor Decommissioning Industry Revenue Share (%), by Capacity 2025 & 2033
- Figure 8: North America APAC Nuclear Power Reactor Decommissioning Industry Revenue (billion), by Country 2025 & 2033
- Figure 9: North America APAC Nuclear Power Reactor Decommissioning Industry Revenue Share (%), by Country 2025 & 2033
- Figure 10: South America APAC Nuclear Power Reactor Decommissioning Industry Revenue (billion), by Reactor Type 2025 & 2033
- Figure 11: South America APAC Nuclear Power Reactor Decommissioning Industry Revenue Share (%), by Reactor Type 2025 & 2033
- Figure 12: South America APAC Nuclear Power Reactor Decommissioning Industry Revenue (billion), by Application 2025 & 2033
- Figure 13: South America APAC Nuclear Power Reactor Decommissioning Industry Revenue Share (%), by Application 2025 & 2033
- Figure 14: South America APAC Nuclear Power Reactor Decommissioning Industry Revenue (billion), by Capacity 2025 & 2033
- Figure 15: South America APAC Nuclear Power Reactor Decommissioning Industry Revenue Share (%), by Capacity 2025 & 2033
- Figure 16: South America APAC Nuclear Power Reactor Decommissioning Industry Revenue (billion), by Country 2025 & 2033
- Figure 17: South America APAC Nuclear Power Reactor Decommissioning Industry Revenue Share (%), by Country 2025 & 2033
- Figure 18: Europe APAC Nuclear Power Reactor Decommissioning Industry Revenue (billion), by Reactor Type 2025 & 2033
- Figure 19: Europe APAC Nuclear Power Reactor Decommissioning Industry Revenue Share (%), by Reactor Type 2025 & 2033
- Figure 20: Europe APAC Nuclear Power Reactor Decommissioning Industry Revenue (billion), by Application 2025 & 2033
- Figure 21: Europe APAC Nuclear Power Reactor Decommissioning Industry Revenue Share (%), by Application 2025 & 2033
- Figure 22: Europe APAC Nuclear Power Reactor Decommissioning Industry Revenue (billion), by Capacity 2025 & 2033
- Figure 23: Europe APAC Nuclear Power Reactor Decommissioning Industry Revenue Share (%), by Capacity 2025 & 2033
- Figure 24: Europe APAC Nuclear Power Reactor Decommissioning Industry Revenue (billion), by Country 2025 & 2033
- Figure 25: Europe APAC Nuclear Power Reactor Decommissioning Industry Revenue Share (%), by Country 2025 & 2033
- Figure 26: Middle East & Africa APAC Nuclear Power Reactor Decommissioning Industry Revenue (billion), by Reactor Type 2025 & 2033
- Figure 27: Middle East & Africa APAC Nuclear Power Reactor Decommissioning Industry Revenue Share (%), by Reactor Type 2025 & 2033
- Figure 28: Middle East & Africa APAC Nuclear Power Reactor Decommissioning Industry Revenue (billion), by Application 2025 & 2033
- Figure 29: Middle East & Africa APAC Nuclear Power Reactor Decommissioning Industry Revenue Share (%), by Application 2025 & 2033
- Figure 30: Middle East & Africa APAC Nuclear Power Reactor Decommissioning Industry Revenue (billion), by Capacity 2025 & 2033
- Figure 31: Middle East & Africa APAC Nuclear Power Reactor Decommissioning Industry Revenue Share (%), by Capacity 2025 & 2033
- Figure 32: Middle East & Africa APAC Nuclear Power Reactor Decommissioning Industry Revenue (billion), by Country 2025 & 2033
- Figure 33: Middle East & Africa APAC Nuclear Power Reactor Decommissioning Industry Revenue Share (%), by Country 2025 & 2033
- Figure 34: Asia Pacific APAC Nuclear Power Reactor Decommissioning Industry Revenue (billion), by Reactor Type 2025 & 2033
- Figure 35: Asia Pacific APAC Nuclear Power Reactor Decommissioning Industry Revenue Share (%), by Reactor Type 2025 & 2033
- Figure 36: Asia Pacific APAC Nuclear Power Reactor Decommissioning Industry Revenue (billion), by Application 2025 & 2033
- Figure 37: Asia Pacific APAC Nuclear Power Reactor Decommissioning Industry Revenue Share (%), by Application 2025 & 2033
- Figure 38: Asia Pacific APAC Nuclear Power Reactor Decommissioning Industry Revenue (billion), by Capacity 2025 & 2033
- Figure 39: Asia Pacific APAC Nuclear Power Reactor Decommissioning Industry Revenue Share (%), by Capacity 2025 & 2033
- Figure 40: Asia Pacific APAC Nuclear Power Reactor Decommissioning Industry Revenue (billion), by Country 2025 & 2033
- Figure 41: Asia Pacific APAC Nuclear Power Reactor Decommissioning Industry Revenue Share (%), by Country 2025 & 2033
List of Tables
- Table 1: Global APAC Nuclear Power Reactor Decommissioning Industry Revenue billion Forecast, by Reactor Type 2020 & 2033
- Table 2: Global APAC Nuclear Power Reactor Decommissioning Industry Revenue billion Forecast, by Application 2020 & 2033
- Table 3: Global APAC Nuclear Power Reactor Decommissioning Industry Revenue billion Forecast, by Capacity 2020 & 2033
- Table 4: Global APAC Nuclear Power Reactor Decommissioning Industry Revenue billion Forecast, by Region 2020 & 2033
- Table 5: Global APAC Nuclear Power Reactor Decommissioning Industry Revenue billion Forecast, by Reactor Type 2020 & 2033
- Table 6: Global APAC Nuclear Power Reactor Decommissioning Industry Revenue billion Forecast, by Application 2020 & 2033
- Table 7: Global APAC Nuclear Power Reactor Decommissioning Industry Revenue billion Forecast, by Capacity 2020 & 2033
- Table 8: Global APAC Nuclear Power Reactor Decommissioning Industry Revenue billion Forecast, by Country 2020 & 2033
- Table 9: United States APAC Nuclear Power Reactor Decommissioning Industry Revenue (billion) Forecast, by Application 2020 & 2033
- Table 10: Canada APAC Nuclear Power Reactor Decommissioning Industry Revenue (billion) Forecast, by Application 2020 & 2033
- Table 11: Mexico APAC Nuclear Power Reactor Decommissioning Industry Revenue (billion) Forecast, by Application 2020 & 2033
- Table 12: Global APAC Nuclear Power Reactor Decommissioning Industry Revenue billion Forecast, by Reactor Type 2020 & 2033
- Table 13: Global APAC Nuclear Power Reactor Decommissioning Industry Revenue billion Forecast, by Application 2020 & 2033
- Table 14: Global APAC Nuclear Power Reactor Decommissioning Industry Revenue billion Forecast, by Capacity 2020 & 2033
- Table 15: Global APAC Nuclear Power Reactor Decommissioning Industry Revenue billion Forecast, by Country 2020 & 2033
- Table 16: Brazil APAC Nuclear Power Reactor Decommissioning Industry Revenue (billion) Forecast, by Application 2020 & 2033
- Table 17: Argentina APAC Nuclear Power Reactor Decommissioning Industry Revenue (billion) Forecast, by Application 2020 & 2033
- Table 18: Rest of South America APAC Nuclear Power Reactor Decommissioning Industry Revenue (billion) Forecast, by Application 2020 & 2033
- Table 19: Global APAC Nuclear Power Reactor Decommissioning Industry Revenue billion Forecast, by Reactor Type 2020 & 2033
- Table 20: Global APAC Nuclear Power Reactor Decommissioning Industry Revenue billion Forecast, by Application 2020 & 2033
- Table 21: Global APAC Nuclear Power Reactor Decommissioning Industry Revenue billion Forecast, by Capacity 2020 & 2033
- Table 22: Global APAC Nuclear Power Reactor Decommissioning Industry Revenue billion Forecast, by Country 2020 & 2033
- Table 23: United Kingdom APAC Nuclear Power Reactor Decommissioning Industry Revenue (billion) Forecast, by Application 2020 & 2033
- Table 24: Germany APAC Nuclear Power Reactor Decommissioning Industry Revenue (billion) Forecast, by Application 2020 & 2033
- Table 25: France APAC Nuclear Power Reactor Decommissioning Industry Revenue (billion) Forecast, by Application 2020 & 2033
- Table 26: Italy APAC Nuclear Power Reactor Decommissioning Industry Revenue (billion) Forecast, by Application 2020 & 2033
- Table 27: Spain APAC Nuclear Power Reactor Decommissioning Industry Revenue (billion) Forecast, by Application 2020 & 2033
- Table 28: Russia APAC Nuclear Power Reactor Decommissioning Industry Revenue (billion) Forecast, by Application 2020 & 2033
- Table 29: Benelux APAC Nuclear Power Reactor Decommissioning Industry Revenue (billion) Forecast, by Application 2020 & 2033
- Table 30: Nordics APAC Nuclear Power Reactor Decommissioning Industry Revenue (billion) Forecast, by Application 2020 & 2033
- Table 31: Rest of Europe APAC Nuclear Power Reactor Decommissioning Industry Revenue (billion) Forecast, by Application 2020 & 2033
- Table 32: Global APAC Nuclear Power Reactor Decommissioning Industry Revenue billion Forecast, by Reactor Type 2020 & 2033
- Table 33: Global APAC Nuclear Power Reactor Decommissioning Industry Revenue billion Forecast, by Application 2020 & 2033
- Table 34: Global APAC Nuclear Power Reactor Decommissioning Industry Revenue billion Forecast, by Capacity 2020 & 2033
- Table 35: Global APAC Nuclear Power Reactor Decommissioning Industry Revenue billion Forecast, by Country 2020 & 2033
- Table 36: Turkey APAC Nuclear Power Reactor Decommissioning Industry Revenue (billion) Forecast, by Application 2020 & 2033
- Table 37: Israel APAC Nuclear Power Reactor Decommissioning Industry Revenue (billion) Forecast, by Application 2020 & 2033
- Table 38: GCC APAC Nuclear Power Reactor Decommissioning Industry Revenue (billion) Forecast, by Application 2020 & 2033
- Table 39: North Africa APAC Nuclear Power Reactor Decommissioning Industry Revenue (billion) Forecast, by Application 2020 & 2033
- Table 40: South Africa APAC Nuclear Power Reactor Decommissioning Industry Revenue (billion) Forecast, by Application 2020 & 2033
- Table 41: Rest of Middle East & Africa APAC Nuclear Power Reactor Decommissioning Industry Revenue (billion) Forecast, by Application 2020 & 2033
- Table 42: Global APAC Nuclear Power Reactor Decommissioning Industry Revenue billion Forecast, by Reactor Type 2020 & 2033
- Table 43: Global APAC Nuclear Power Reactor Decommissioning Industry Revenue billion Forecast, by Application 2020 & 2033
- Table 44: Global APAC Nuclear Power Reactor Decommissioning Industry Revenue billion Forecast, by Capacity 2020 & 2033
- Table 45: Global APAC Nuclear Power Reactor Decommissioning Industry Revenue billion Forecast, by Country 2020 & 2033
- Table 46: China APAC Nuclear Power Reactor Decommissioning Industry Revenue (billion) Forecast, by Application 2020 & 2033
- Table 47: India APAC Nuclear Power Reactor Decommissioning Industry Revenue (billion) Forecast, by Application 2020 & 2033
- Table 48: Japan APAC Nuclear Power Reactor Decommissioning Industry Revenue (billion) Forecast, by Application 2020 & 2033
- Table 49: South Korea APAC Nuclear Power Reactor Decommissioning Industry Revenue (billion) Forecast, by Application 2020 & 2033
- Table 50: ASEAN APAC Nuclear Power Reactor Decommissioning Industry Revenue (billion) Forecast, by Application 2020 & 2033
- Table 51: Oceania APAC Nuclear Power Reactor Decommissioning Industry Revenue (billion) Forecast, by Application 2020 & 2033
- Table 52: Rest of Asia Pacific APAC Nuclear Power Reactor Decommissioning Industry Revenue (billion) Forecast, by Application 2020 & 2033
Frequently Asked Questions
1. What is the projected Compound Annual Growth Rate (CAGR) of the APAC Nuclear Power Reactor Decommissioning Industry?
The projected CAGR is approximately 3.59%.
2. Which companies are prominent players in the APAC Nuclear Power Reactor Decommissioning Industry?
Key companies in the market include Toshiba Corp*List Not Exhaustive, Korea Hydro & Nuclear Power Co Ltd, Orano SA, TÜV Rheinland Group, Snc-Lavalin Group Inc (Atkins), The Japan Atomic Power Co, GE- Hitachi Nuclear Energy Ltd, Tokyo Electric Power Company Holdings Inc.
3. What are the main segments of the APAC Nuclear Power Reactor Decommissioning Industry?
The market segments include Reactor Type, Application, Capacity.
4. Can you provide details about the market size?
The market size is estimated to be USD 8.01 billion as of 2022.
5. What are some drivers contributing to market growth?
Rising Demand for Reliable Electricity; Increasing Government Support for Hydropower Generation.
6. What are the notable trends driving market growth?
Commercial Power Reactor Expected to Dominate the Market.
7. Are there any restraints impacting market growth?
Negative Environmental Consequences of Hydropower Projects.
8. Can you provide examples of recent developments in the market?
May 2022: USA-based engineering group Jacobs has been selected by Tokyo Electric Power Company (Tepco) to support decommissioning efforts at its damaged Fukushima Daiichi nuclear power plant in Japan.
9. What pricing options are available for accessing the report?
Pricing options include single-user, multi-user, and enterprise licenses priced at USD 4750, USD 5250, and USD 8750 respectively.
10. Is the market size provided in terms of value or volume?
The market size is provided in terms of value, measured in billion.
11. Are there any specific market keywords associated with the report?
Yes, the market keyword associated with the report is "APAC Nuclear Power Reactor Decommissioning Industry," which aids in identifying and referencing the specific market segment covered.
12. How do I determine which pricing option suits my needs best?
The pricing options vary based on user requirements and access needs. Individual users may opt for single-user licenses, while businesses requiring broader access may choose multi-user or enterprise licenses for cost-effective access to the report.
13. Are there any additional resources or data provided in the APAC Nuclear Power Reactor Decommissioning Industry report?
While the report offers comprehensive insights, it's advisable to review the specific contents or supplementary materials provided to ascertain if additional resources or data are available.
14. How can I stay updated on further developments or reports in the APAC Nuclear Power Reactor Decommissioning Industry?
To stay informed about further developments, trends, and reports in the APAC Nuclear Power Reactor Decommissioning Industry, consider subscribing to industry newsletters, following relevant companies and organizations, or regularly checking reputable industry news sources and publications.
Methodology
Step 1 - Identification of Relevant Samples Size from Population Database


Step 2 - Approaches for Defining Global Market Size (Value, Volume* & Price*)

Note*: In applicable scenarios
Step 3 - Data Sources
Primary Research
- Web Analytics
- Survey Reports
- Research Institute
- Latest Research Reports
- Opinion Leaders
Secondary Research
- Annual Reports
- White Paper
- Latest Press Release
- Industry Association
- Paid Database
- Investor Presentations

Step 4 - Data Triangulation
Involves using different sources of information in order to increase the validity of a study
These sources are likely to be stakeholders in a program - participants, other researchers, program staff, other community members, and so on.
Then we put all data in single framework & apply various statistical tools to find out the dynamic on the market.
During the analysis stage, feedback from the stakeholder groups would be compared to determine areas of agreement as well as areas of divergence