

Key Insights
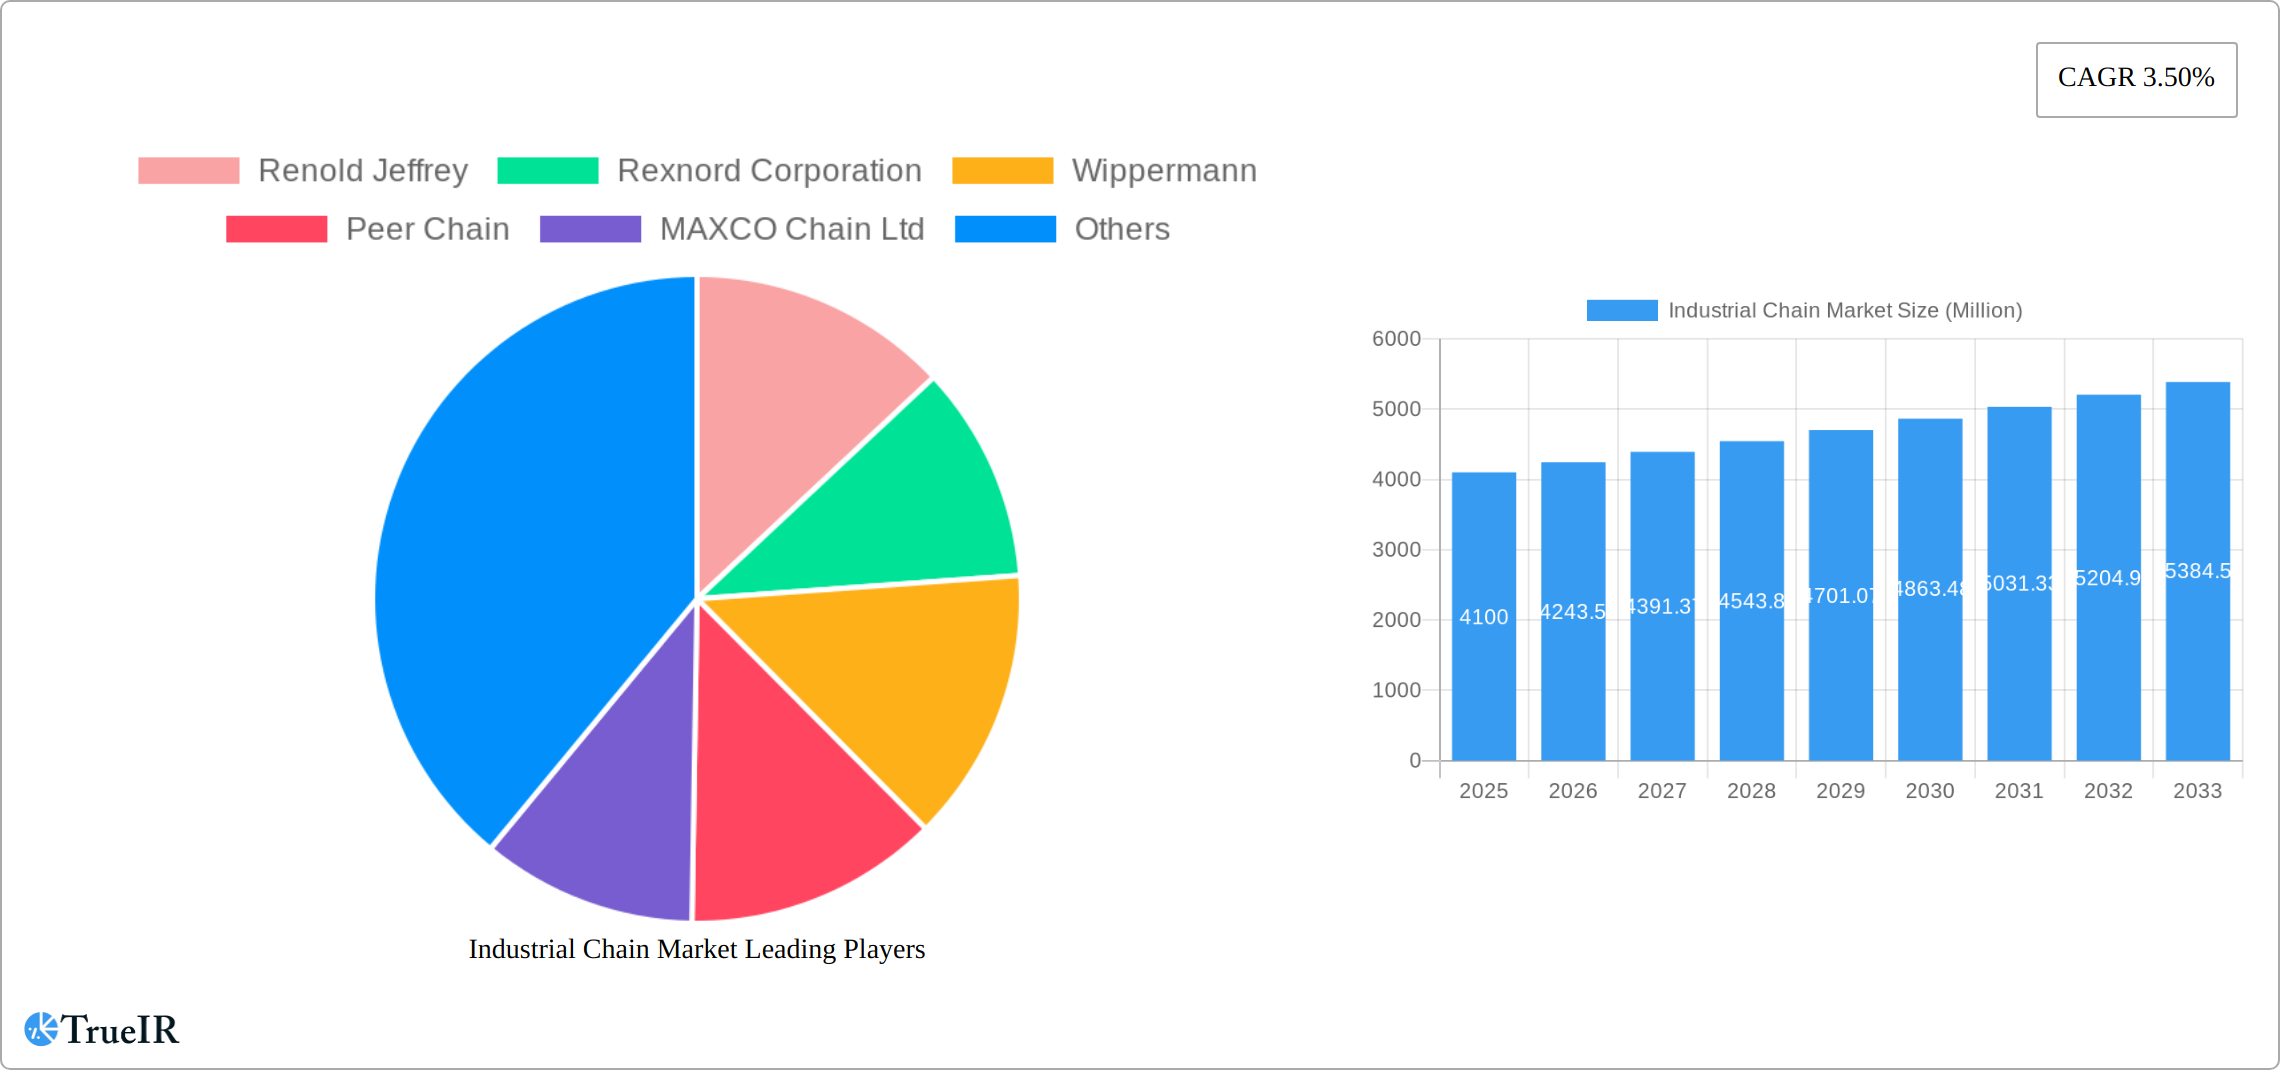
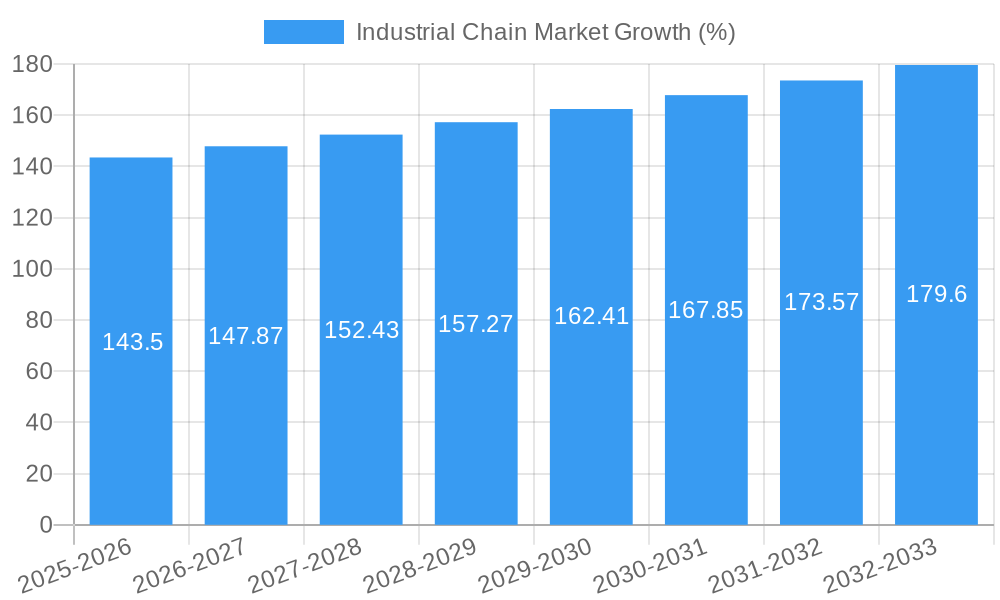
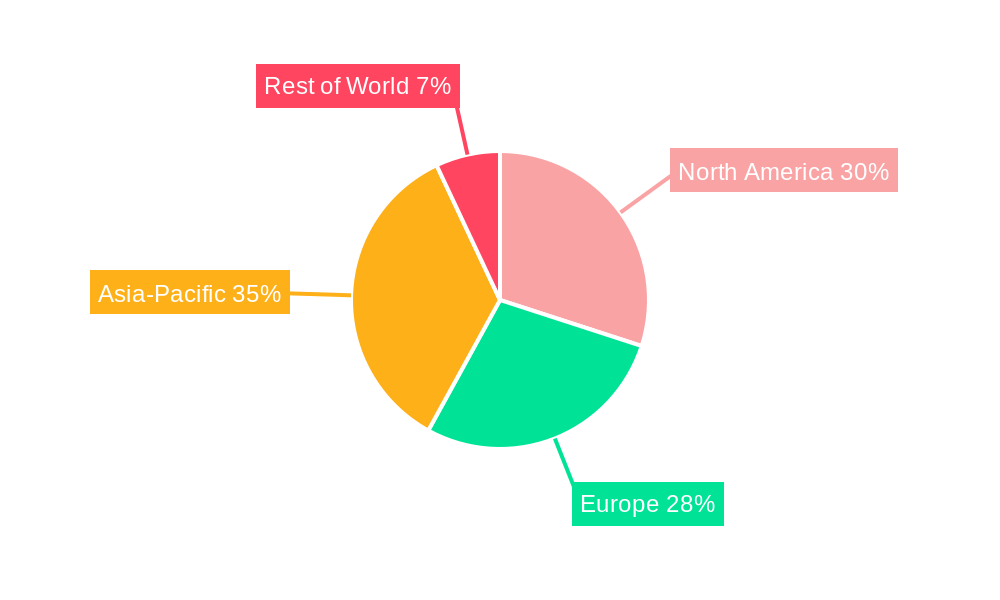
The global industrial chain market, valued at $4.10 billion in 2025, is projected to experience steady growth, driven by the increasing demand across various industries. A compound annual growth rate (CAGR) of 3.50% from 2025 to 2033 indicates a substantial market expansion. Key drivers include the burgeoning automotive and construction sectors, both of which rely heavily on efficient and durable chain systems for material handling and power transmission. Furthermore, the growing adoption of automation and robotics in manufacturing processes fuels the demand for high-precision industrial chains. While supply chain disruptions and fluctuating raw material prices pose challenges, technological advancements in chain design and manufacturing—leading to increased durability and efficiency—are mitigating these restraints. The market is segmented by chain type (roller, conveyor, etc.), material (steel, stainless steel, etc.), application (conveying, hoisting, etc.), and end-use industry (automotive, construction, etc.). Leading players like Renold Jeffrey, Rexnord Corporation, and Wippermann are driving innovation and expanding their market share through strategic partnerships and product diversification. The market's growth will be geographically dispersed, with significant contributions anticipated from North America, Europe, and Asia-Pacific regions, reflecting the concentration of manufacturing and industrial activity in these areas. The forecast period's steady growth reflects an overall positive outlook for the industry, driven by sustained global industrialization and infrastructural development. Competitive landscape will remain intensely dynamic as companies focus on technological advancements, strategic acquisitions, and expansion into emerging markets.
The market's segmentation presents opportunities for specialized players to cater to niche applications. For example, the growing demand for environmentally friendly manufacturing practices will drive the adoption of sustainable materials in chain production. Similarly, the integration of smart technologies and data analytics will lead to the development of intelligent chain systems capable of predictive maintenance and performance optimization. This will increase efficiency and minimize downtime, resulting in cost savings and improved productivity for end-users. The successful players will be those adept at adapting to the changing regulatory landscape, focusing on sustainable practices, and efficiently managing supply chain complexities. Continuous innovation and customer-centric approaches will be crucial for sustaining growth and market leadership in this competitive environment.
Dynamic Industrial Chain Market Report: 2019-2033
This comprehensive report provides an in-depth analysis of the global Industrial Chain Market, offering invaluable insights for stakeholders seeking to navigate this dynamic sector. Covering the period 2019-2033, with a focus on 2025, this study unravels market trends, competitive landscapes, and future growth prospects. The report's findings are supported by rigorous data analysis and expert insights, making it an essential resource for informed decision-making. The market is expected to reach xx Million by 2033, exhibiting a CAGR of xx% during the forecast period (2025-2033).
Industrial Chain Market Market Structure & Competitive Landscape
The Industrial Chain market is characterized by a moderately concentrated structure, with several major players holding significant market share. The Herfindahl-Hirschman Index (HHI) for 2024 is estimated at xx, indicating a moderately consolidated market. Innovation is a key driver, with companies constantly striving to improve chain durability, efficiency, and performance through advanced materials and manufacturing processes. Regulatory frameworks, varying across regions, significantly influence manufacturing standards and compliance costs. Product substitutes, such as belts and gears, present competitive challenges, although industrial chains maintain a strong advantage in specific applications. The market is segmented by application (e.g., material handling, automotive, agriculture) and chain type (roller chains, leaf chains, conveyor chains). M&A activity has been moderate in recent years, with xx major transactions recorded between 2019 and 2024, primarily driven by strategic expansion and technological acquisition.
- Market Concentration: HHI estimated at xx in 2024.
- Innovation Drivers: Advanced materials, precision manufacturing, automation.
- Regulatory Impacts: Varying standards and compliance costs across regions.
- Product Substitutes: Belts, gears, posing niche competition.
- End-User Segmentation: Material handling, automotive, agriculture, others.
- M&A Trends: xx major transactions between 2019-2024; strategic expansion and technology acquisition prevalent.
Industrial Chain Market Market Trends & Opportunities
The Industrial Chain market is experiencing robust growth, fueled by increasing industrial automation, expanding infrastructure development globally, and the rising demand for efficient material handling systems across various industries. The market size is projected to reach xx Million in 2025, expanding to xx Million by 2033. Technological advancements, such as the integration of smart sensors and predictive maintenance capabilities, are enhancing chain lifespan and operational efficiency. Consumer preferences are shifting towards higher durability, lower maintenance, and enhanced safety features. Competitive dynamics are intensifying, with companies investing heavily in R&D and strategic partnerships to gain a competitive edge. The market penetration rate for advanced chain technologies is currently at xx% and is projected to grow to xx% by 2033.
Dominant Markets & Segments in Industrial Chain Market
The Asia-Pacific region currently dominates the Industrial Chain market, driven by rapid industrialization, particularly in China and India. Strong infrastructure investments and supportive government policies are major growth catalysts. Europe and North America also maintain significant market shares due to established industrial bases and technological advancements.
- Key Growth Drivers in Asia-Pacific:
- Rapid industrialization and urbanization.
- Robust infrastructure development.
- Favorable government policies promoting industrial growth.
- Key Growth Drivers in Europe & North America:
- Established industrial base and technological expertise.
- High adoption of automation and advanced manufacturing technologies.
- Focus on sustainable and efficient material handling solutions.
The roller chain segment holds the largest market share, followed by leaf chains and conveyor chains. Each segment demonstrates unique growth trajectories based on specific applications and technological developments.
Industrial Chain Market Product Analysis
The Industrial Chain market offers a diverse range of products, including roller chains, leaf chains, conveyor chains, and specialized chains tailored to specific applications. Technological advancements focus on improving chain strength, wear resistance, and lubrication systems. Innovations in materials science, such as the use of high-strength steels and advanced coatings, are enhancing chain performance and durability. The market fit for these products is strong across various industries, driven by the need for efficient and reliable power transmission and material handling systems.
Key Drivers, Barriers & Challenges in Industrial Chain Market
Key Drivers: Rising industrial automation, growth in manufacturing sectors, expanding infrastructure projects, increasing demand for efficient material handling, technological advancements (smart sensors, predictive maintenance).
Challenges: Fluctuations in raw material prices, geopolitical uncertainties impacting supply chains, stringent environmental regulations, intense competition among manufacturers, potential for substitution by alternative technologies. These factors could potentially decrease market growth by an estimated xx% in certain regions.
Growth Drivers in the Industrial Chain Market Market
The industrial chain market is propelled by technological advancements in materials science, enabling the creation of stronger, more durable, and lighter chains. The rising demand for automation in manufacturing and material handling sectors fuels significant growth. Government regulations promoting efficient logistics and sustainable practices further bolster market expansion.
Challenges Impacting Industrial Chain Market Growth
Supply chain disruptions, price volatility of raw materials (steel, etc.), and the increasing cost of compliance with stringent environmental regulations pose significant challenges. Intense competition from established players and the emergence of new technologies offering alternative solutions also present hurdles to market growth.
Key Players Shaping the Industrial Chain Market Market
- Renold Jeffrey
- Rexnord Corporation
- Wippermann
- Peer Chain
- MAXCO Chain Ltd
- Zexus Chain Co Ltd
- Rolcon Engineering Co Ltd
- SKF International
- Katayama Chain (Changzhou) Co Ltd
- Tripcon Engineering Pvt Ltd
- MAXTOP - Ming Chang Chain
- KOBO USA LLC
- Hangzhou Qianjiang Chain Industries Co Ltd
- Shining Industrial Holding Co Ltd
- *List Not Exhaustive
Significant Industrial Chain Market Industry Milestones
- July 2024: Chiaravalli Group Spa and Wippermann jr GmbH signed a distribution agreement expanding Wippermann's European reach.
- June 2024: India's Ministry of Commerce and Industry mandated Standard Marks for precision chains, impacting manufacturers' compliance.
- June 2024: CHAIN & Conveyor Ltd partnered with Hoverdale UK Ltd, leveraging combined engineering expertise and global stockholding.
- July 2023: TIDC India highlighted its high-performance leaf chains, emphasizing adherence to international standards and OEM supply.
Future Outlook for Industrial Chain Market Market
The Industrial Chain market is poised for sustained growth, driven by ongoing industrial automation, infrastructure development, and the increasing demand for efficient and reliable material handling solutions. Strategic partnerships, technological innovations, and expansion into emerging markets will be key factors shaping future market dynamics. The focus on sustainability and the development of eco-friendly chain technologies will also play a crucial role in the market's evolution.
Industrial Chain Market Segmentation
-
1. Type
- 1.1. Roller Chain
- 1.2. Engineering Class Chain
- 1.3. Leaf Chain
- 1.4. Other Types
-
2. End-user Industry
- 2.1. Automotive Manufacturing
- 2.2. Energy and Power
- 2.3. Food and Beverage
- 2.4. Building and Construction
- 2.5. Other End-user Industries
Industrial Chain Market Segmentation By Geography
- 1. North America
- 2. Europe
- 3. Asia
- 4. Australia and New Zealand
- 5. Latin America
- 6. Middle East and Africa
Industrial Chain Market REPORT HIGHLIGHTS
| Aspects | Details |
|---|---|
| Study Period | 2019-2033 |
| Base Year | 2024 |
| Estimated Year | 2025 |
| Forecast Period | 2025-2033 |
| Historical Period | 2019-2024 |
| Growth Rate | CAGR of 3.50% from 2019-2033 |
| Segmentation |
|
Table of Contents
- 1. Introduction
- 1.1. Research Scope
- 1.2. Market Segmentation
- 1.3. Research Methodology
- 1.4. Definitions and Assumptions
- 2. Executive Summary
- 2.1. Introduction
- 3. Market Dynamics
- 3.1. Introduction
- 3.2. Market Drivers
- 3.2.1. Growing Manufacturing Industries and Increasing Usage of Industrial Chain Across the Industries; Increasing Technological Advancements
- 3.3. Market Restrains
- 3.3.1. Growing Manufacturing Industries and Increasing Usage of Industrial Chain Across the Industries; Increasing Technological Advancements
- 3.4. Market Trends
- 3.4.1. Roller Chain is Expected to Hold Significant Market Share
- 4. Market Factor Analysis
- 4.1. Porters Five Forces
- 4.2. Supply/Value Chain
- 4.3. PESTEL analysis
- 4.4. Market Entropy
- 4.5. Patent/Trademark Analysis
- 5. Global Industrial Chain Market Analysis, Insights and Forecast, 2019-2031
- 5.1. Market Analysis, Insights and Forecast - by Type
- 5.1.1. Roller Chain
- 5.1.2. Engineering Class Chain
- 5.1.3. Leaf Chain
- 5.1.4. Other Types
- 5.2. Market Analysis, Insights and Forecast - by End-user Industry
- 5.2.1. Automotive Manufacturing
- 5.2.2. Energy and Power
- 5.2.3. Food and Beverage
- 5.2.4. Building and Construction
- 5.2.5. Other End-user Industries
- 5.3. Market Analysis, Insights and Forecast - by Region
- 5.3.1. North America
- 5.3.2. Europe
- 5.3.3. Asia
- 5.3.4. Australia and New Zealand
- 5.3.5. Latin America
- 5.3.6. Middle East and Africa
- 5.1. Market Analysis, Insights and Forecast - by Type
- 6. North America Industrial Chain Market Analysis, Insights and Forecast, 2019-2031
- 6.1. Market Analysis, Insights and Forecast - by Type
- 6.1.1. Roller Chain
- 6.1.2. Engineering Class Chain
- 6.1.3. Leaf Chain
- 6.1.4. Other Types
- 6.2. Market Analysis, Insights and Forecast - by End-user Industry
- 6.2.1. Automotive Manufacturing
- 6.2.2. Energy and Power
- 6.2.3. Food and Beverage
- 6.2.4. Building and Construction
- 6.2.5. Other End-user Industries
- 6.1. Market Analysis, Insights and Forecast - by Type
- 7. Europe Industrial Chain Market Analysis, Insights and Forecast, 2019-2031
- 7.1. Market Analysis, Insights and Forecast - by Type
- 7.1.1. Roller Chain
- 7.1.2. Engineering Class Chain
- 7.1.3. Leaf Chain
- 7.1.4. Other Types
- 7.2. Market Analysis, Insights and Forecast - by End-user Industry
- 7.2.1. Automotive Manufacturing
- 7.2.2. Energy and Power
- 7.2.3. Food and Beverage
- 7.2.4. Building and Construction
- 7.2.5. Other End-user Industries
- 7.1. Market Analysis, Insights and Forecast - by Type
- 8. Asia Industrial Chain Market Analysis, Insights and Forecast, 2019-2031
- 8.1. Market Analysis, Insights and Forecast - by Type
- 8.1.1. Roller Chain
- 8.1.2. Engineering Class Chain
- 8.1.3. Leaf Chain
- 8.1.4. Other Types
- 8.2. Market Analysis, Insights and Forecast - by End-user Industry
- 8.2.1. Automotive Manufacturing
- 8.2.2. Energy and Power
- 8.2.3. Food and Beverage
- 8.2.4. Building and Construction
- 8.2.5. Other End-user Industries
- 8.1. Market Analysis, Insights and Forecast - by Type
- 9. Australia and New Zealand Industrial Chain Market Analysis, Insights and Forecast, 2019-2031
- 9.1. Market Analysis, Insights and Forecast - by Type
- 9.1.1. Roller Chain
- 9.1.2. Engineering Class Chain
- 9.1.3. Leaf Chain
- 9.1.4. Other Types
- 9.2. Market Analysis, Insights and Forecast - by End-user Industry
- 9.2.1. Automotive Manufacturing
- 9.2.2. Energy and Power
- 9.2.3. Food and Beverage
- 9.2.4. Building and Construction
- 9.2.5. Other End-user Industries
- 9.1. Market Analysis, Insights and Forecast - by Type
- 10. Latin America Industrial Chain Market Analysis, Insights and Forecast, 2019-2031
- 10.1. Market Analysis, Insights and Forecast - by Type
- 10.1.1. Roller Chain
- 10.1.2. Engineering Class Chain
- 10.1.3. Leaf Chain
- 10.1.4. Other Types
- 10.2. Market Analysis, Insights and Forecast - by End-user Industry
- 10.2.1. Automotive Manufacturing
- 10.2.2. Energy and Power
- 10.2.3. Food and Beverage
- 10.2.4. Building and Construction
- 10.2.5. Other End-user Industries
- 10.1. Market Analysis, Insights and Forecast - by Type
- 11. Middle East and Africa Industrial Chain Market Analysis, Insights and Forecast, 2019-2031
- 11.1. Market Analysis, Insights and Forecast - by Type
- 11.1.1. Roller Chain
- 11.1.2. Engineering Class Chain
- 11.1.3. Leaf Chain
- 11.1.4. Other Types
- 11.2. Market Analysis, Insights and Forecast - by End-user Industry
- 11.2.1. Automotive Manufacturing
- 11.2.2. Energy and Power
- 11.2.3. Food and Beverage
- 11.2.4. Building and Construction
- 11.2.5. Other End-user Industries
- 11.1. Market Analysis, Insights and Forecast - by Type
- 12. Competitive Analysis
- 12.1. Global Market Share Analysis 2024
- 12.2. Company Profiles
- 12.2.1 Renold Jeffrey
- 12.2.1.1. Overview
- 12.2.1.2. Products
- 12.2.1.3. SWOT Analysis
- 12.2.1.4. Recent Developments
- 12.2.1.5. Financials (Based on Availability)
- 12.2.2 Rexnord Corporation
- 12.2.2.1. Overview
- 12.2.2.2. Products
- 12.2.2.3. SWOT Analysis
- 12.2.2.4. Recent Developments
- 12.2.2.5. Financials (Based on Availability)
- 12.2.3 Wippermann
- 12.2.3.1. Overview
- 12.2.3.2. Products
- 12.2.3.3. SWOT Analysis
- 12.2.3.4. Recent Developments
- 12.2.3.5. Financials (Based on Availability)
- 12.2.4 Peer Chain
- 12.2.4.1. Overview
- 12.2.4.2. Products
- 12.2.4.3. SWOT Analysis
- 12.2.4.4. Recent Developments
- 12.2.4.5. Financials (Based on Availability)
- 12.2.5 MAXCO Chain Ltd
- 12.2.5.1. Overview
- 12.2.5.2. Products
- 12.2.5.3. SWOT Analysis
- 12.2.5.4. Recent Developments
- 12.2.5.5. Financials (Based on Availability)
- 12.2.6 Zexus Chain Co Ltd
- 12.2.6.1. Overview
- 12.2.6.2. Products
- 12.2.6.3. SWOT Analysis
- 12.2.6.4. Recent Developments
- 12.2.6.5. Financials (Based on Availability)
- 12.2.7 Rolcon Engineering Co Ltd
- 12.2.7.1. Overview
- 12.2.7.2. Products
- 12.2.7.3. SWOT Analysis
- 12.2.7.4. Recent Developments
- 12.2.7.5. Financials (Based on Availability)
- 12.2.8 SKF International
- 12.2.8.1. Overview
- 12.2.8.2. Products
- 12.2.8.3. SWOT Analysis
- 12.2.8.4. Recent Developments
- 12.2.8.5. Financials (Based on Availability)
- 12.2.9 Katayama Chain (Changzhou) Co Ltd
- 12.2.9.1. Overview
- 12.2.9.2. Products
- 12.2.9.3. SWOT Analysis
- 12.2.9.4. Recent Developments
- 12.2.9.5. Financials (Based on Availability)
- 12.2.10 Tripcon Engineering Pvt Ltd
- 12.2.10.1. Overview
- 12.2.10.2. Products
- 12.2.10.3. SWOT Analysis
- 12.2.10.4. Recent Developments
- 12.2.10.5. Financials (Based on Availability)
- 12.2.11 MAXTOP - Ming Chang Chain
- 12.2.11.1. Overview
- 12.2.11.2. Products
- 12.2.11.3. SWOT Analysis
- 12.2.11.4. Recent Developments
- 12.2.11.5. Financials (Based on Availability)
- 12.2.12 KOBO USA LLC
- 12.2.12.1. Overview
- 12.2.12.2. Products
- 12.2.12.3. SWOT Analysis
- 12.2.12.4. Recent Developments
- 12.2.12.5. Financials (Based on Availability)
- 12.2.13 Hangzhou Qianjiang Chain Industries Co Ltd
- 12.2.13.1. Overview
- 12.2.13.2. Products
- 12.2.13.3. SWOT Analysis
- 12.2.13.4. Recent Developments
- 12.2.13.5. Financials (Based on Availability)
- 12.2.14 Shining Industrial Holding Co Ltd*List Not Exhaustive
- 12.2.14.1. Overview
- 12.2.14.2. Products
- 12.2.14.3. SWOT Analysis
- 12.2.14.4. Recent Developments
- 12.2.14.5. Financials (Based on Availability)
- 12.2.1 Renold Jeffrey
List of Figures
- Figure 1: Global Industrial Chain Market Revenue Breakdown (Million, %) by Region 2024 & 2032
- Figure 2: Global Industrial Chain Market Volume Breakdown (Billion, %) by Region 2024 & 2032
- Figure 3: North America Industrial Chain Market Revenue (Million), by Type 2024 & 2032
- Figure 4: North America Industrial Chain Market Volume (Billion), by Type 2024 & 2032
- Figure 5: North America Industrial Chain Market Revenue Share (%), by Type 2024 & 2032
- Figure 6: North America Industrial Chain Market Volume Share (%), by Type 2024 & 2032
- Figure 7: North America Industrial Chain Market Revenue (Million), by End-user Industry 2024 & 2032
- Figure 8: North America Industrial Chain Market Volume (Billion), by End-user Industry 2024 & 2032
- Figure 9: North America Industrial Chain Market Revenue Share (%), by End-user Industry 2024 & 2032
- Figure 10: North America Industrial Chain Market Volume Share (%), by End-user Industry 2024 & 2032
- Figure 11: North America Industrial Chain Market Revenue (Million), by Country 2024 & 2032
- Figure 12: North America Industrial Chain Market Volume (Billion), by Country 2024 & 2032
- Figure 13: North America Industrial Chain Market Revenue Share (%), by Country 2024 & 2032
- Figure 14: North America Industrial Chain Market Volume Share (%), by Country 2024 & 2032
- Figure 15: Europe Industrial Chain Market Revenue (Million), by Type 2024 & 2032
- Figure 16: Europe Industrial Chain Market Volume (Billion), by Type 2024 & 2032
- Figure 17: Europe Industrial Chain Market Revenue Share (%), by Type 2024 & 2032
- Figure 18: Europe Industrial Chain Market Volume Share (%), by Type 2024 & 2032
- Figure 19: Europe Industrial Chain Market Revenue (Million), by End-user Industry 2024 & 2032
- Figure 20: Europe Industrial Chain Market Volume (Billion), by End-user Industry 2024 & 2032
- Figure 21: Europe Industrial Chain Market Revenue Share (%), by End-user Industry 2024 & 2032
- Figure 22: Europe Industrial Chain Market Volume Share (%), by End-user Industry 2024 & 2032
- Figure 23: Europe Industrial Chain Market Revenue (Million), by Country 2024 & 2032
- Figure 24: Europe Industrial Chain Market Volume (Billion), by Country 2024 & 2032
- Figure 25: Europe Industrial Chain Market Revenue Share (%), by Country 2024 & 2032
- Figure 26: Europe Industrial Chain Market Volume Share (%), by Country 2024 & 2032
- Figure 27: Asia Industrial Chain Market Revenue (Million), by Type 2024 & 2032
- Figure 28: Asia Industrial Chain Market Volume (Billion), by Type 2024 & 2032
- Figure 29: Asia Industrial Chain Market Revenue Share (%), by Type 2024 & 2032
- Figure 30: Asia Industrial Chain Market Volume Share (%), by Type 2024 & 2032
- Figure 31: Asia Industrial Chain Market Revenue (Million), by End-user Industry 2024 & 2032
- Figure 32: Asia Industrial Chain Market Volume (Billion), by End-user Industry 2024 & 2032
- Figure 33: Asia Industrial Chain Market Revenue Share (%), by End-user Industry 2024 & 2032
- Figure 34: Asia Industrial Chain Market Volume Share (%), by End-user Industry 2024 & 2032
- Figure 35: Asia Industrial Chain Market Revenue (Million), by Country 2024 & 2032
- Figure 36: Asia Industrial Chain Market Volume (Billion), by Country 2024 & 2032
- Figure 37: Asia Industrial Chain Market Revenue Share (%), by Country 2024 & 2032
- Figure 38: Asia Industrial Chain Market Volume Share (%), by Country 2024 & 2032
- Figure 39: Australia and New Zealand Industrial Chain Market Revenue (Million), by Type 2024 & 2032
- Figure 40: Australia and New Zealand Industrial Chain Market Volume (Billion), by Type 2024 & 2032
- Figure 41: Australia and New Zealand Industrial Chain Market Revenue Share (%), by Type 2024 & 2032
- Figure 42: Australia and New Zealand Industrial Chain Market Volume Share (%), by Type 2024 & 2032
- Figure 43: Australia and New Zealand Industrial Chain Market Revenue (Million), by End-user Industry 2024 & 2032
- Figure 44: Australia and New Zealand Industrial Chain Market Volume (Billion), by End-user Industry 2024 & 2032
- Figure 45: Australia and New Zealand Industrial Chain Market Revenue Share (%), by End-user Industry 2024 & 2032
- Figure 46: Australia and New Zealand Industrial Chain Market Volume Share (%), by End-user Industry 2024 & 2032
- Figure 47: Australia and New Zealand Industrial Chain Market Revenue (Million), by Country 2024 & 2032
- Figure 48: Australia and New Zealand Industrial Chain Market Volume (Billion), by Country 2024 & 2032
- Figure 49: Australia and New Zealand Industrial Chain Market Revenue Share (%), by Country 2024 & 2032
- Figure 50: Australia and New Zealand Industrial Chain Market Volume Share (%), by Country 2024 & 2032
- Figure 51: Latin America Industrial Chain Market Revenue (Million), by Type 2024 & 2032
- Figure 52: Latin America Industrial Chain Market Volume (Billion), by Type 2024 & 2032
- Figure 53: Latin America Industrial Chain Market Revenue Share (%), by Type 2024 & 2032
- Figure 54: Latin America Industrial Chain Market Volume Share (%), by Type 2024 & 2032
- Figure 55: Latin America Industrial Chain Market Revenue (Million), by End-user Industry 2024 & 2032
- Figure 56: Latin America Industrial Chain Market Volume (Billion), by End-user Industry 2024 & 2032
- Figure 57: Latin America Industrial Chain Market Revenue Share (%), by End-user Industry 2024 & 2032
- Figure 58: Latin America Industrial Chain Market Volume Share (%), by End-user Industry 2024 & 2032
- Figure 59: Latin America Industrial Chain Market Revenue (Million), by Country 2024 & 2032
- Figure 60: Latin America Industrial Chain Market Volume (Billion), by Country 2024 & 2032
- Figure 61: Latin America Industrial Chain Market Revenue Share (%), by Country 2024 & 2032
- Figure 62: Latin America Industrial Chain Market Volume Share (%), by Country 2024 & 2032
- Figure 63: Middle East and Africa Industrial Chain Market Revenue (Million), by Type 2024 & 2032
- Figure 64: Middle East and Africa Industrial Chain Market Volume (Billion), by Type 2024 & 2032
- Figure 65: Middle East and Africa Industrial Chain Market Revenue Share (%), by Type 2024 & 2032
- Figure 66: Middle East and Africa Industrial Chain Market Volume Share (%), by Type 2024 & 2032
- Figure 67: Middle East and Africa Industrial Chain Market Revenue (Million), by End-user Industry 2024 & 2032
- Figure 68: Middle East and Africa Industrial Chain Market Volume (Billion), by End-user Industry 2024 & 2032
- Figure 69: Middle East and Africa Industrial Chain Market Revenue Share (%), by End-user Industry 2024 & 2032
- Figure 70: Middle East and Africa Industrial Chain Market Volume Share (%), by End-user Industry 2024 & 2032
- Figure 71: Middle East and Africa Industrial Chain Market Revenue (Million), by Country 2024 & 2032
- Figure 72: Middle East and Africa Industrial Chain Market Volume (Billion), by Country 2024 & 2032
- Figure 73: Middle East and Africa Industrial Chain Market Revenue Share (%), by Country 2024 & 2032
- Figure 74: Middle East and Africa Industrial Chain Market Volume Share (%), by Country 2024 & 2032
List of Tables
- Table 1: Global Industrial Chain Market Revenue Million Forecast, by Region 2019 & 2032
- Table 2: Global Industrial Chain Market Volume Billion Forecast, by Region 2019 & 2032
- Table 3: Global Industrial Chain Market Revenue Million Forecast, by Type 2019 & 2032
- Table 4: Global Industrial Chain Market Volume Billion Forecast, by Type 2019 & 2032
- Table 5: Global Industrial Chain Market Revenue Million Forecast, by End-user Industry 2019 & 2032
- Table 6: Global Industrial Chain Market Volume Billion Forecast, by End-user Industry 2019 & 2032
- Table 7: Global Industrial Chain Market Revenue Million Forecast, by Region 2019 & 2032
- Table 8: Global Industrial Chain Market Volume Billion Forecast, by Region 2019 & 2032
- Table 9: Global Industrial Chain Market Revenue Million Forecast, by Type 2019 & 2032
- Table 10: Global Industrial Chain Market Volume Billion Forecast, by Type 2019 & 2032
- Table 11: Global Industrial Chain Market Revenue Million Forecast, by End-user Industry 2019 & 2032
- Table 12: Global Industrial Chain Market Volume Billion Forecast, by End-user Industry 2019 & 2032
- Table 13: Global Industrial Chain Market Revenue Million Forecast, by Country 2019 & 2032
- Table 14: Global Industrial Chain Market Volume Billion Forecast, by Country 2019 & 2032
- Table 15: Global Industrial Chain Market Revenue Million Forecast, by Type 2019 & 2032
- Table 16: Global Industrial Chain Market Volume Billion Forecast, by Type 2019 & 2032
- Table 17: Global Industrial Chain Market Revenue Million Forecast, by End-user Industry 2019 & 2032
- Table 18: Global Industrial Chain Market Volume Billion Forecast, by End-user Industry 2019 & 2032
- Table 19: Global Industrial Chain Market Revenue Million Forecast, by Country 2019 & 2032
- Table 20: Global Industrial Chain Market Volume Billion Forecast, by Country 2019 & 2032
- Table 21: Global Industrial Chain Market Revenue Million Forecast, by Type 2019 & 2032
- Table 22: Global Industrial Chain Market Volume Billion Forecast, by Type 2019 & 2032
- Table 23: Global Industrial Chain Market Revenue Million Forecast, by End-user Industry 2019 & 2032
- Table 24: Global Industrial Chain Market Volume Billion Forecast, by End-user Industry 2019 & 2032
- Table 25: Global Industrial Chain Market Revenue Million Forecast, by Country 2019 & 2032
- Table 26: Global Industrial Chain Market Volume Billion Forecast, by Country 2019 & 2032
- Table 27: Global Industrial Chain Market Revenue Million Forecast, by Type 2019 & 2032
- Table 28: Global Industrial Chain Market Volume Billion Forecast, by Type 2019 & 2032
- Table 29: Global Industrial Chain Market Revenue Million Forecast, by End-user Industry 2019 & 2032
- Table 30: Global Industrial Chain Market Volume Billion Forecast, by End-user Industry 2019 & 2032
- Table 31: Global Industrial Chain Market Revenue Million Forecast, by Country 2019 & 2032
- Table 32: Global Industrial Chain Market Volume Billion Forecast, by Country 2019 & 2032
- Table 33: Global Industrial Chain Market Revenue Million Forecast, by Type 2019 & 2032
- Table 34: Global Industrial Chain Market Volume Billion Forecast, by Type 2019 & 2032
- Table 35: Global Industrial Chain Market Revenue Million Forecast, by End-user Industry 2019 & 2032
- Table 36: Global Industrial Chain Market Volume Billion Forecast, by End-user Industry 2019 & 2032
- Table 37: Global Industrial Chain Market Revenue Million Forecast, by Country 2019 & 2032
- Table 38: Global Industrial Chain Market Volume Billion Forecast, by Country 2019 & 2032
- Table 39: Global Industrial Chain Market Revenue Million Forecast, by Type 2019 & 2032
- Table 40: Global Industrial Chain Market Volume Billion Forecast, by Type 2019 & 2032
- Table 41: Global Industrial Chain Market Revenue Million Forecast, by End-user Industry 2019 & 2032
- Table 42: Global Industrial Chain Market Volume Billion Forecast, by End-user Industry 2019 & 2032
- Table 43: Global Industrial Chain Market Revenue Million Forecast, by Country 2019 & 2032
- Table 44: Global Industrial Chain Market Volume Billion Forecast, by Country 2019 & 2032
Frequently Asked Questions
1. What is the projected Compound Annual Growth Rate (CAGR) of the Industrial Chain Market?
The projected CAGR is approximately 3.50%.
2. Which companies are prominent players in the Industrial Chain Market?
Key companies in the market include Renold Jeffrey, Rexnord Corporation, Wippermann, Peer Chain, MAXCO Chain Ltd, Zexus Chain Co Ltd, Rolcon Engineering Co Ltd, SKF International, Katayama Chain (Changzhou) Co Ltd, Tripcon Engineering Pvt Ltd, MAXTOP - Ming Chang Chain, KOBO USA LLC, Hangzhou Qianjiang Chain Industries Co Ltd, Shining Industrial Holding Co Ltd*List Not Exhaustive.
3. What are the main segments of the Industrial Chain Market?
The market segments include Type, End-user Industry.
4. Can you provide details about the market size?
The market size is estimated to be USD 4.10 Million as of 2022.
5. What are some drivers contributing to market growth?
Growing Manufacturing Industries and Increasing Usage of Industrial Chain Across the Industries; Increasing Technological Advancements.
6. What are the notable trends driving market growth?
Roller Chain is Expected to Hold Significant Market Share.
7. Are there any restraints impacting market growth?
Growing Manufacturing Industries and Increasing Usage of Industrial Chain Across the Industries; Increasing Technological Advancements.
8. Can you provide examples of recent developments in the market?
July 2024: Chiaravalli Group Spa signed a distribution agreement with Wippermann jr GmbH for roller chains in the European market. This partnership allows Wippermann to enhance Chiaravalli's offerings with a broader selection of premium solutions. Chiaravalli will oversee the integration of Wippermann's roller chains catalog into its operations.June 2024: The Ministry of Commerce and Industry, through its Department for Promotion of Industry and Internal Trade, issued a directive concerning Precision Roller and Bush Chains, Attachments, and Associated Chains Sprockets. This new directive enforces the mandatory use of the Standard Mark on certain goods that meet Indian Standards. The directive outlines penalties for non-compliance and sets implementation dates tailored to different categories of enterprises.June 2024: CHAIN & Conveyor Ltd (manufacturer of Leaf Chain) partnered with Hoverdale UK Ltd to leverage its combined engineering expertise and global stockholding capabilities. This strategic collaboration aims to maximize benefits for its respective customer bases. By deploying joint engineering teams, both organizations will streamline the installation and servicing of customer assets. This partnership will enhance Chain & Conveyor’s extensive inventory of parts and ancillary components, expanding it to all Hoverdale locations both nationally and internationally.July 2023: TIDC India designs and supplies high-performance Leaf Chains to global Original Equipment Manufacturers (OEMs) in the Material Handling sector. These chains strictly adhere to international standards, including ANSI, BS, and DIN. TIDC India's Leaf Chains are considered to be a trusted chain in Europe and the USA. TIDC India continually enhances the performance of its leaf chains by emphasizing key design elements.
9. What pricing options are available for accessing the report?
Pricing options include single-user, multi-user, and enterprise licenses priced at USD 4750, USD 5250, and USD 8750 respectively.
10. Is the market size provided in terms of value or volume?
The market size is provided in terms of value, measured in Million and volume, measured in Billion.
11. Are there any specific market keywords associated with the report?
Yes, the market keyword associated with the report is "Industrial Chain Market," which aids in identifying and referencing the specific market segment covered.
12. How do I determine which pricing option suits my needs best?
The pricing options vary based on user requirements and access needs. Individual users may opt for single-user licenses, while businesses requiring broader access may choose multi-user or enterprise licenses for cost-effective access to the report.
13. Are there any additional resources or data provided in the Industrial Chain Market report?
While the report offers comprehensive insights, it's advisable to review the specific contents or supplementary materials provided to ascertain if additional resources or data are available.
14. How can I stay updated on further developments or reports in the Industrial Chain Market?
To stay informed about further developments, trends, and reports in the Industrial Chain Market, consider subscribing to industry newsletters, following relevant companies and organizations, or regularly checking reputable industry news sources and publications.
Methodology
Step 1 - Identification of Relevant Samples Size from Population Database


Step 2 - Approaches for Defining Global Market Size (Value, Volume* & Price*)

Note*: In applicable scenarios
Step 3 - Data Sources
Primary Research
- Web Analytics
- Survey Reports
- Research Institute
- Latest Research Reports
- Opinion Leaders
Secondary Research
- Annual Reports
- White Paper
- Latest Press Release
- Industry Association
- Paid Database
- Investor Presentations

Step 4 - Data Triangulation
Involves using different sources of information in order to increase the validity of a study
These sources are likely to be stakeholders in a program - participants, other researchers, program staff, other community members, and so on.
Then we put all data in single framework & apply various statistical tools to find out the dynamic on the market.
During the analysis stage, feedback from the stakeholder groups would be compared to determine areas of agreement as well as areas of divergence
