

Key Insights
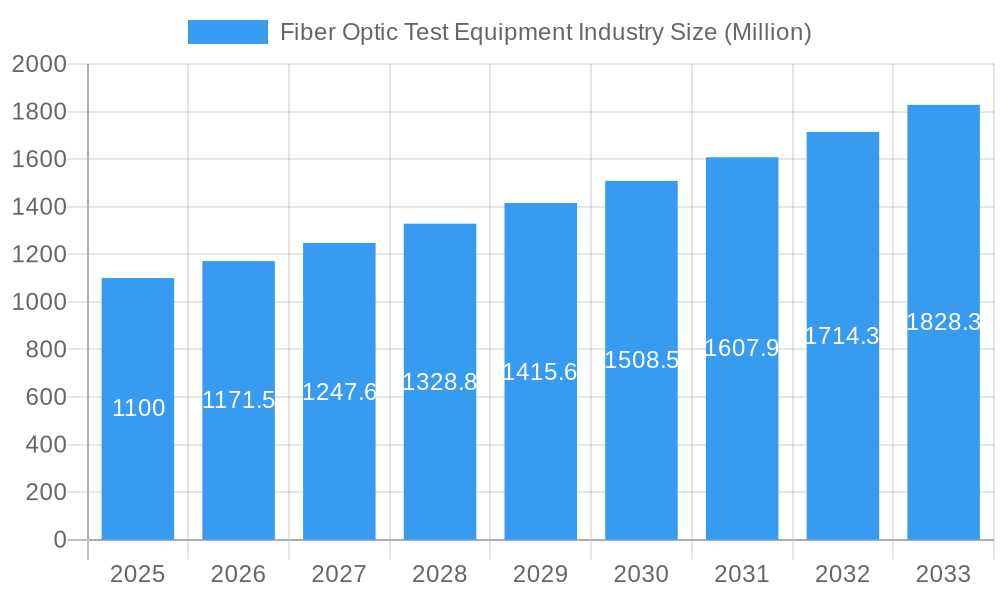
The Fiber Optic Test Equipment market, valued at $1.10 billion in 2025, is projected to experience robust growth, driven by the escalating demand for high-speed internet and data transmission across various sectors. The increasing adoption of 5G networks, cloud computing, and the expansion of data centers are key catalysts fueling this market expansion. A compound annual growth rate (CAGR) of 6.50% from 2025 to 2033 indicates a significant market opportunity. Growth is further propelled by the rising need for efficient network maintenance and troubleshooting, especially in telecommunications and data centers, demanding sophisticated testing solutions. Segment-wise, Optical Time Domain Reflectometers (OTDRs) and Optical Spectrum Analyzers (OSAs) are expected to dominate due to their precision and capability in addressing complex network issues. Geographically, North America and Europe currently hold significant market share, but the Asia-Pacific region, particularly China and India, is poised for rapid expansion due to substantial investments in infrastructure development. However, the market faces challenges, including the high cost of advanced equipment and the need for specialized expertise in operation and maintenance, which could potentially restrain growth to some degree.
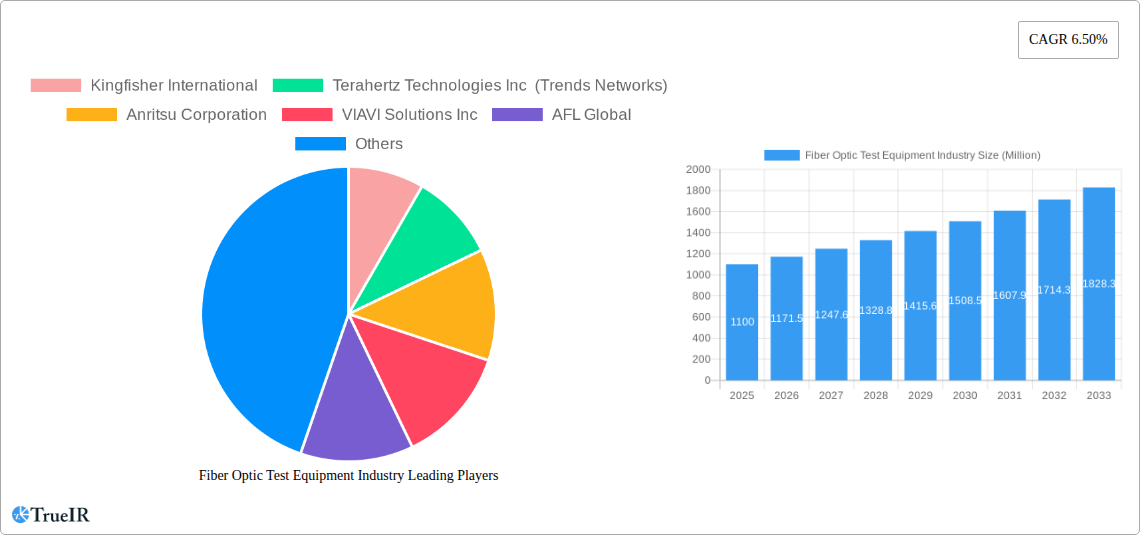
Fiber Optic Test Equipment Industry Market Size (In Billion)
Despite these restraints, the long-term outlook for the Fiber Optic Test Equipment market remains positive. The continuous evolution of fiber optic technologies, including the emergence of higher bandwidth capabilities and advanced network architectures, will necessitate the adoption of more sophisticated and specialized testing equipment. This technological advancement, coupled with the increasing demand for reliable and high-performance networks, ensures a sustainable and expanding market for manufacturers and service providers in the foreseeable future. Key players are focusing on strategic partnerships, technological innovations, and acquisitions to maintain their competitive edge and capitalize on this growth opportunity.
Fiber Optic Test Equipment Industry Company Market Share
Fiber Optic Test Equipment Industry Market Report: 2019-2033
This comprehensive report provides a detailed analysis of the Fiber Optic Test Equipment industry, offering invaluable insights for businesses, investors, and researchers. With a focus on market trends, competitive dynamics, and future projections, this report covers the period from 2019 to 2033, with a base year of 2025 and a forecast period of 2025-2033. The report values the market at xx Million in 2025, projecting significant growth through 2033. Key players like Kingfisher International, Terahertz Technologies Inc (Trends Networks), Anritsu Corporation, VIAVI Solutions Inc, AFL Global, Pelorus Technologies Pvt Ltd, EXFO Inc, Yokogawa Electric Corporation, AMS Technologies A, Deviser Instruments, Fluke Networks, and VeEX Inc. are analyzed, along with market segmentation by equipment type and end-user application.
Fiber Optic Test Equipment Industry Market Structure & Competitive Landscape
The Fiber Optic Test Equipment market exhibits a moderately concentrated structure, with several major players holding significant market share. The Herfindahl-Hirschman Index (HHI) is estimated at xx, indicating a moderately competitive landscape. Innovation drives competition, with companies continuously developing advanced testing solutions for higher bandwidths and improved accuracy. Regulatory compliance, particularly concerning safety and performance standards, influences market dynamics. Product substitution is limited, as the specialized nature of fiber optic testing necessitates specific equipment. The market is segmented by end-user applications, primarily encompassing telecommunications, data centers, and industrial sectors. M&A activity has been moderate, with xx transactions recorded between 2019 and 2024, primarily driven by efforts to expand product portfolios and gain access to new technologies. This resulted in a market consolidation of xx%.
- Market Concentration: Moderately concentrated, with an estimated HHI of xx.
- Innovation Drivers: Continuous development of high-speed testing solutions for 5G, 800G, and beyond.
- Regulatory Impacts: Compliance with international standards on safety and performance is crucial.
- Product Substitutes: Limited due to the specialized nature of fiber optic testing.
- End-User Segmentation: Primarily telecommunications, data centers, and industrial sectors.
- M&A Trends: Moderate activity, xx transactions between 2019 and 2024, resulting in xx% market consolidation.
Fiber Optic Test Equipment Industry Market Trends & Opportunities
The Fiber Optic Test Equipment market is experiencing robust growth, driven by the expanding global fiber optic infrastructure, fueled by the increasing demand for high-bandwidth data transmission across various sectors. The market is expected to exhibit a Compound Annual Growth Rate (CAGR) of xx% during the forecast period (2025-2033). This growth is fueled by several key factors, including the widespread adoption of 5G networks, the proliferation of data centers, and the increasing demand for high-speed internet connectivity in residential and commercial settings. Technological advancements, such as the development of advanced test modules capable of supporting 800G speeds, are further driving market expansion. Consumer preference for faster, more reliable internet services is a significant factor in this growth. Competitive dynamics are characterized by continuous innovation, strategic partnerships, and mergers and acquisitions aimed at enhancing product capabilities and expanding market reach. Market penetration rates vary across different end-user segments, with telecommunications currently holding the largest share, followed by data centers and industrial sectors.
Dominant Markets & Segments in Fiber Optic Test Equipment Industry
The North American region currently dominates the Fiber Optic Test Equipment market, followed closely by Asia-Pacific. Within equipment types, Optical Time Domain Reflectometers (OTDRs) and Optical Power Meters hold significant market share. The telecommunications sector accounts for the largest share of end-user applications.
- Leading Region: North America
- Leading Segment (Equipment Type): Optical Time Domain Reflectometer (OTDR)
- Leading Segment (End-user Application): Telecommunications
Key Growth Drivers:
- Telecommunications: Expansion of 5G networks and fiber-to-the-home (FTTH) initiatives.
- Data Centers: Increasing data storage and processing demands.
- Industries: Growing adoption of industrial automation and IoT applications.
- Government Policies: Investments in broadband infrastructure and digital transformation initiatives.
Fiber Optic Test Equipment Industry Product Analysis
The market features a diverse range of fiber optic test equipment, including Optical Light Sources, Optical Power and Loss Meters, OTDRs, Optical Spectrum Analyzers, and Remote Fiber Test Systems. Recent technological advancements focus on increased speed and accuracy, particularly to support high-bandwidth 5G and 800G networks. Companies are leveraging miniaturization and portability in their product design for field applications, enhancing user convenience and efficiency. The competitive landscape is defined by product features, performance, price, and support services, with manufacturers continuously striving to differentiate themselves through innovation and value-added features.
Key Drivers, Barriers & Challenges in Fiber Optic Test Equipment Industry
Key Drivers: The rapid growth of fiber optic networks, the escalating demand for higher bandwidths, particularly with the roll-out of 5G and 800G technologies, and government investments in broadband infrastructure are key drivers. Advances in testing technologies, offering greater speed, accuracy, and portability, are further boosting market growth.
Key Challenges: Intense competition, potential supply chain disruptions impacting component availability, and regulatory changes impacting the approval and adoption of new technologies present significant barriers. Furthermore, fluctuations in raw material prices can also influence the overall cost of production.
Growth Drivers in the Fiber Optic Test Equipment Industry Market
The expanding global fiber optic infrastructure, driven by the increasing demand for high-bandwidth data transmission across various sectors, is a key growth driver. Technological advancements, such as the development of advanced test modules supporting 800G speeds, further fuel market expansion. Government initiatives promoting digital transformation and investments in broadband infrastructure also contribute significantly.
Challenges Impacting Fiber Optic Test Equipment Industry Growth
Significant challenges include intense competition, potential supply chain disruptions affecting component availability, and regulatory hurdles hindering the adoption of new technologies. Fluctuations in raw material prices also influence production costs, impacting profitability.
Key Players Shaping the Fiber Optic Test Equipment Industry Market
- Kingfisher International
- Terahertz Technologies Inc (Trends Networks)
- Anritsu Corporation
- VIAVI Solutions Inc
- AFL Global
- Pelorus Technologies Pvt Ltd
- EXFO Inc
- Yokogawa Electric Corporation
- AMS Technologies A
- Deviser Instruments
- Fluke Networks
- VeEX Inc
Significant Fiber Optic Test Equipment Industry Milestones
- March 2024: VeEX Inc. unveils the RXT-6800 Advanced 800G Multiservice test module, significantly advancing high-speed testing capabilities.
- February 2024: Anritsu Corporation and MediaTek validate advanced 3TX technology in MediaTek's M80 5G modem, showcasing the capabilities of Anritsu's MT8000A test station for advanced 5G testing.
Future Outlook for Fiber Optic Test Equipment Industry Market
The Fiber Optic Test Equipment market is poised for sustained growth, driven by continued expansion of fiber optic networks globally, particularly in emerging economies. The increasing adoption of 5G and beyond, along with the growing demand for high-speed data transmission across various sectors, will create significant opportunities for market players. Strategic partnerships, technological innovation, and expansion into new markets are key to success in this dynamic landscape.
Fiber Optic Test Equipment Industry Segmentation
-
1. Equipment Type
- 1.1. Optical Light Sources
- 1.2. Optical Power and Loss Meters
- 1.3. Optical Time Domain Reflectometer
- 1.4. Optical Spectrum Analyzers
- 1.5. Remote Fiber Test System
- 1.6. Other Equipment Types
-
2. End-user Application
- 2.1. Telecommunications
- 2.2. Data Centers
- 2.3. Industries
- 2.4. Other End-user Applications
Fiber Optic Test Equipment Industry Segmentation By Geography
-
1. North America
- 1.1. United States
- 1.2. Canada
-
2. Europe
- 2.1. Germany
- 2.2. United Kingdom
- 2.3. France
-
3. Asia
- 3.1. China
- 3.2. Japan
- 3.3. India
- 4. Australia and New Zealand
-
5. Latin America
- 5.1. Brazil
- 5.2. Argentina
- 5.3. Mexico
-
6. Middle East and Africa
- 6.1. United Arab Emirates
- 6.2. South Africa
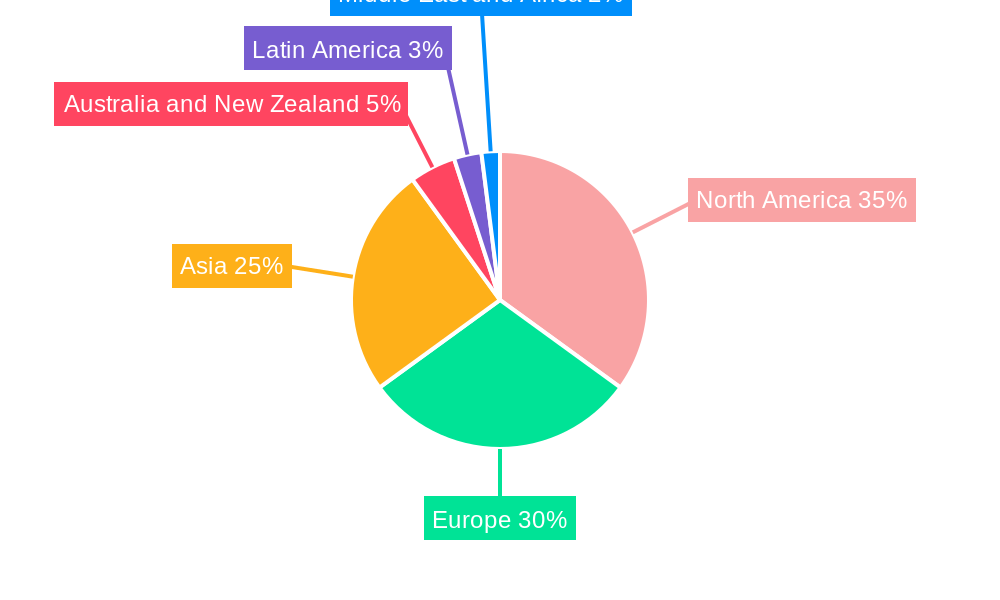
Fiber Optic Test Equipment Industry Regional Market Share
Geographic Coverage of Fiber Optic Test Equipment Industry
Fiber Optic Test Equipment Industry REPORT HIGHLIGHTS
| Aspects | Details |
|---|---|
| Study Period | 2020-2034 |
| Base Year | 2025 |
| Estimated Year | 2026 |
| Forecast Period | 2026-2034 |
| Historical Period | 2020-2025 |
| Growth Rate | CAGR of 6.50% from 2020-2034 |
| Segmentation |
|
Table of Contents
- 1. Introduction
- 1.1. Research Scope
- 1.2. Market Segmentation
- 1.3. Research Objective
- 1.4. Definitions and Assumptions
- 2. Executive Summary
- 2.1. Market Snapshot
- 3. Market Dynamics
- 3.1. Market Drivers
- 3.2. Market Restrains
- 3.3. Market Trends
- 3.4. Market Opportunities
- 4. Market Factor Analysis
- 4.1. Porters Five Forces
- 4.1.1. Bargaining Power of Suppliers
- 4.1.2. Bargaining Power of Buyers
- 4.1.3. Threat of New Entrants
- 4.1.4. Threat of Substitutes
- 4.1.5. Competitive Rivalry
- 4.2. PESTEL analysis
- 4.3. BCG Analysis
- 4.3.1. Stars (High Growth, High Market Share)
- 4.3.2. Cash Cows (Low Growth, High Market Share)
- 4.3.3. Question Mark (High Growth, Low Market Share)
- 4.3.4. Dogs (Low Growth, Low Market Share)
- 4.4. Ansoff Matrix Analysis
- 4.5. Supply Chain Analysis
- 4.6. Regulatory Landscape
- 4.7. Current Market Potential and Opportunity Assessment (TAM–SAM–SOM Framework)
- 4.8. TIR Analyst Note
- 4.1. Porters Five Forces
- 5. Market Analysis, Insights and Forecast 2021-2033
- 5.1. Market Analysis, Insights and Forecast - by Equipment Type
- 5.1.1. Optical Light Sources
- 5.1.2. Optical Power and Loss Meters
- 5.1.3. Optical Time Domain Reflectometer
- 5.1.4. Optical Spectrum Analyzers
- 5.1.5. Remote Fiber Test System
- 5.1.6. Other Equipment Types
- 5.2. Market Analysis, Insights and Forecast - by End-user Application
- 5.2.1. Telecommunications
- 5.2.2. Data Centers
- 5.2.3. Industries
- 5.2.4. Other End-user Applications
- 5.3. Market Analysis, Insights and Forecast - by Region
- 5.3.1. North America
- 5.3.2. Europe
- 5.3.3. Asia
- 5.3.4. Australia and New Zealand
- 5.3.5. Latin America
- 5.3.6. Middle East and Africa
- 5.1. Market Analysis, Insights and Forecast - by Equipment Type
- 6. Global Fiber Optic Test Equipment Industry Analysis, Insights and Forecast, 2021-2033
- 6.1. Market Analysis, Insights and Forecast - by Equipment Type
- 6.1.1. Optical Light Sources
- 6.1.2. Optical Power and Loss Meters
- 6.1.3. Optical Time Domain Reflectometer
- 6.1.4. Optical Spectrum Analyzers
- 6.1.5. Remote Fiber Test System
- 6.1.6. Other Equipment Types
- 6.2. Market Analysis, Insights and Forecast - by End-user Application
- 6.2.1. Telecommunications
- 6.2.2. Data Centers
- 6.2.3. Industries
- 6.2.4. Other End-user Applications
- 6.1. Market Analysis, Insights and Forecast - by Equipment Type
- 7. North America Fiber Optic Test Equipment Industry Analysis, Insights and Forecast, 2020-2032
- 7.1. Market Analysis, Insights and Forecast - by Equipment Type
- 7.1.1. Optical Light Sources
- 7.1.2. Optical Power and Loss Meters
- 7.1.3. Optical Time Domain Reflectometer
- 7.1.4. Optical Spectrum Analyzers
- 7.1.5. Remote Fiber Test System
- 7.1.6. Other Equipment Types
- 7.2. Market Analysis, Insights and Forecast - by End-user Application
- 7.2.1. Telecommunications
- 7.2.2. Data Centers
- 7.2.3. Industries
- 7.2.4. Other End-user Applications
- 7.1. Market Analysis, Insights and Forecast - by Equipment Type
- 8. Europe Fiber Optic Test Equipment Industry Analysis, Insights and Forecast, 2020-2032
- 8.1. Market Analysis, Insights and Forecast - by Equipment Type
- 8.1.1. Optical Light Sources
- 8.1.2. Optical Power and Loss Meters
- 8.1.3. Optical Time Domain Reflectometer
- 8.1.4. Optical Spectrum Analyzers
- 8.1.5. Remote Fiber Test System
- 8.1.6. Other Equipment Types
- 8.2. Market Analysis, Insights and Forecast - by End-user Application
- 8.2.1. Telecommunications
- 8.2.2. Data Centers
- 8.2.3. Industries
- 8.2.4. Other End-user Applications
- 8.1. Market Analysis, Insights and Forecast - by Equipment Type
- 9. Asia Fiber Optic Test Equipment Industry Analysis, Insights and Forecast, 2020-2032
- 9.1. Market Analysis, Insights and Forecast - by Equipment Type
- 9.1.1. Optical Light Sources
- 9.1.2. Optical Power and Loss Meters
- 9.1.3. Optical Time Domain Reflectometer
- 9.1.4. Optical Spectrum Analyzers
- 9.1.5. Remote Fiber Test System
- 9.1.6. Other Equipment Types
- 9.2. Market Analysis, Insights and Forecast - by End-user Application
- 9.2.1. Telecommunications
- 9.2.2. Data Centers
- 9.2.3. Industries
- 9.2.4. Other End-user Applications
- 9.1. Market Analysis, Insights and Forecast - by Equipment Type
- 10. Australia and New Zealand Fiber Optic Test Equipment Industry Analysis, Insights and Forecast, 2020-2032
- 10.1. Market Analysis, Insights and Forecast - by Equipment Type
- 10.1.1. Optical Light Sources
- 10.1.2. Optical Power and Loss Meters
- 10.1.3. Optical Time Domain Reflectometer
- 10.1.4. Optical Spectrum Analyzers
- 10.1.5. Remote Fiber Test System
- 10.1.6. Other Equipment Types
- 10.2. Market Analysis, Insights and Forecast - by End-user Application
- 10.2.1. Telecommunications
- 10.2.2. Data Centers
- 10.2.3. Industries
- 10.2.4. Other End-user Applications
- 10.1. Market Analysis, Insights and Forecast - by Equipment Type
- 11. Latin America Fiber Optic Test Equipment Industry Analysis, Insights and Forecast, 2020-2032
- 11.1. Market Analysis, Insights and Forecast - by Equipment Type
- 11.1.1. Optical Light Sources
- 11.1.2. Optical Power and Loss Meters
- 11.1.3. Optical Time Domain Reflectometer
- 11.1.4. Optical Spectrum Analyzers
- 11.1.5. Remote Fiber Test System
- 11.1.6. Other Equipment Types
- 11.2. Market Analysis, Insights and Forecast - by End-user Application
- 11.2.1. Telecommunications
- 11.2.2. Data Centers
- 11.2.3. Industries
- 11.2.4. Other End-user Applications
- 11.1. Market Analysis, Insights and Forecast - by Equipment Type
- 12. Middle East and Africa Fiber Optic Test Equipment Industry Analysis, Insights and Forecast, 2020-2032
- 12.1. Market Analysis, Insights and Forecast - by Equipment Type
- 12.1.1. Optical Light Sources
- 12.1.2. Optical Power and Loss Meters
- 12.1.3. Optical Time Domain Reflectometer
- 12.1.4. Optical Spectrum Analyzers
- 12.1.5. Remote Fiber Test System
- 12.1.6. Other Equipment Types
- 12.2. Market Analysis, Insights and Forecast - by End-user Application
- 12.2.1. Telecommunications
- 12.2.2. Data Centers
- 12.2.3. Industries
- 12.2.4. Other End-user Applications
- 12.1. Market Analysis, Insights and Forecast - by Equipment Type
- 13. Competitive Analysis
- 13.1. Company Profiles
- 13.1.1 Kingfisher International
- 13.1.1.1. Company Overview
- 13.1.1.2. Products
- 13.1.1.3. Company Financials
- 13.1.1.4. SWOT Analysis
- 13.1.2 Terahertz Technologies Inc (Trends Networks)
- 13.1.2.1. Company Overview
- 13.1.2.2. Products
- 13.1.2.3. Company Financials
- 13.1.2.4. SWOT Analysis
- 13.1.3 Anritsu Corporation
- 13.1.3.1. Company Overview
- 13.1.3.2. Products
- 13.1.3.3. Company Financials
- 13.1.3.4. SWOT Analysis
- 13.1.4 VIAVI Solutions Inc
- 13.1.4.1. Company Overview
- 13.1.4.2. Products
- 13.1.4.3. Company Financials
- 13.1.4.4. SWOT Analysis
- 13.1.5 AFL Global
- 13.1.5.1. Company Overview
- 13.1.5.2. Products
- 13.1.5.3. Company Financials
- 13.1.5.4. SWOT Analysis
- 13.1.6 Pelorus Technologies Pvt Ltd
- 13.1.6.1. Company Overview
- 13.1.6.2. Products
- 13.1.6.3. Company Financials
- 13.1.6.4. SWOT Analysis
- 13.1.7 EXFO Inc
- 13.1.7.1. Company Overview
- 13.1.7.2. Products
- 13.1.7.3. Company Financials
- 13.1.7.4. SWOT Analysis
- 13.1.8 Yokogawa Electric Corporation
- 13.1.8.1. Company Overview
- 13.1.8.2. Products
- 13.1.8.3. Company Financials
- 13.1.8.4. SWOT Analysis
- 13.1.9 AMS Technologies A
- 13.1.9.1. Company Overview
- 13.1.9.2. Products
- 13.1.9.3. Company Financials
- 13.1.9.4. SWOT Analysis
- 13.1.10 Deviser Instruments
- 13.1.10.1. Company Overview
- 13.1.10.2. Products
- 13.1.10.3. Company Financials
- 13.1.10.4. SWOT Analysis
- 13.1.11 Fluke Networks
- 13.1.11.1. Company Overview
- 13.1.11.2. Products
- 13.1.11.3. Company Financials
- 13.1.11.4. SWOT Analysis
- 13.1.12 VeEX Inc
- 13.1.12.1. Company Overview
- 13.1.12.2. Products
- 13.1.12.3. Company Financials
- 13.1.12.4. SWOT Analysis
- 13.1.1 Kingfisher International
- 13.2. Market Entropy
- 13.2.1 Company's Key Areas Served
- 13.2.2 Recent Developments
- 13.3. Company Market Share Analysis 2025
- 13.3.1 Top 5 Companies Market Share Analysis
- 13.3.2 Top 3 Companies Market Share Analysis
- 13.4. List of Potential Customers
- 14. Research Methodology
List of Figures
- Figure 1: Global Fiber Optic Test Equipment Industry Revenue Breakdown (Million, %) by Region 2025 & 2033
- Figure 2: Global Fiber Optic Test Equipment Industry Volume Breakdown (K Unit, %) by Region 2025 & 2033
- Figure 3: North America Fiber Optic Test Equipment Industry Revenue (Million), by Equipment Type 2025 & 2033
- Figure 4: North America Fiber Optic Test Equipment Industry Volume (K Unit), by Equipment Type 2025 & 2033
- Figure 5: North America Fiber Optic Test Equipment Industry Revenue Share (%), by Equipment Type 2025 & 2033
- Figure 6: North America Fiber Optic Test Equipment Industry Volume Share (%), by Equipment Type 2025 & 2033
- Figure 7: North America Fiber Optic Test Equipment Industry Revenue (Million), by End-user Application 2025 & 2033
- Figure 8: North America Fiber Optic Test Equipment Industry Volume (K Unit), by End-user Application 2025 & 2033
- Figure 9: North America Fiber Optic Test Equipment Industry Revenue Share (%), by End-user Application 2025 & 2033
- Figure 10: North America Fiber Optic Test Equipment Industry Volume Share (%), by End-user Application 2025 & 2033
- Figure 11: North America Fiber Optic Test Equipment Industry Revenue (Million), by Country 2025 & 2033
- Figure 12: North America Fiber Optic Test Equipment Industry Volume (K Unit), by Country 2025 & 2033
- Figure 13: North America Fiber Optic Test Equipment Industry Revenue Share (%), by Country 2025 & 2033
- Figure 14: North America Fiber Optic Test Equipment Industry Volume Share (%), by Country 2025 & 2033
- Figure 15: Europe Fiber Optic Test Equipment Industry Revenue (Million), by Equipment Type 2025 & 2033
- Figure 16: Europe Fiber Optic Test Equipment Industry Volume (K Unit), by Equipment Type 2025 & 2033
- Figure 17: Europe Fiber Optic Test Equipment Industry Revenue Share (%), by Equipment Type 2025 & 2033
- Figure 18: Europe Fiber Optic Test Equipment Industry Volume Share (%), by Equipment Type 2025 & 2033
- Figure 19: Europe Fiber Optic Test Equipment Industry Revenue (Million), by End-user Application 2025 & 2033
- Figure 20: Europe Fiber Optic Test Equipment Industry Volume (K Unit), by End-user Application 2025 & 2033
- Figure 21: Europe Fiber Optic Test Equipment Industry Revenue Share (%), by End-user Application 2025 & 2033
- Figure 22: Europe Fiber Optic Test Equipment Industry Volume Share (%), by End-user Application 2025 & 2033
- Figure 23: Europe Fiber Optic Test Equipment Industry Revenue (Million), by Country 2025 & 2033
- Figure 24: Europe Fiber Optic Test Equipment Industry Volume (K Unit), by Country 2025 & 2033
- Figure 25: Europe Fiber Optic Test Equipment Industry Revenue Share (%), by Country 2025 & 2033
- Figure 26: Europe Fiber Optic Test Equipment Industry Volume Share (%), by Country 2025 & 2033
- Figure 27: Asia Fiber Optic Test Equipment Industry Revenue (Million), by Equipment Type 2025 & 2033
- Figure 28: Asia Fiber Optic Test Equipment Industry Volume (K Unit), by Equipment Type 2025 & 2033
- Figure 29: Asia Fiber Optic Test Equipment Industry Revenue Share (%), by Equipment Type 2025 & 2033
- Figure 30: Asia Fiber Optic Test Equipment Industry Volume Share (%), by Equipment Type 2025 & 2033
- Figure 31: Asia Fiber Optic Test Equipment Industry Revenue (Million), by End-user Application 2025 & 2033
- Figure 32: Asia Fiber Optic Test Equipment Industry Volume (K Unit), by End-user Application 2025 & 2033
- Figure 33: Asia Fiber Optic Test Equipment Industry Revenue Share (%), by End-user Application 2025 & 2033
- Figure 34: Asia Fiber Optic Test Equipment Industry Volume Share (%), by End-user Application 2025 & 2033
- Figure 35: Asia Fiber Optic Test Equipment Industry Revenue (Million), by Country 2025 & 2033
- Figure 36: Asia Fiber Optic Test Equipment Industry Volume (K Unit), by Country 2025 & 2033
- Figure 37: Asia Fiber Optic Test Equipment Industry Revenue Share (%), by Country 2025 & 2033
- Figure 38: Asia Fiber Optic Test Equipment Industry Volume Share (%), by Country 2025 & 2033
- Figure 39: Australia and New Zealand Fiber Optic Test Equipment Industry Revenue (Million), by Equipment Type 2025 & 2033
- Figure 40: Australia and New Zealand Fiber Optic Test Equipment Industry Volume (K Unit), by Equipment Type 2025 & 2033
- Figure 41: Australia and New Zealand Fiber Optic Test Equipment Industry Revenue Share (%), by Equipment Type 2025 & 2033
- Figure 42: Australia and New Zealand Fiber Optic Test Equipment Industry Volume Share (%), by Equipment Type 2025 & 2033
- Figure 43: Australia and New Zealand Fiber Optic Test Equipment Industry Revenue (Million), by End-user Application 2025 & 2033
- Figure 44: Australia and New Zealand Fiber Optic Test Equipment Industry Volume (K Unit), by End-user Application 2025 & 2033
- Figure 45: Australia and New Zealand Fiber Optic Test Equipment Industry Revenue Share (%), by End-user Application 2025 & 2033
- Figure 46: Australia and New Zealand Fiber Optic Test Equipment Industry Volume Share (%), by End-user Application 2025 & 2033
- Figure 47: Australia and New Zealand Fiber Optic Test Equipment Industry Revenue (Million), by Country 2025 & 2033
- Figure 48: Australia and New Zealand Fiber Optic Test Equipment Industry Volume (K Unit), by Country 2025 & 2033
- Figure 49: Australia and New Zealand Fiber Optic Test Equipment Industry Revenue Share (%), by Country 2025 & 2033
- Figure 50: Australia and New Zealand Fiber Optic Test Equipment Industry Volume Share (%), by Country 2025 & 2033
- Figure 51: Latin America Fiber Optic Test Equipment Industry Revenue (Million), by Equipment Type 2025 & 2033
- Figure 52: Latin America Fiber Optic Test Equipment Industry Volume (K Unit), by Equipment Type 2025 & 2033
- Figure 53: Latin America Fiber Optic Test Equipment Industry Revenue Share (%), by Equipment Type 2025 & 2033
- Figure 54: Latin America Fiber Optic Test Equipment Industry Volume Share (%), by Equipment Type 2025 & 2033
- Figure 55: Latin America Fiber Optic Test Equipment Industry Revenue (Million), by End-user Application 2025 & 2033
- Figure 56: Latin America Fiber Optic Test Equipment Industry Volume (K Unit), by End-user Application 2025 & 2033
- Figure 57: Latin America Fiber Optic Test Equipment Industry Revenue Share (%), by End-user Application 2025 & 2033
- Figure 58: Latin America Fiber Optic Test Equipment Industry Volume Share (%), by End-user Application 2025 & 2033
- Figure 59: Latin America Fiber Optic Test Equipment Industry Revenue (Million), by Country 2025 & 2033
- Figure 60: Latin America Fiber Optic Test Equipment Industry Volume (K Unit), by Country 2025 & 2033
- Figure 61: Latin America Fiber Optic Test Equipment Industry Revenue Share (%), by Country 2025 & 2033
- Figure 62: Latin America Fiber Optic Test Equipment Industry Volume Share (%), by Country 2025 & 2033
- Figure 63: Middle East and Africa Fiber Optic Test Equipment Industry Revenue (Million), by Equipment Type 2025 & 2033
- Figure 64: Middle East and Africa Fiber Optic Test Equipment Industry Volume (K Unit), by Equipment Type 2025 & 2033
- Figure 65: Middle East and Africa Fiber Optic Test Equipment Industry Revenue Share (%), by Equipment Type 2025 & 2033
- Figure 66: Middle East and Africa Fiber Optic Test Equipment Industry Volume Share (%), by Equipment Type 2025 & 2033
- Figure 67: Middle East and Africa Fiber Optic Test Equipment Industry Revenue (Million), by End-user Application 2025 & 2033
- Figure 68: Middle East and Africa Fiber Optic Test Equipment Industry Volume (K Unit), by End-user Application 2025 & 2033
- Figure 69: Middle East and Africa Fiber Optic Test Equipment Industry Revenue Share (%), by End-user Application 2025 & 2033
- Figure 70: Middle East and Africa Fiber Optic Test Equipment Industry Volume Share (%), by End-user Application 2025 & 2033
- Figure 71: Middle East and Africa Fiber Optic Test Equipment Industry Revenue (Million), by Country 2025 & 2033
- Figure 72: Middle East and Africa Fiber Optic Test Equipment Industry Volume (K Unit), by Country 2025 & 2033
- Figure 73: Middle East and Africa Fiber Optic Test Equipment Industry Revenue Share (%), by Country 2025 & 2033
- Figure 74: Middle East and Africa Fiber Optic Test Equipment Industry Volume Share (%), by Country 2025 & 2033
List of Tables
- Table 1: Global Fiber Optic Test Equipment Industry Revenue Million Forecast, by Equipment Type 2020 & 2033
- Table 2: Global Fiber Optic Test Equipment Industry Volume K Unit Forecast, by Equipment Type 2020 & 2033
- Table 3: Global Fiber Optic Test Equipment Industry Revenue Million Forecast, by End-user Application 2020 & 2033
- Table 4: Global Fiber Optic Test Equipment Industry Volume K Unit Forecast, by End-user Application 2020 & 2033
- Table 5: Global Fiber Optic Test Equipment Industry Revenue Million Forecast, by Region 2020 & 2033
- Table 6: Global Fiber Optic Test Equipment Industry Volume K Unit Forecast, by Region 2020 & 2033
- Table 7: Global Fiber Optic Test Equipment Industry Revenue Million Forecast, by Equipment Type 2020 & 2033
- Table 8: Global Fiber Optic Test Equipment Industry Volume K Unit Forecast, by Equipment Type 2020 & 2033
- Table 9: Global Fiber Optic Test Equipment Industry Revenue Million Forecast, by End-user Application 2020 & 2033
- Table 10: Global Fiber Optic Test Equipment Industry Volume K Unit Forecast, by End-user Application 2020 & 2033
- Table 11: Global Fiber Optic Test Equipment Industry Revenue Million Forecast, by Country 2020 & 2033
- Table 12: Global Fiber Optic Test Equipment Industry Volume K Unit Forecast, by Country 2020 & 2033
- Table 13: United States Fiber Optic Test Equipment Industry Revenue (Million) Forecast, by Application 2020 & 2033
- Table 14: United States Fiber Optic Test Equipment Industry Volume (K Unit) Forecast, by Application 2020 & 2033
- Table 15: Canada Fiber Optic Test Equipment Industry Revenue (Million) Forecast, by Application 2020 & 2033
- Table 16: Canada Fiber Optic Test Equipment Industry Volume (K Unit) Forecast, by Application 2020 & 2033
- Table 17: Global Fiber Optic Test Equipment Industry Revenue Million Forecast, by Equipment Type 2020 & 2033
- Table 18: Global Fiber Optic Test Equipment Industry Volume K Unit Forecast, by Equipment Type 2020 & 2033
- Table 19: Global Fiber Optic Test Equipment Industry Revenue Million Forecast, by End-user Application 2020 & 2033
- Table 20: Global Fiber Optic Test Equipment Industry Volume K Unit Forecast, by End-user Application 2020 & 2033
- Table 21: Global Fiber Optic Test Equipment Industry Revenue Million Forecast, by Country 2020 & 2033
- Table 22: Global Fiber Optic Test Equipment Industry Volume K Unit Forecast, by Country 2020 & 2033
- Table 23: Germany Fiber Optic Test Equipment Industry Revenue (Million) Forecast, by Application 2020 & 2033
- Table 24: Germany Fiber Optic Test Equipment Industry Volume (K Unit) Forecast, by Application 2020 & 2033
- Table 25: United Kingdom Fiber Optic Test Equipment Industry Revenue (Million) Forecast, by Application 2020 & 2033
- Table 26: United Kingdom Fiber Optic Test Equipment Industry Volume (K Unit) Forecast, by Application 2020 & 2033
- Table 27: France Fiber Optic Test Equipment Industry Revenue (Million) Forecast, by Application 2020 & 2033
- Table 28: France Fiber Optic Test Equipment Industry Volume (K Unit) Forecast, by Application 2020 & 2033
- Table 29: Global Fiber Optic Test Equipment Industry Revenue Million Forecast, by Equipment Type 2020 & 2033
- Table 30: Global Fiber Optic Test Equipment Industry Volume K Unit Forecast, by Equipment Type 2020 & 2033
- Table 31: Global Fiber Optic Test Equipment Industry Revenue Million Forecast, by End-user Application 2020 & 2033
- Table 32: Global Fiber Optic Test Equipment Industry Volume K Unit Forecast, by End-user Application 2020 & 2033
- Table 33: Global Fiber Optic Test Equipment Industry Revenue Million Forecast, by Country 2020 & 2033
- Table 34: Global Fiber Optic Test Equipment Industry Volume K Unit Forecast, by Country 2020 & 2033
- Table 35: China Fiber Optic Test Equipment Industry Revenue (Million) Forecast, by Application 2020 & 2033
- Table 36: China Fiber Optic Test Equipment Industry Volume (K Unit) Forecast, by Application 2020 & 2033
- Table 37: Japan Fiber Optic Test Equipment Industry Revenue (Million) Forecast, by Application 2020 & 2033
- Table 38: Japan Fiber Optic Test Equipment Industry Volume (K Unit) Forecast, by Application 2020 & 2033
- Table 39: India Fiber Optic Test Equipment Industry Revenue (Million) Forecast, by Application 2020 & 2033
- Table 40: India Fiber Optic Test Equipment Industry Volume (K Unit) Forecast, by Application 2020 & 2033
- Table 41: Global Fiber Optic Test Equipment Industry Revenue Million Forecast, by Equipment Type 2020 & 2033
- Table 42: Global Fiber Optic Test Equipment Industry Volume K Unit Forecast, by Equipment Type 2020 & 2033
- Table 43: Global Fiber Optic Test Equipment Industry Revenue Million Forecast, by End-user Application 2020 & 2033
- Table 44: Global Fiber Optic Test Equipment Industry Volume K Unit Forecast, by End-user Application 2020 & 2033
- Table 45: Global Fiber Optic Test Equipment Industry Revenue Million Forecast, by Country 2020 & 2033
- Table 46: Global Fiber Optic Test Equipment Industry Volume K Unit Forecast, by Country 2020 & 2033
- Table 47: Global Fiber Optic Test Equipment Industry Revenue Million Forecast, by Equipment Type 2020 & 2033
- Table 48: Global Fiber Optic Test Equipment Industry Volume K Unit Forecast, by Equipment Type 2020 & 2033
- Table 49: Global Fiber Optic Test Equipment Industry Revenue Million Forecast, by End-user Application 2020 & 2033
- Table 50: Global Fiber Optic Test Equipment Industry Volume K Unit Forecast, by End-user Application 2020 & 2033
- Table 51: Global Fiber Optic Test Equipment Industry Revenue Million Forecast, by Country 2020 & 2033
- Table 52: Global Fiber Optic Test Equipment Industry Volume K Unit Forecast, by Country 2020 & 2033
- Table 53: Brazil Fiber Optic Test Equipment Industry Revenue (Million) Forecast, by Application 2020 & 2033
- Table 54: Brazil Fiber Optic Test Equipment Industry Volume (K Unit) Forecast, by Application 2020 & 2033
- Table 55: Argentina Fiber Optic Test Equipment Industry Revenue (Million) Forecast, by Application 2020 & 2033
- Table 56: Argentina Fiber Optic Test Equipment Industry Volume (K Unit) Forecast, by Application 2020 & 2033
- Table 57: Mexico Fiber Optic Test Equipment Industry Revenue (Million) Forecast, by Application 2020 & 2033
- Table 58: Mexico Fiber Optic Test Equipment Industry Volume (K Unit) Forecast, by Application 2020 & 2033
- Table 59: Global Fiber Optic Test Equipment Industry Revenue Million Forecast, by Equipment Type 2020 & 2033
- Table 60: Global Fiber Optic Test Equipment Industry Volume K Unit Forecast, by Equipment Type 2020 & 2033
- Table 61: Global Fiber Optic Test Equipment Industry Revenue Million Forecast, by End-user Application 2020 & 2033
- Table 62: Global Fiber Optic Test Equipment Industry Volume K Unit Forecast, by End-user Application 2020 & 2033
- Table 63: Global Fiber Optic Test Equipment Industry Revenue Million Forecast, by Country 2020 & 2033
- Table 64: Global Fiber Optic Test Equipment Industry Volume K Unit Forecast, by Country 2020 & 2033
- Table 65: United Arab Emirates Fiber Optic Test Equipment Industry Revenue (Million) Forecast, by Application 2020 & 2033
- Table 66: United Arab Emirates Fiber Optic Test Equipment Industry Volume (K Unit) Forecast, by Application 2020 & 2033
- Table 67: South Africa Fiber Optic Test Equipment Industry Revenue (Million) Forecast, by Application 2020 & 2033
- Table 68: South Africa Fiber Optic Test Equipment Industry Volume (K Unit) Forecast, by Application 2020 & 2033
Frequently Asked Questions
1. What is the projected Compound Annual Growth Rate (CAGR) of the Fiber Optic Test Equipment Industry?
The projected CAGR is approximately 6.50%.
2. Which companies are prominent players in the Fiber Optic Test Equipment Industry?
Key companies in the market include Kingfisher International, Terahertz Technologies Inc (Trends Networks), Anritsu Corporation, VIAVI Solutions Inc, AFL Global, Pelorus Technologies Pvt Ltd, EXFO Inc, Yokogawa Electric Corporation, AMS Technologies A, Deviser Instruments, Fluke Networks, VeEX Inc.
3. What are the main segments of the Fiber Optic Test Equipment Industry?
The market segments include Equipment Type, End-user Application.
4. Can you provide details about the market size?
The market size is estimated to be USD 1.10 Million as of 2022.
5. What are some drivers contributing to market growth?
Increasing Penetration of 5G/LTE Networks and Fixed Broadband Subscription; Growing Adoption of fiber optic networks for power and utility management. Security. and Communication.
6. What are the notable trends driving market growth?
Telecommunications to Witness Significant Growth.
7. Are there any restraints impacting market growth?
High Cost of Testers and Fiber Optic Test Equipment; Lack of Awareness and Technical Knowledge.
8. Can you provide examples of recent developments in the market?
March 2024 - VeEX Inc. unveiled the RXT- 6800 Advanced 800G Multiservice test module. Based on the RXT-6400400G high-speed test module, the RXT6800 provides the flexibility to test existing interfaces up to a maximum of 800G. This new module is the industry's smallest, most versatile, and most portable 800G field test solution.
9. What pricing options are available for accessing the report?
Pricing options include single-user, multi-user, and enterprise licenses priced at USD 4750, USD 5250, and USD 8750 respectively.
10. Is the market size provided in terms of value or volume?
The market size is provided in terms of value, measured in Million and volume, measured in K Unit.
11. Are there any specific market keywords associated with the report?
Yes, the market keyword associated with the report is "Fiber Optic Test Equipment Industry," which aids in identifying and referencing the specific market segment covered.
12. How do I determine which pricing option suits my needs best?
The pricing options vary based on user requirements and access needs. Individual users may opt for single-user licenses, while businesses requiring broader access may choose multi-user or enterprise licenses for cost-effective access to the report.
13. Are there any additional resources or data provided in the Fiber Optic Test Equipment Industry report?
While the report offers comprehensive insights, it's advisable to review the specific contents or supplementary materials provided to ascertain if additional resources or data are available.
14. How can I stay updated on further developments or reports in the Fiber Optic Test Equipment Industry?
To stay informed about further developments, trends, and reports in the Fiber Optic Test Equipment Industry, consider subscribing to industry newsletters, following relevant companies and organizations, or regularly checking reputable industry news sources and publications.
Methodology
Step 1 - Identification of Relevant Samples Size from Population Database


Step 2 - Approaches for Defining Global Market Size (Value, Volume* & Price*)

Note*: In applicable scenarios
Step 3 - Data Sources
Primary Research
- Web Analytics
- Survey Reports
- Research Institute
- Latest Research Reports
- Opinion Leaders
Secondary Research
- Annual Reports
- White Paper
- Latest Press Release
- Industry Association
- Paid Database
- Investor Presentations

Step 4 - Data Triangulation
Involves using different sources of information in order to increase the validity of a study
These sources are likely to be stakeholders in a program - participants, other researchers, program staff, other community members, and so on.
Then we put all data in single framework & apply various statistical tools to find out the dynamic on the market.
During the analysis stage, feedback from the stakeholder groups would be compared to determine areas of agreement as well as areas of divergence