

Key Insights
The Software-Defined Wide Area Network (SD-WAN) market is poised for substantial expansion, driven by the imperative for secure, agile, and reliable connectivity across distributed enterprises. With a projected Compound Annual Growth Rate (CAGR) of 31.9%, the market is estimated to reach 10.26 billion by 2025, up from its 2023 valuation. Key growth catalysts include the escalating adoption of cloud-based applications, the demand for enhanced network agility and scalability, and the critical need for robust security measures against evolving cyber threats. Organizations across healthcare, finance, and retail are increasingly leveraging SD-WAN to optimize network performance, reduce operational expenditures, and elevate overall business efficiency. The proliferation of hybrid and cloud deployment models further stimulates market growth, as businesses seek flexible and cost-effective network management solutions. While implementation complexity and the requirement for skilled IT professionals present potential challenges, the overall market trajectory remains highly optimistic. Market segmentation by organization size, end-user industry, deployment mode, and component type reveals diverse opportunities, with large enterprises currently leading adoption, and Small and Medium-sized Enterprises (SMEs) demonstrating significant growth potential as cloud adoption accelerates.
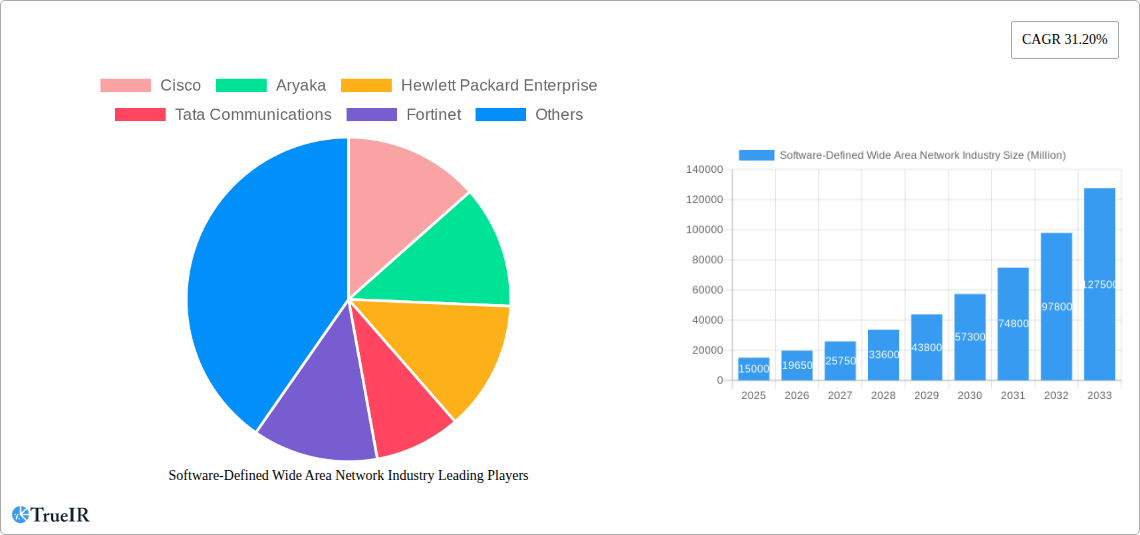
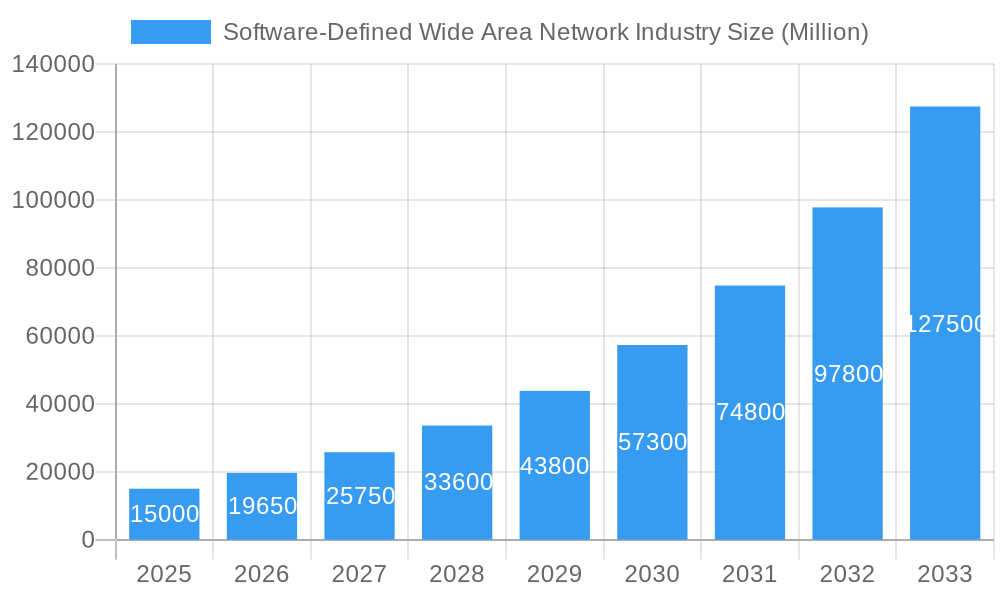
Software-Defined Wide Area Network Industry Market Size (In Billion)
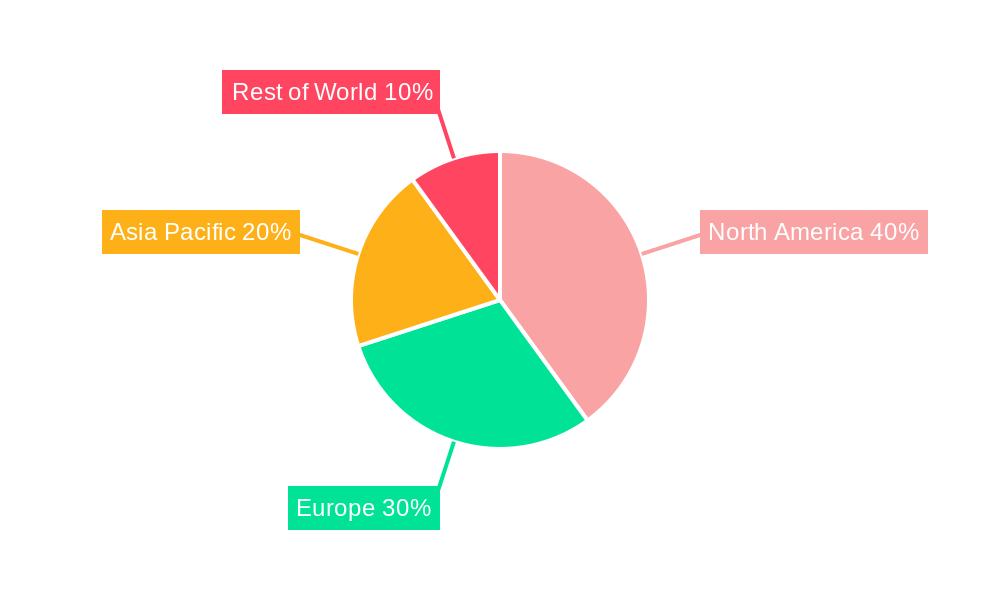
The competitive arena is characterized by a dynamic interplay between established industry leaders and innovative emerging players. Key vendors are driving market evolution through continuous innovation and strategic alliances. Geographically, North America currently leads the market, fueled by advanced technological adoption and a strong enterprise presence. However, the Asia-Pacific region is anticipated to experience remarkable growth, propelled by rapid digital transformation initiatives and escalating investments in IT infrastructure across developing economies. The ongoing expansion of 5G networks will further amplify SD-WAN capabilities, extending its market reach, particularly in regions undergoing infrastructure development. The long-term outlook for the SD-WAN market is exceptionally promising, underpinned by sustained technological advancements and the persistent demand for efficient and secure network connectivity in an increasingly digitalized global landscape.
Software-Defined Wide Area Network Industry Company Market Share
Software-Defined Wide Area Network (SD-WAN) Industry Report: 2019-2033
This comprehensive report provides a detailed analysis of the Software-Defined Wide Area Network (SD-WAN) industry, offering invaluable insights for businesses, investors, and stakeholders. With a study period spanning 2019-2033, a base year of 2025, and a forecast period of 2025-2033, this report leverages extensive market research to paint a clear picture of current market dynamics and future growth projections. The report covers key market segments, leading players like Cisco, Aryaka, and Fortinet, and significant industry milestones, providing a complete overview of this rapidly evolving technology landscape. Expect detailed analysis of market size (reaching xx Million by 2033), CAGR, and market penetration rates across various segments.
Software-Defined Wide Area Network Industry Market Structure & Competitive Landscape
The SD-WAN market exhibits a moderately concentrated structure, with a few major players commanding significant market share. The Herfindahl-Hirschman Index (HHI) for the market in 2024 is estimated at xx, indicating a moderately competitive landscape. Key innovation drivers include advancements in cloud computing, 5G technology, and Artificial Intelligence (AI). Regulatory changes impacting data privacy and cybersecurity significantly influence market dynamics. Product substitutes, such as traditional MPLS networks, continue to compete, albeit with diminishing market share.
The market is segmented by organization size (Large Enterprises, Small-Medium Enterprises), end-user industry (Healthcare, Banking and Financial Services, Retail and Consumer Services, Manufacturing, Transport and Logistics, IT and Telecom, Other End-user Industries), deployment mode (Premise, Cloud, Hybrid), and component type (Solutions, Services). M&A activity has been moderate, with approximately xx deals recorded between 2019 and 2024, primarily focused on expanding service portfolios and geographical reach. Key players frequently invest in R&D to maintain competitive advantages, focusing on improved security features, enhanced scalability, and AI-powered network management tools.
Software-Defined Wide Area Network Industry Market Trends & Opportunities
The SD-WAN market is experiencing robust growth, driven by increasing adoption of cloud-based applications, the need for improved network security, and the rising demand for flexible and scalable networking solutions across various industries. The market size is projected to reach xx Million by 2033, exhibiting a CAGR of xx% during the forecast period (2025-2033). This growth is fueled by several key trends:
- Cloud Adoption: The widespread migration to cloud-based applications and services is a primary catalyst, driving demand for SD-WAN solutions to seamlessly connect branch offices and remote users to cloud resources.
- Enhanced Security: SD-WAN offers improved security features, such as integrated firewalls and encryption, protecting sensitive data against cyber threats. This is critical as companies increasingly rely on distributed networks.
- Digital Transformation: Businesses across diverse sectors are undergoing digital transformations, requiring agile and adaptable network infrastructure, which SD-WAN readily provides.
- Cost Optimization: SD-WAN solutions often result in reduced operational expenses compared to traditional MPLS networks, further accelerating adoption.
- 5G Integration: The rollout of 5G networks presents significant opportunities for SD-WAN providers to leverage high-speed connectivity and enhance network performance.
The market penetration rate is expected to reach xx% by 2033, with substantial growth potential across various end-user industries and deployment modes. Competitive dynamics are characterized by ongoing product innovation, strategic partnerships, and mergers and acquisitions, leading to a dynamic and evolving market landscape.
Dominant Markets & Segments in Software-Defined Wide Area Network Industry
The North American region is currently the dominant market for SD-WAN, driven by high technological adoption rates and significant investments in digital infrastructure. Within the segment breakdown, several trends stand out:
- By Organization Size: Large enterprises currently represent the largest segment due to their greater IT budgets and complex networking needs. However, Small-Medium Enterprises (SMEs) are demonstrating strong growth, driven by affordability and ease of deployment of SD-WAN solutions.
- By End-user Industry: The Banking and Financial Services sector and Healthcare are major adopters due to their high reliance on secure and reliable networks to handle sensitive data and critical operations. The Retail and Consumer Services sector is also experiencing significant growth due to increased e-commerce and omni-channel strategies.
Key Growth Drivers:
- Robust IT infrastructure investments: Strong investments in IT infrastructure across various regions continue to fuel demand.
- Government initiatives and policies: Supportive government policies promoting digital transformation and network modernization are further driving market growth.
- Increased security concerns: The growing awareness of cybersecurity risks is propelling the adoption of secure SD-WAN solutions.
Software-Defined Wide Area Network Industry Product Analysis
SD-WAN solutions offer a wide range of features, including advanced routing protocols, centralized network management, and integrated security capabilities. Key advancements include AI-driven network optimization, automation capabilities, and seamless integration with cloud platforms. The market is witnessing increasing demand for solutions offering superior security, scalability, and simplified management. The focus is on delivering flexible and cost-effective solutions tailored to specific business needs, aligning technology with business objectives. This adaptability, coupled with security enhancements, ensures strong market fit.
Key Drivers, Barriers & Challenges in Software-Defined Wide Area Network Industry
Key Drivers: The SD-WAN market is propelled by the need for secure, agile, and cost-effective networking solutions, driven by the growth of cloud computing, the rise of IoT devices, and the increasing reliance on remote workers. Technological advancements such as AI and automation play crucial roles, allowing for efficient network management and optimization. Government initiatives to improve digital infrastructure further contribute to market growth.
Challenges: Competition among established players and new entrants creates intense market pressure. Supply chain disruptions can lead to increased costs and delays in deployment. Complex regulatory environments and data privacy concerns pose significant barriers, while the skills gap in managing and implementing SD-WAN technology remains a challenge. These factors collectively could impact adoption rates and market growth, though innovation and market consolidation continue to mitigate some of these challenges.
Growth Drivers in the Software-Defined Wide Area Network Industry Market
The growth of cloud-based applications, the need for enhanced network security, and the rising demand for flexible and cost-effective networking solutions are prominent drivers. Advancements in AI and 5G technology offer significant opportunities for enhancing SD-WAN capabilities. Government initiatives to foster digital transformation further contribute to market expansion.
Challenges Impacting Software-Defined Wide Area Network Industry Growth
Competition, supply chain constraints, and regulatory complexity significantly impact growth. The skills gap in SD-WAN management presents a hurdle to adoption. Security concerns remain a key factor influencing decision-making. These challenges could slow market growth if not adequately addressed.
Key Players Shaping the Software-Defined Wide Area Network Industry Market
Significant Software-Defined Wide Area Network Industry Milestones
- Sept 2022: Fortinet announced the industry's first AI-based network operations management for 5G/LTE gateways, enhancing network visibility and efficiency.
- Sept 2022: Hughes Communication India launched India's first high-throughput satellite (HTS) service, expanding broadband access and connecting remote areas, creating potential new markets for SD-WAN.
- Dec 2022: Five MSSPs (B.Online, Cirion, ngena, PT&T, and Telefónica) adopted Fortinet Secure SD-WAN, expanding the reach and adoption of secure SD-WAN solutions.
Future Outlook for Software-Defined Wide Area Network Industry Market
The SD-WAN market is poised for continued growth, driven by ongoing technological advancements, increasing cloud adoption, and the expanding need for secure and flexible networking solutions. Strategic partnerships, further innovation in AI and 5G integration, and expansion into new markets will shape future market dynamics. The market holds substantial potential for growth across various industries and regions.
Software-Defined Wide Area Network Industry Segmentation
-
1. Deployment Mode
- 1.1. Premise
- 1.2. Cloud
- 1.3. Hybrid
-
2. Component Type
- 2.1. Solutions
- 2.2. Services
-
3. Organisation Size
- 3.1. Large Enterprises
- 3.2. Small-Medium Enterprises
-
4. End-user Industry
- 4.1. Healthcare
- 4.2. Banking and Financial Services
- 4.3. Retail and Consumer Services
- 4.4. Manufacturing
- 4.5. Transport and Logistics
- 4.6. IT and Telecom
- 4.7. Other End-user Industries
Software-Defined Wide Area Network Industry Segmentation By Geography
-
1. North America
- 1.1. United States
- 1.2. Canada
- 1.3. Mexico
- 1.4. Rest of North America
-
2. Europe
- 2.1. United Kingdom
- 2.2. France
- 2.3. Germany
- 2.4. Rest of Europe
-
3. Asia Pacific
- 3.1. China
- 3.2. India
- 3.3. Japan
- 3.4. Australia
- 3.5. South Korea
- 3.6. Rest of Asia Pacific
-
4. Latin America
- 4.1. Brazil
- 4.2. Mexico
- 4.3. Rest of Latin America
-
5. MEA
- 5.1. UAE
- 5.2. South Africa
- 5.3. Saudi Arabia
- 5.4. Rest Of MEA
Software-Defined Wide Area Network Industry Regional Market Share
Geographic Coverage of Software-Defined Wide Area Network Industry
Software-Defined Wide Area Network Industry REPORT HIGHLIGHTS
| Aspects | Details |
|---|---|
| Study Period | 2020-2034 |
| Base Year | 2025 |
| Estimated Year | 2026 |
| Forecast Period | 2026-2034 |
| Historical Period | 2020-2025 |
| Growth Rate | CAGR of 31.9% from 2020-2034 |
| Segmentation |
|
Table of Contents
- 1. Introduction
- 1.1. Research Scope
- 1.2. Market Segmentation
- 1.3. Research Objective
- 1.4. Definitions and Assumptions
- 2. Executive Summary
- 2.1. Market Snapshot
- 3. Market Dynamics
- 3.1. Market Drivers
- 3.2. Market Restrains
- 3.3. Market Trends
- 3.4. Market Opportunities
- 4. Market Factor Analysis
- 4.1. Porters Five Forces
- 4.1.1. Bargaining Power of Suppliers
- 4.1.2. Bargaining Power of Buyers
- 4.1.3. Threat of New Entrants
- 4.1.4. Threat of Substitutes
- 4.1.5. Competitive Rivalry
- 4.2. PESTEL analysis
- 4.3. BCG Analysis
- 4.3.1. Stars (High Growth, High Market Share)
- 4.3.2. Cash Cows (Low Growth, High Market Share)
- 4.3.3. Question Mark (High Growth, Low Market Share)
- 4.3.4. Dogs (Low Growth, Low Market Share)
- 4.4. Ansoff Matrix Analysis
- 4.5. Supply Chain Analysis
- 4.6. Regulatory Landscape
- 4.7. Current Market Potential and Opportunity Assessment (TAM–SAM–SOM Framework)
- 4.8. TIR Analyst Note
- 4.1. Porters Five Forces
- 5. Market Analysis, Insights and Forecast 2021-2033
- 5.1. Market Analysis, Insights and Forecast - by Deployment Mode
- 5.1.1. Premise
- 5.1.2. Cloud
- 5.1.3. Hybrid
- 5.2. Market Analysis, Insights and Forecast - by Component Type
- 5.2.1. Solutions
- 5.2.2. Services
- 5.3. Market Analysis, Insights and Forecast - by Organisation Size
- 5.3.1. Large Enterprises
- 5.3.2. Small-Medium Enterprises
- 5.4. Market Analysis, Insights and Forecast - by End-user Industry
- 5.4.1. Healthcare
- 5.4.2. Banking and Financial Services
- 5.4.3. Retail and Consumer Services
- 5.4.4. Manufacturing
- 5.4.5. Transport and Logistics
- 5.4.6. IT and Telecom
- 5.4.7. Other End-user Industries
- 5.5. Market Analysis, Insights and Forecast - by Region
- 5.5.1. North America
- 5.5.2. Europe
- 5.5.3. Asia Pacific
- 5.5.4. Latin America
- 5.5.5. MEA
- 5.1. Market Analysis, Insights and Forecast - by Deployment Mode
- 6. Global Software-Defined Wide Area Network Industry Analysis, Insights and Forecast, 2021-2033
- 6.1. Market Analysis, Insights and Forecast - by Deployment Mode
- 6.1.1. Premise
- 6.1.2. Cloud
- 6.1.3. Hybrid
- 6.2. Market Analysis, Insights and Forecast - by Component Type
- 6.2.1. Solutions
- 6.2.2. Services
- 6.3. Market Analysis, Insights and Forecast - by Organisation Size
- 6.3.1. Large Enterprises
- 6.3.2. Small-Medium Enterprises
- 6.4. Market Analysis, Insights and Forecast - by End-user Industry
- 6.4.1. Healthcare
- 6.4.2. Banking and Financial Services
- 6.4.3. Retail and Consumer Services
- 6.4.4. Manufacturing
- 6.4.5. Transport and Logistics
- 6.4.6. IT and Telecom
- 6.4.7. Other End-user Industries
- 6.1. Market Analysis, Insights and Forecast - by Deployment Mode
- 7. North America Software-Defined Wide Area Network Industry Analysis, Insights and Forecast, 2020-2032
- 7.1. Market Analysis, Insights and Forecast - by Deployment Mode
- 7.1.1. Premise
- 7.1.2. Cloud
- 7.1.3. Hybrid
- 7.2. Market Analysis, Insights and Forecast - by Component Type
- 7.2.1. Solutions
- 7.2.2. Services
- 7.3. Market Analysis, Insights and Forecast - by Organisation Size
- 7.3.1. Large Enterprises
- 7.3.2. Small-Medium Enterprises
- 7.4. Market Analysis, Insights and Forecast - by End-user Industry
- 7.4.1. Healthcare
- 7.4.2. Banking and Financial Services
- 7.4.3. Retail and Consumer Services
- 7.4.4. Manufacturing
- 7.4.5. Transport and Logistics
- 7.4.6. IT and Telecom
- 7.4.7. Other End-user Industries
- 7.1. Market Analysis, Insights and Forecast - by Deployment Mode
- 8. Europe Software-Defined Wide Area Network Industry Analysis, Insights and Forecast, 2020-2032
- 8.1. Market Analysis, Insights and Forecast - by Deployment Mode
- 8.1.1. Premise
- 8.1.2. Cloud
- 8.1.3. Hybrid
- 8.2. Market Analysis, Insights and Forecast - by Component Type
- 8.2.1. Solutions
- 8.2.2. Services
- 8.3. Market Analysis, Insights and Forecast - by Organisation Size
- 8.3.1. Large Enterprises
- 8.3.2. Small-Medium Enterprises
- 8.4. Market Analysis, Insights and Forecast - by End-user Industry
- 8.4.1. Healthcare
- 8.4.2. Banking and Financial Services
- 8.4.3. Retail and Consumer Services
- 8.4.4. Manufacturing
- 8.4.5. Transport and Logistics
- 8.4.6. IT and Telecom
- 8.4.7. Other End-user Industries
- 8.1. Market Analysis, Insights and Forecast - by Deployment Mode
- 9. Asia Pacific Software-Defined Wide Area Network Industry Analysis, Insights and Forecast, 2020-2032
- 9.1. Market Analysis, Insights and Forecast - by Deployment Mode
- 9.1.1. Premise
- 9.1.2. Cloud
- 9.1.3. Hybrid
- 9.2. Market Analysis, Insights and Forecast - by Component Type
- 9.2.1. Solutions
- 9.2.2. Services
- 9.3. Market Analysis, Insights and Forecast - by Organisation Size
- 9.3.1. Large Enterprises
- 9.3.2. Small-Medium Enterprises
- 9.4. Market Analysis, Insights and Forecast - by End-user Industry
- 9.4.1. Healthcare
- 9.4.2. Banking and Financial Services
- 9.4.3. Retail and Consumer Services
- 9.4.4. Manufacturing
- 9.4.5. Transport and Logistics
- 9.4.6. IT and Telecom
- 9.4.7. Other End-user Industries
- 9.1. Market Analysis, Insights and Forecast - by Deployment Mode
- 10. Latin America Software-Defined Wide Area Network Industry Analysis, Insights and Forecast, 2020-2032
- 10.1. Market Analysis, Insights and Forecast - by Deployment Mode
- 10.1.1. Premise
- 10.1.2. Cloud
- 10.1.3. Hybrid
- 10.2. Market Analysis, Insights and Forecast - by Component Type
- 10.2.1. Solutions
- 10.2.2. Services
- 10.3. Market Analysis, Insights and Forecast - by Organisation Size
- 10.3.1. Large Enterprises
- 10.3.2. Small-Medium Enterprises
- 10.4. Market Analysis, Insights and Forecast - by End-user Industry
- 10.4.1. Healthcare
- 10.4.2. Banking and Financial Services
- 10.4.3. Retail and Consumer Services
- 10.4.4. Manufacturing
- 10.4.5. Transport and Logistics
- 10.4.6. IT and Telecom
- 10.4.7. Other End-user Industries
- 10.1. Market Analysis, Insights and Forecast - by Deployment Mode
- 11. MEA Software-Defined Wide Area Network Industry Analysis, Insights and Forecast, 2020-2032
- 11.1. Market Analysis, Insights and Forecast - by Deployment Mode
- 11.1.1. Premise
- 11.1.2. Cloud
- 11.1.3. Hybrid
- 11.2. Market Analysis, Insights and Forecast - by Component Type
- 11.2.1. Solutions
- 11.2.2. Services
- 11.3. Market Analysis, Insights and Forecast - by Organisation Size
- 11.3.1. Large Enterprises
- 11.3.2. Small-Medium Enterprises
- 11.4. Market Analysis, Insights and Forecast - by End-user Industry
- 11.4.1. Healthcare
- 11.4.2. Banking and Financial Services
- 11.4.3. Retail and Consumer Services
- 11.4.4. Manufacturing
- 11.4.5. Transport and Logistics
- 11.4.6. IT and Telecom
- 11.4.7. Other End-user Industries
- 11.1. Market Analysis, Insights and Forecast - by Deployment Mode
- 12. Competitive Analysis
- 12.1. Company Profiles
- 12.1.1 Cisco
- 12.1.1.1. Company Overview
- 12.1.1.2. Products
- 12.1.1.3. Company Financials
- 12.1.1.4. SWOT Analysis
- 12.1.2 Aryaka
- 12.1.2.1. Company Overview
- 12.1.2.2. Products
- 12.1.2.3. Company Financials
- 12.1.2.4. SWOT Analysis
- 12.1.3 Hewlett Packard Enterprise
- 12.1.3.1. Company Overview
- 12.1.3.2. Products
- 12.1.3.3. Company Financials
- 12.1.3.4. SWOT Analysis
- 12.1.4 Tata Communications
- 12.1.4.1. Company Overview
- 12.1.4.2. Products
- 12.1.4.3. Company Financials
- 12.1.4.4. SWOT Analysis
- 12.1.5 Fortinet
- 12.1.5.1. Company Overview
- 12.1.5.2. Products
- 12.1.5.3. Company Financials
- 12.1.5.4. SWOT Analysis
- 12.1.6 Huawei
- 12.1.6.1. Company Overview
- 12.1.6.2. Products
- 12.1.6.3. Company Financials
- 12.1.6.4. SWOT Analysis
- 12.1.7 Ericsson
- 12.1.7.1. Company Overview
- 12.1.7.2. Products
- 12.1.7.3. Company Financials
- 12.1.7.4. SWOT Analysis
- 12.1.8 vmware
- 12.1.8.1. Company Overview
- 12.1.8.2. Products
- 12.1.8.3. Company Financials
- 12.1.8.4. SWOT Analysis
- 12.1.9 Nokia
- 12.1.9.1. Company Overview
- 12.1.9.2. Products
- 12.1.9.3. Company Financials
- 12.1.9.4. SWOT Analysis
- 12.1.10 MCM Telecom
- 12.1.10.1. Company Overview
- 12.1.10.2. Products
- 12.1.10.3. Company Financials
- 12.1.10.4. SWOT Analysis
- 12.1.1 Cisco
- 12.2. Market Entropy
- 12.2.1 Company's Key Areas Served
- 12.2.2 Recent Developments
- 12.3. Company Market Share Analysis 2025
- 12.3.1 Top 5 Companies Market Share Analysis
- 12.3.2 Top 3 Companies Market Share Analysis
- 12.4. List of Potential Customers
- 13. Research Methodology
List of Figures
- Figure 1: Global Software-Defined Wide Area Network Industry Revenue Breakdown (billion, %) by Region 2025 & 2033
- Figure 2: Global Software-Defined Wide Area Network Industry Volume Breakdown (K Unit, %) by Region 2025 & 2033
- Figure 3: North America Software-Defined Wide Area Network Industry Revenue (billion), by Deployment Mode 2025 & 2033
- Figure 4: North America Software-Defined Wide Area Network Industry Volume (K Unit), by Deployment Mode 2025 & 2033
- Figure 5: North America Software-Defined Wide Area Network Industry Revenue Share (%), by Deployment Mode 2025 & 2033
- Figure 6: North America Software-Defined Wide Area Network Industry Volume Share (%), by Deployment Mode 2025 & 2033
- Figure 7: North America Software-Defined Wide Area Network Industry Revenue (billion), by Component Type 2025 & 2033
- Figure 8: North America Software-Defined Wide Area Network Industry Volume (K Unit), by Component Type 2025 & 2033
- Figure 9: North America Software-Defined Wide Area Network Industry Revenue Share (%), by Component Type 2025 & 2033
- Figure 10: North America Software-Defined Wide Area Network Industry Volume Share (%), by Component Type 2025 & 2033
- Figure 11: North America Software-Defined Wide Area Network Industry Revenue (billion), by Organisation Size 2025 & 2033
- Figure 12: North America Software-Defined Wide Area Network Industry Volume (K Unit), by Organisation Size 2025 & 2033
- Figure 13: North America Software-Defined Wide Area Network Industry Revenue Share (%), by Organisation Size 2025 & 2033
- Figure 14: North America Software-Defined Wide Area Network Industry Volume Share (%), by Organisation Size 2025 & 2033
- Figure 15: North America Software-Defined Wide Area Network Industry Revenue (billion), by End-user Industry 2025 & 2033
- Figure 16: North America Software-Defined Wide Area Network Industry Volume (K Unit), by End-user Industry 2025 & 2033
- Figure 17: North America Software-Defined Wide Area Network Industry Revenue Share (%), by End-user Industry 2025 & 2033
- Figure 18: North America Software-Defined Wide Area Network Industry Volume Share (%), by End-user Industry 2025 & 2033
- Figure 19: North America Software-Defined Wide Area Network Industry Revenue (billion), by Country 2025 & 2033
- Figure 20: North America Software-Defined Wide Area Network Industry Volume (K Unit), by Country 2025 & 2033
- Figure 21: North America Software-Defined Wide Area Network Industry Revenue Share (%), by Country 2025 & 2033
- Figure 22: North America Software-Defined Wide Area Network Industry Volume Share (%), by Country 2025 & 2033
- Figure 23: Europe Software-Defined Wide Area Network Industry Revenue (billion), by Deployment Mode 2025 & 2033
- Figure 24: Europe Software-Defined Wide Area Network Industry Volume (K Unit), by Deployment Mode 2025 & 2033
- Figure 25: Europe Software-Defined Wide Area Network Industry Revenue Share (%), by Deployment Mode 2025 & 2033
- Figure 26: Europe Software-Defined Wide Area Network Industry Volume Share (%), by Deployment Mode 2025 & 2033
- Figure 27: Europe Software-Defined Wide Area Network Industry Revenue (billion), by Component Type 2025 & 2033
- Figure 28: Europe Software-Defined Wide Area Network Industry Volume (K Unit), by Component Type 2025 & 2033
- Figure 29: Europe Software-Defined Wide Area Network Industry Revenue Share (%), by Component Type 2025 & 2033
- Figure 30: Europe Software-Defined Wide Area Network Industry Volume Share (%), by Component Type 2025 & 2033
- Figure 31: Europe Software-Defined Wide Area Network Industry Revenue (billion), by Organisation Size 2025 & 2033
- Figure 32: Europe Software-Defined Wide Area Network Industry Volume (K Unit), by Organisation Size 2025 & 2033
- Figure 33: Europe Software-Defined Wide Area Network Industry Revenue Share (%), by Organisation Size 2025 & 2033
- Figure 34: Europe Software-Defined Wide Area Network Industry Volume Share (%), by Organisation Size 2025 & 2033
- Figure 35: Europe Software-Defined Wide Area Network Industry Revenue (billion), by End-user Industry 2025 & 2033
- Figure 36: Europe Software-Defined Wide Area Network Industry Volume (K Unit), by End-user Industry 2025 & 2033
- Figure 37: Europe Software-Defined Wide Area Network Industry Revenue Share (%), by End-user Industry 2025 & 2033
- Figure 38: Europe Software-Defined Wide Area Network Industry Volume Share (%), by End-user Industry 2025 & 2033
- Figure 39: Europe Software-Defined Wide Area Network Industry Revenue (billion), by Country 2025 & 2033
- Figure 40: Europe Software-Defined Wide Area Network Industry Volume (K Unit), by Country 2025 & 2033
- Figure 41: Europe Software-Defined Wide Area Network Industry Revenue Share (%), by Country 2025 & 2033
- Figure 42: Europe Software-Defined Wide Area Network Industry Volume Share (%), by Country 2025 & 2033
- Figure 43: Asia Pacific Software-Defined Wide Area Network Industry Revenue (billion), by Deployment Mode 2025 & 2033
- Figure 44: Asia Pacific Software-Defined Wide Area Network Industry Volume (K Unit), by Deployment Mode 2025 & 2033
- Figure 45: Asia Pacific Software-Defined Wide Area Network Industry Revenue Share (%), by Deployment Mode 2025 & 2033
- Figure 46: Asia Pacific Software-Defined Wide Area Network Industry Volume Share (%), by Deployment Mode 2025 & 2033
- Figure 47: Asia Pacific Software-Defined Wide Area Network Industry Revenue (billion), by Component Type 2025 & 2033
- Figure 48: Asia Pacific Software-Defined Wide Area Network Industry Volume (K Unit), by Component Type 2025 & 2033
- Figure 49: Asia Pacific Software-Defined Wide Area Network Industry Revenue Share (%), by Component Type 2025 & 2033
- Figure 50: Asia Pacific Software-Defined Wide Area Network Industry Volume Share (%), by Component Type 2025 & 2033
- Figure 51: Asia Pacific Software-Defined Wide Area Network Industry Revenue (billion), by Organisation Size 2025 & 2033
- Figure 52: Asia Pacific Software-Defined Wide Area Network Industry Volume (K Unit), by Organisation Size 2025 & 2033
- Figure 53: Asia Pacific Software-Defined Wide Area Network Industry Revenue Share (%), by Organisation Size 2025 & 2033
- Figure 54: Asia Pacific Software-Defined Wide Area Network Industry Volume Share (%), by Organisation Size 2025 & 2033
- Figure 55: Asia Pacific Software-Defined Wide Area Network Industry Revenue (billion), by End-user Industry 2025 & 2033
- Figure 56: Asia Pacific Software-Defined Wide Area Network Industry Volume (K Unit), by End-user Industry 2025 & 2033
- Figure 57: Asia Pacific Software-Defined Wide Area Network Industry Revenue Share (%), by End-user Industry 2025 & 2033
- Figure 58: Asia Pacific Software-Defined Wide Area Network Industry Volume Share (%), by End-user Industry 2025 & 2033
- Figure 59: Asia Pacific Software-Defined Wide Area Network Industry Revenue (billion), by Country 2025 & 2033
- Figure 60: Asia Pacific Software-Defined Wide Area Network Industry Volume (K Unit), by Country 2025 & 2033
- Figure 61: Asia Pacific Software-Defined Wide Area Network Industry Revenue Share (%), by Country 2025 & 2033
- Figure 62: Asia Pacific Software-Defined Wide Area Network Industry Volume Share (%), by Country 2025 & 2033
- Figure 63: Latin America Software-Defined Wide Area Network Industry Revenue (billion), by Deployment Mode 2025 & 2033
- Figure 64: Latin America Software-Defined Wide Area Network Industry Volume (K Unit), by Deployment Mode 2025 & 2033
- Figure 65: Latin America Software-Defined Wide Area Network Industry Revenue Share (%), by Deployment Mode 2025 & 2033
- Figure 66: Latin America Software-Defined Wide Area Network Industry Volume Share (%), by Deployment Mode 2025 & 2033
- Figure 67: Latin America Software-Defined Wide Area Network Industry Revenue (billion), by Component Type 2025 & 2033
- Figure 68: Latin America Software-Defined Wide Area Network Industry Volume (K Unit), by Component Type 2025 & 2033
- Figure 69: Latin America Software-Defined Wide Area Network Industry Revenue Share (%), by Component Type 2025 & 2033
- Figure 70: Latin America Software-Defined Wide Area Network Industry Volume Share (%), by Component Type 2025 & 2033
- Figure 71: Latin America Software-Defined Wide Area Network Industry Revenue (billion), by Organisation Size 2025 & 2033
- Figure 72: Latin America Software-Defined Wide Area Network Industry Volume (K Unit), by Organisation Size 2025 & 2033
- Figure 73: Latin America Software-Defined Wide Area Network Industry Revenue Share (%), by Organisation Size 2025 & 2033
- Figure 74: Latin America Software-Defined Wide Area Network Industry Volume Share (%), by Organisation Size 2025 & 2033
- Figure 75: Latin America Software-Defined Wide Area Network Industry Revenue (billion), by End-user Industry 2025 & 2033
- Figure 76: Latin America Software-Defined Wide Area Network Industry Volume (K Unit), by End-user Industry 2025 & 2033
- Figure 77: Latin America Software-Defined Wide Area Network Industry Revenue Share (%), by End-user Industry 2025 & 2033
- Figure 78: Latin America Software-Defined Wide Area Network Industry Volume Share (%), by End-user Industry 2025 & 2033
- Figure 79: Latin America Software-Defined Wide Area Network Industry Revenue (billion), by Country 2025 & 2033
- Figure 80: Latin America Software-Defined Wide Area Network Industry Volume (K Unit), by Country 2025 & 2033
- Figure 81: Latin America Software-Defined Wide Area Network Industry Revenue Share (%), by Country 2025 & 2033
- Figure 82: Latin America Software-Defined Wide Area Network Industry Volume Share (%), by Country 2025 & 2033
- Figure 83: MEA Software-Defined Wide Area Network Industry Revenue (billion), by Deployment Mode 2025 & 2033
- Figure 84: MEA Software-Defined Wide Area Network Industry Volume (K Unit), by Deployment Mode 2025 & 2033
- Figure 85: MEA Software-Defined Wide Area Network Industry Revenue Share (%), by Deployment Mode 2025 & 2033
- Figure 86: MEA Software-Defined Wide Area Network Industry Volume Share (%), by Deployment Mode 2025 & 2033
- Figure 87: MEA Software-Defined Wide Area Network Industry Revenue (billion), by Component Type 2025 & 2033
- Figure 88: MEA Software-Defined Wide Area Network Industry Volume (K Unit), by Component Type 2025 & 2033
- Figure 89: MEA Software-Defined Wide Area Network Industry Revenue Share (%), by Component Type 2025 & 2033
- Figure 90: MEA Software-Defined Wide Area Network Industry Volume Share (%), by Component Type 2025 & 2033
- Figure 91: MEA Software-Defined Wide Area Network Industry Revenue (billion), by Organisation Size 2025 & 2033
- Figure 92: MEA Software-Defined Wide Area Network Industry Volume (K Unit), by Organisation Size 2025 & 2033
- Figure 93: MEA Software-Defined Wide Area Network Industry Revenue Share (%), by Organisation Size 2025 & 2033
- Figure 94: MEA Software-Defined Wide Area Network Industry Volume Share (%), by Organisation Size 2025 & 2033
- Figure 95: MEA Software-Defined Wide Area Network Industry Revenue (billion), by End-user Industry 2025 & 2033
- Figure 96: MEA Software-Defined Wide Area Network Industry Volume (K Unit), by End-user Industry 2025 & 2033
- Figure 97: MEA Software-Defined Wide Area Network Industry Revenue Share (%), by End-user Industry 2025 & 2033
- Figure 98: MEA Software-Defined Wide Area Network Industry Volume Share (%), by End-user Industry 2025 & 2033
- Figure 99: MEA Software-Defined Wide Area Network Industry Revenue (billion), by Country 2025 & 2033
- Figure 100: MEA Software-Defined Wide Area Network Industry Volume (K Unit), by Country 2025 & 2033
- Figure 101: MEA Software-Defined Wide Area Network Industry Revenue Share (%), by Country 2025 & 2033
- Figure 102: MEA Software-Defined Wide Area Network Industry Volume Share (%), by Country 2025 & 2033
List of Tables
- Table 1: Global Software-Defined Wide Area Network Industry Revenue billion Forecast, by Deployment Mode 2020 & 2033
- Table 2: Global Software-Defined Wide Area Network Industry Volume K Unit Forecast, by Deployment Mode 2020 & 2033
- Table 3: Global Software-Defined Wide Area Network Industry Revenue billion Forecast, by Component Type 2020 & 2033
- Table 4: Global Software-Defined Wide Area Network Industry Volume K Unit Forecast, by Component Type 2020 & 2033
- Table 5: Global Software-Defined Wide Area Network Industry Revenue billion Forecast, by Organisation Size 2020 & 2033
- Table 6: Global Software-Defined Wide Area Network Industry Volume K Unit Forecast, by Organisation Size 2020 & 2033
- Table 7: Global Software-Defined Wide Area Network Industry Revenue billion Forecast, by End-user Industry 2020 & 2033
- Table 8: Global Software-Defined Wide Area Network Industry Volume K Unit Forecast, by End-user Industry 2020 & 2033
- Table 9: Global Software-Defined Wide Area Network Industry Revenue billion Forecast, by Region 2020 & 2033
- Table 10: Global Software-Defined Wide Area Network Industry Volume K Unit Forecast, by Region 2020 & 2033
- Table 11: Global Software-Defined Wide Area Network Industry Revenue billion Forecast, by Deployment Mode 2020 & 2033
- Table 12: Global Software-Defined Wide Area Network Industry Volume K Unit Forecast, by Deployment Mode 2020 & 2033
- Table 13: Global Software-Defined Wide Area Network Industry Revenue billion Forecast, by Component Type 2020 & 2033
- Table 14: Global Software-Defined Wide Area Network Industry Volume K Unit Forecast, by Component Type 2020 & 2033
- Table 15: Global Software-Defined Wide Area Network Industry Revenue billion Forecast, by Organisation Size 2020 & 2033
- Table 16: Global Software-Defined Wide Area Network Industry Volume K Unit Forecast, by Organisation Size 2020 & 2033
- Table 17: Global Software-Defined Wide Area Network Industry Revenue billion Forecast, by End-user Industry 2020 & 2033
- Table 18: Global Software-Defined Wide Area Network Industry Volume K Unit Forecast, by End-user Industry 2020 & 2033
- Table 19: Global Software-Defined Wide Area Network Industry Revenue billion Forecast, by Country 2020 & 2033
- Table 20: Global Software-Defined Wide Area Network Industry Volume K Unit Forecast, by Country 2020 & 2033
- Table 21: United States Software-Defined Wide Area Network Industry Revenue (billion) Forecast, by Application 2020 & 2033
- Table 22: United States Software-Defined Wide Area Network Industry Volume (K Unit) Forecast, by Application 2020 & 2033
- Table 23: Canada Software-Defined Wide Area Network Industry Revenue (billion) Forecast, by Application 2020 & 2033
- Table 24: Canada Software-Defined Wide Area Network Industry Volume (K Unit) Forecast, by Application 2020 & 2033
- Table 25: Mexico Software-Defined Wide Area Network Industry Revenue (billion) Forecast, by Application 2020 & 2033
- Table 26: Mexico Software-Defined Wide Area Network Industry Volume (K Unit) Forecast, by Application 2020 & 2033
- Table 27: Rest of North America Software-Defined Wide Area Network Industry Revenue (billion) Forecast, by Application 2020 & 2033
- Table 28: Rest of North America Software-Defined Wide Area Network Industry Volume (K Unit) Forecast, by Application 2020 & 2033
- Table 29: Global Software-Defined Wide Area Network Industry Revenue billion Forecast, by Deployment Mode 2020 & 2033
- Table 30: Global Software-Defined Wide Area Network Industry Volume K Unit Forecast, by Deployment Mode 2020 & 2033
- Table 31: Global Software-Defined Wide Area Network Industry Revenue billion Forecast, by Component Type 2020 & 2033
- Table 32: Global Software-Defined Wide Area Network Industry Volume K Unit Forecast, by Component Type 2020 & 2033
- Table 33: Global Software-Defined Wide Area Network Industry Revenue billion Forecast, by Organisation Size 2020 & 2033
- Table 34: Global Software-Defined Wide Area Network Industry Volume K Unit Forecast, by Organisation Size 2020 & 2033
- Table 35: Global Software-Defined Wide Area Network Industry Revenue billion Forecast, by End-user Industry 2020 & 2033
- Table 36: Global Software-Defined Wide Area Network Industry Volume K Unit Forecast, by End-user Industry 2020 & 2033
- Table 37: Global Software-Defined Wide Area Network Industry Revenue billion Forecast, by Country 2020 & 2033
- Table 38: Global Software-Defined Wide Area Network Industry Volume K Unit Forecast, by Country 2020 & 2033
- Table 39: United Kingdom Software-Defined Wide Area Network Industry Revenue (billion) Forecast, by Application 2020 & 2033
- Table 40: United Kingdom Software-Defined Wide Area Network Industry Volume (K Unit) Forecast, by Application 2020 & 2033
- Table 41: France Software-Defined Wide Area Network Industry Revenue (billion) Forecast, by Application 2020 & 2033
- Table 42: France Software-Defined Wide Area Network Industry Volume (K Unit) Forecast, by Application 2020 & 2033
- Table 43: Germany Software-Defined Wide Area Network Industry Revenue (billion) Forecast, by Application 2020 & 2033
- Table 44: Germany Software-Defined Wide Area Network Industry Volume (K Unit) Forecast, by Application 2020 & 2033
- Table 45: Rest of Europe Software-Defined Wide Area Network Industry Revenue (billion) Forecast, by Application 2020 & 2033
- Table 46: Rest of Europe Software-Defined Wide Area Network Industry Volume (K Unit) Forecast, by Application 2020 & 2033
- Table 47: Global Software-Defined Wide Area Network Industry Revenue billion Forecast, by Deployment Mode 2020 & 2033
- Table 48: Global Software-Defined Wide Area Network Industry Volume K Unit Forecast, by Deployment Mode 2020 & 2033
- Table 49: Global Software-Defined Wide Area Network Industry Revenue billion Forecast, by Component Type 2020 & 2033
- Table 50: Global Software-Defined Wide Area Network Industry Volume K Unit Forecast, by Component Type 2020 & 2033
- Table 51: Global Software-Defined Wide Area Network Industry Revenue billion Forecast, by Organisation Size 2020 & 2033
- Table 52: Global Software-Defined Wide Area Network Industry Volume K Unit Forecast, by Organisation Size 2020 & 2033
- Table 53: Global Software-Defined Wide Area Network Industry Revenue billion Forecast, by End-user Industry 2020 & 2033
- Table 54: Global Software-Defined Wide Area Network Industry Volume K Unit Forecast, by End-user Industry 2020 & 2033
- Table 55: Global Software-Defined Wide Area Network Industry Revenue billion Forecast, by Country 2020 & 2033
- Table 56: Global Software-Defined Wide Area Network Industry Volume K Unit Forecast, by Country 2020 & 2033
- Table 57: China Software-Defined Wide Area Network Industry Revenue (billion) Forecast, by Application 2020 & 2033
- Table 58: China Software-Defined Wide Area Network Industry Volume (K Unit) Forecast, by Application 2020 & 2033
- Table 59: India Software-Defined Wide Area Network Industry Revenue (billion) Forecast, by Application 2020 & 2033
- Table 60: India Software-Defined Wide Area Network Industry Volume (K Unit) Forecast, by Application 2020 & 2033
- Table 61: Japan Software-Defined Wide Area Network Industry Revenue (billion) Forecast, by Application 2020 & 2033
- Table 62: Japan Software-Defined Wide Area Network Industry Volume (K Unit) Forecast, by Application 2020 & 2033
- Table 63: Australia Software-Defined Wide Area Network Industry Revenue (billion) Forecast, by Application 2020 & 2033
- Table 64: Australia Software-Defined Wide Area Network Industry Volume (K Unit) Forecast, by Application 2020 & 2033
- Table 65: South Korea Software-Defined Wide Area Network Industry Revenue (billion) Forecast, by Application 2020 & 2033
- Table 66: South Korea Software-Defined Wide Area Network Industry Volume (K Unit) Forecast, by Application 2020 & 2033
- Table 67: Rest of Asia Pacific Software-Defined Wide Area Network Industry Revenue (billion) Forecast, by Application 2020 & 2033
- Table 68: Rest of Asia Pacific Software-Defined Wide Area Network Industry Volume (K Unit) Forecast, by Application 2020 & 2033
- Table 69: Global Software-Defined Wide Area Network Industry Revenue billion Forecast, by Deployment Mode 2020 & 2033
- Table 70: Global Software-Defined Wide Area Network Industry Volume K Unit Forecast, by Deployment Mode 2020 & 2033
- Table 71: Global Software-Defined Wide Area Network Industry Revenue billion Forecast, by Component Type 2020 & 2033
- Table 72: Global Software-Defined Wide Area Network Industry Volume K Unit Forecast, by Component Type 2020 & 2033
- Table 73: Global Software-Defined Wide Area Network Industry Revenue billion Forecast, by Organisation Size 2020 & 2033
- Table 74: Global Software-Defined Wide Area Network Industry Volume K Unit Forecast, by Organisation Size 2020 & 2033
- Table 75: Global Software-Defined Wide Area Network Industry Revenue billion Forecast, by End-user Industry 2020 & 2033
- Table 76: Global Software-Defined Wide Area Network Industry Volume K Unit Forecast, by End-user Industry 2020 & 2033
- Table 77: Global Software-Defined Wide Area Network Industry Revenue billion Forecast, by Country 2020 & 2033
- Table 78: Global Software-Defined Wide Area Network Industry Volume K Unit Forecast, by Country 2020 & 2033
- Table 79: Brazil Software-Defined Wide Area Network Industry Revenue (billion) Forecast, by Application 2020 & 2033
- Table 80: Brazil Software-Defined Wide Area Network Industry Volume (K Unit) Forecast, by Application 2020 & 2033
- Table 81: Mexico Software-Defined Wide Area Network Industry Revenue (billion) Forecast, by Application 2020 & 2033
- Table 82: Mexico Software-Defined Wide Area Network Industry Volume (K Unit) Forecast, by Application 2020 & 2033
- Table 83: Rest of Latin America Software-Defined Wide Area Network Industry Revenue (billion) Forecast, by Application 2020 & 2033
- Table 84: Rest of Latin America Software-Defined Wide Area Network Industry Volume (K Unit) Forecast, by Application 2020 & 2033
- Table 85: Global Software-Defined Wide Area Network Industry Revenue billion Forecast, by Deployment Mode 2020 & 2033
- Table 86: Global Software-Defined Wide Area Network Industry Volume K Unit Forecast, by Deployment Mode 2020 & 2033
- Table 87: Global Software-Defined Wide Area Network Industry Revenue billion Forecast, by Component Type 2020 & 2033
- Table 88: Global Software-Defined Wide Area Network Industry Volume K Unit Forecast, by Component Type 2020 & 2033
- Table 89: Global Software-Defined Wide Area Network Industry Revenue billion Forecast, by Organisation Size 2020 & 2033
- Table 90: Global Software-Defined Wide Area Network Industry Volume K Unit Forecast, by Organisation Size 2020 & 2033
- Table 91: Global Software-Defined Wide Area Network Industry Revenue billion Forecast, by End-user Industry 2020 & 2033
- Table 92: Global Software-Defined Wide Area Network Industry Volume K Unit Forecast, by End-user Industry 2020 & 2033
- Table 93: Global Software-Defined Wide Area Network Industry Revenue billion Forecast, by Country 2020 & 2033
- Table 94: Global Software-Defined Wide Area Network Industry Volume K Unit Forecast, by Country 2020 & 2033
- Table 95: UAE Software-Defined Wide Area Network Industry Revenue (billion) Forecast, by Application 2020 & 2033
- Table 96: UAE Software-Defined Wide Area Network Industry Volume (K Unit) Forecast, by Application 2020 & 2033
- Table 97: South Africa Software-Defined Wide Area Network Industry Revenue (billion) Forecast, by Application 2020 & 2033
- Table 98: South Africa Software-Defined Wide Area Network Industry Volume (K Unit) Forecast, by Application 2020 & 2033
- Table 99: Saudi Arabia Software-Defined Wide Area Network Industry Revenue (billion) Forecast, by Application 2020 & 2033
- Table 100: Saudi Arabia Software-Defined Wide Area Network Industry Volume (K Unit) Forecast, by Application 2020 & 2033
- Table 101: Rest Of MEA Software-Defined Wide Area Network Industry Revenue (billion) Forecast, by Application 2020 & 2033
- Table 102: Rest Of MEA Software-Defined Wide Area Network Industry Volume (K Unit) Forecast, by Application 2020 & 2033
Frequently Asked Questions
1. What is the projected Compound Annual Growth Rate (CAGR) of the Software-Defined Wide Area Network Industry?
The projected CAGR is approximately 31.9%.
2. Which companies are prominent players in the Software-Defined Wide Area Network Industry?
Key companies in the market include Cisco, Aryaka, Hewlett Packard Enterprise, Tata Communications, Fortinet, Huawei, Ericsson, vmware, Nokia, MCM Telecom.
3. What are the main segments of the Software-Defined Wide Area Network Industry?
The market segments include Deployment Mode, Component Type, Organisation Size, End-user Industry.
4. Can you provide details about the market size?
The market size is estimated to be USD 10.26 billion as of 2022.
5. What are some drivers contributing to market growth?
Increased Number of Cloud-based Solution; Simplified Network Solution; Growing Demand for Mobility Services.
6. What are the notable trends driving market growth?
Enterprise Sector will Add to the SD-WAN Market Growth.
7. Are there any restraints impacting market growth?
Data Security; Lack of Qualified Trainers.
8. Can you provide examples of recent developments in the market?
Dec 2022: Five new managed security service providers (MSSP), namely B.Online, Cirion, ngena, PT&T, and Telefónica, adopted Fortinet Secure SD-WAN to help drive better business outcomes and experiences for their customers. Fortinet is a global leader in broad, integrated, and automated cybersecurity solutions. Fortinet Secure SD-WAN will provide the MSSPs Secure Networks in present as well as future years.
9. What pricing options are available for accessing the report?
Pricing options include single-user, multi-user, and enterprise licenses priced at USD 4750, USD 5250, and USD 8750 respectively.
10. Is the market size provided in terms of value or volume?
The market size is provided in terms of value, measured in billion and volume, measured in K Unit.
11. Are there any specific market keywords associated with the report?
Yes, the market keyword associated with the report is "Software-Defined Wide Area Network Industry," which aids in identifying and referencing the specific market segment covered.
12. How do I determine which pricing option suits my needs best?
The pricing options vary based on user requirements and access needs. Individual users may opt for single-user licenses, while businesses requiring broader access may choose multi-user or enterprise licenses for cost-effective access to the report.
13. Are there any additional resources or data provided in the Software-Defined Wide Area Network Industry report?
While the report offers comprehensive insights, it's advisable to review the specific contents or supplementary materials provided to ascertain if additional resources or data are available.
14. How can I stay updated on further developments or reports in the Software-Defined Wide Area Network Industry?
To stay informed about further developments, trends, and reports in the Software-Defined Wide Area Network Industry, consider subscribing to industry newsletters, following relevant companies and organizations, or regularly checking reputable industry news sources and publications.
Methodology
Step 1 - Identification of Relevant Samples Size from Population Database


Step 2 - Approaches for Defining Global Market Size (Value, Volume* & Price*)

Note*: In applicable scenarios
Step 3 - Data Sources
Primary Research
- Web Analytics
- Survey Reports
- Research Institute
- Latest Research Reports
- Opinion Leaders
Secondary Research
- Annual Reports
- White Paper
- Latest Press Release
- Industry Association
- Paid Database
- Investor Presentations

Step 4 - Data Triangulation
Involves using different sources of information in order to increase the validity of a study
These sources are likely to be stakeholders in a program - participants, other researchers, program staff, other community members, and so on.
Then we put all data in single framework & apply various statistical tools to find out the dynamic on the market.
During the analysis stage, feedback from the stakeholder groups would be compared to determine areas of agreement as well as areas of divergence