

Key Insights
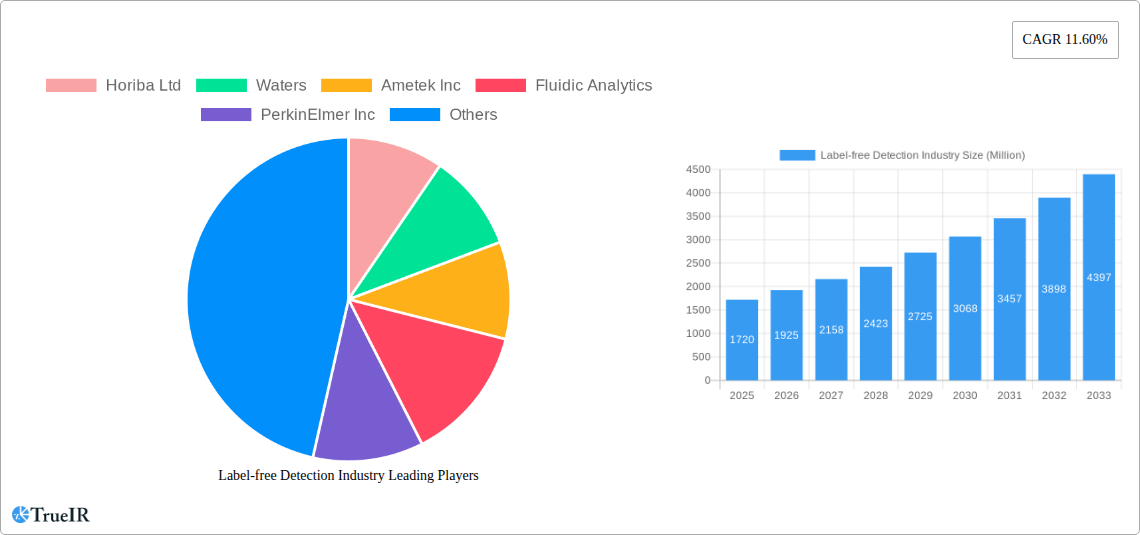
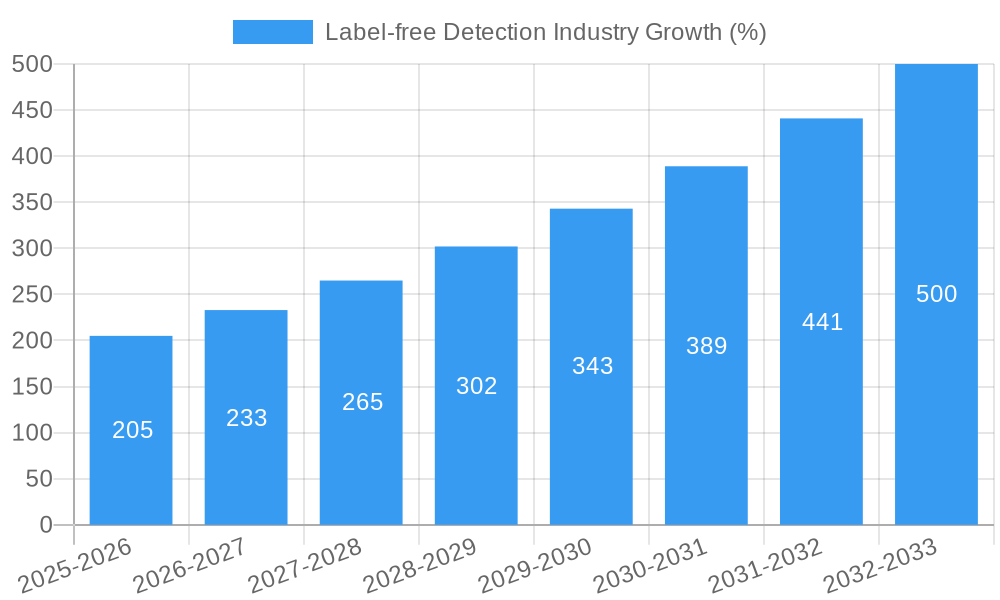
The label-free detection market, valued at $1.72 billion in 2025, is projected to experience robust growth, exhibiting a compound annual growth rate (CAGR) of 11.60% from 2025 to 2033. This expansion is driven by several key factors. The increasing demand for high-throughput screening in drug discovery and development within the pharmaceutical and biotechnology sectors is a significant catalyst. Advances in technologies like surface plasmon resonance (SPR), bio-layer interferometry (BLI), and mass spectrometry (MS) are enabling more sensitive and efficient detection methods, further fueling market growth. The rising prevalence of chronic diseases globally necessitates accelerated drug development, creating a strong need for label-free detection technologies that expedite the process. Furthermore, the growing adoption of label-free techniques in academic and research institutions, coupled with the outsourcing of research activities to contract research organizations (CROs), contributes significantly to market expansion. Specific applications like binding kinetics and thermodynamics analyses, endogenous receptor detection, hit confirmation, and lead generation are major drivers within specific segments.
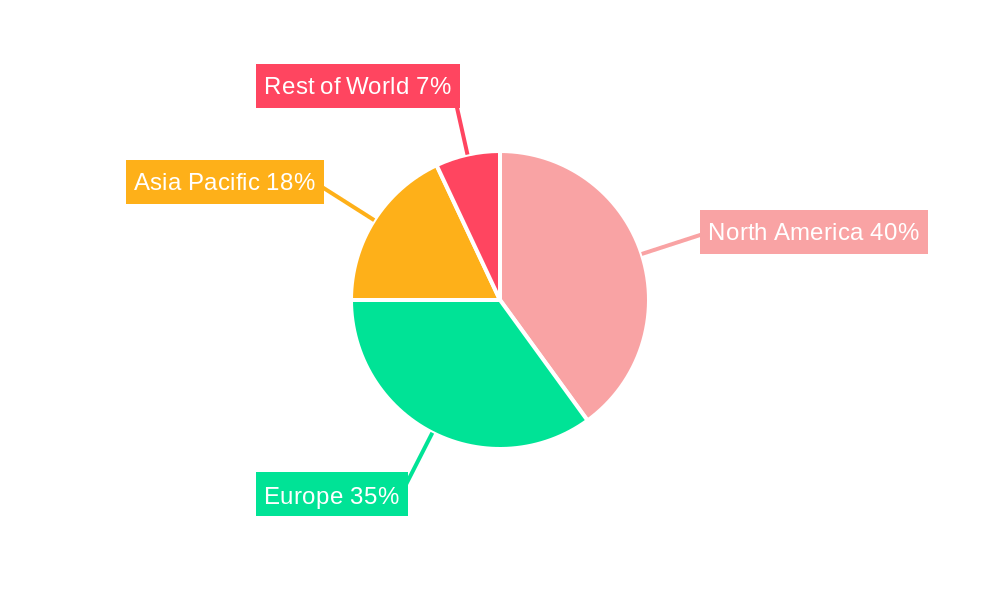
The market segmentation reveals a diverse landscape. Consumables, including microplates and reagents, constitute a substantial portion of the market, closely followed by instruments. The technological landscape is dominated by established techniques like SPR, BLI, and MS, but emerging technologies are poised for growth, potentially disrupting the market in the long term. While geographic distribution varies, North America and Europe currently hold significant market share, benefiting from a high concentration of pharmaceutical companies and well-established research infrastructure. However, the Asia-Pacific region, particularly China and India, is expected to witness the fastest growth in the coming years, fueled by increasing investments in healthcare infrastructure and research & development initiatives. Competition is intense, with established players like Thermo Fisher Scientific, Danaher Corporation (Cytiva), and others vying for market dominance alongside emerging companies specializing in innovative technologies.
Label-Free Detection Industry Market Report: 2019-2033
This comprehensive report provides a detailed analysis of the Label-Free Detection (LFD) industry, covering market size, segmentation, competitive landscape, technological advancements, and future growth prospects from 2019 to 2033. The study period spans 2019-2033, with 2025 as the base and estimated year. The forecast period is 2025-2033, and the historical period covers 2019-2024. The report includes valuable insights for stakeholders across the pharmaceutical & biotechnology, academic & research, and contract research organizations sectors. This analysis forecasts a multi-million dollar market opportunity with significant growth potential.
Label-free Detection Industry Market Structure & Competitive Landscape
The Label-Free Detection industry is characterized by a moderately concentrated market structure with several major players holding significant market share. The Herfindahl-Hirschman Index (HHI) is estimated at xx, indicating a moderately consolidated market. Key players like Thermo Fisher Scientific, Horiba Ltd, Waters, and PerkinElmer Inc. drive innovation through continuous product development and strategic acquisitions. The industry experiences significant regulatory influence, primarily from agencies like the FDA (for pharmaceutical applications), impacting product approvals and market access. Substitutes for LFD technologies include traditional ELISA and other antibody-based methods, but the unique advantages of LFD in terms of speed, sensitivity, and reduced cost are driving market penetration.
Market Segmentation: The end-user segment is primarily divided into pharmaceutical & biotechnology companies (accounting for xx Million in 2025), academic & research institutes (xx Million), and contract research organizations (xx Million). This segmentation significantly influences market growth due to varying demands and budgetary constraints.
M&A Trends: The industry has witnessed an increase in mergers and acquisitions (M&A) activity in recent years, with xx number of deals recorded between 2019 and 2024, totaling an estimated value of xx Million. These M&A activities aim to expand product portfolios, enhance technological capabilities, and consolidate market share.
Label-free Detection Industry Market Trends & Opportunities
The Label-Free Detection market exhibits robust growth, with a Compound Annual Growth Rate (CAGR) projected at xx% during the forecast period (2025-2033). This growth is driven by several factors, including increasing demand for high-throughput screening in drug discovery, advancements in LFD technologies, rising research funding in academia and industry, and the growing adoption of personalized medicine. The market size is projected to reach xx Million by 2033. Market penetration rates are highest in the pharmaceutical and biotechnology sector, followed by academic research. Technological advancements such as miniaturization, automation, and improved data analysis capabilities are enhancing the efficiency and accuracy of LFD systems, furthering market expansion. Consumer preferences are shifting towards label-free methods due to their speed, cost-effectiveness, and ability to analyze complex biological interactions without labeling artifacts. The competitive dynamics are shaped by continuous innovation, strategic partnerships, and increasing focus on providing comprehensive solutions that integrate hardware, software, and consumables.
Dominant Markets & Segments in Label-Free Detection Industry
The North American region dominates the LFD market, driven by strong presence of major players, substantial research funding, and advanced healthcare infrastructure. Within this region, the United States holds the largest market share. However, the Asia-Pacific region is predicted to experience substantial growth, owing to the rising pharmaceutical and biotechnology sector, increasing government investment in research, and growing adoption of advanced technologies.
Key Growth Drivers:
- High R&D spending by pharmaceutical and biotechnology companies
- Government initiatives supporting life sciences research
- Technological advancements in LFD platforms
Dominant Segments:
- Application: Binding kinetics and thermodynamics remain the dominant application segments, driven by their critical role in drug discovery and development.
- End-User: Pharmaceutical & Biotechnology Companies dominate the market due to the high demand for rapid and efficient drug screening and development processes.
- Product: Instruments account for the largest market share, driven by the increasing adoption of sophisticated LFD platforms, however, the consumables segment is expected to show strong growth in the next decade.
- Technology: Surface Plasmon Resonance (SPR) and Bio-Layer Interferometry (BLI) currently hold significant market shares due to their widespread adoption and well-established applications.
Label-free Detection Industry Product Analysis
Product innovations in the LFD industry focus on enhancing sensitivity, throughput, and ease of use. Miniaturization of instruments and development of integrated platforms combining multiple LFD techniques are key trends. The integration of advanced data analysis software, allowing for easier interpretation and automation of experiments is also making a significant impact. This enables high-throughput screening, faster turnaround times, and reduced costs, thus enhancing market fit. Competitive advantages are primarily derived from superior sensitivity, wider application scope, and ease of use.
Key Drivers, Barriers & Challenges in Label-free Detection Industry
Key Drivers:
The market is driven by increased demand for high-throughput screening in drug discovery and development, growing research funding in life sciences, and advancements in LFD technologies like SPR and BLI. Regulatory pressures are also a driver, leading to adoption of faster, more efficient analysis methods.
Key Challenges & Restraints:
High initial investment costs for advanced LFD systems, lack of skilled personnel to operate the equipment, the need for rigorous data analysis, and competition from alternative technologies are significant challenges. Supply chain disruptions can also impact the availability of instruments and consumables, potentially reducing market growth.
Growth Drivers in the Label-free Detection Industry Market
The LFD market is primarily fueled by rising R&D spending in the pharmaceutical and biotechnology sectors, increased adoption of advanced technologies (such as AI and machine learning in data analysis), and the growing need for faster and more efficient drug discovery methods. Government initiatives aimed at promoting life sciences research further amplify market growth.
Challenges Impacting Label-free Detection Industry Growth
High costs associated with instrument acquisition and maintenance, the complexity of data analysis, and competition from other analytical techniques are key barriers. Furthermore, skilled labor shortages and regulatory hurdles pose significant challenges. Supply chain disruptions can significantly affect instrument availability and operating costs.
Key Players Shaping the Label-free Detection Industry Market
- Horiba Ltd
- Waters
- Ametek Inc
- Fluidic Analytics
- PerkinElmer Inc
- Malvern Panalytical
- Thermo Fisher Scientific
- Corning Incorporated
- Cytiva (Danaher Corporation)
- Shimadzu Corporation
Significant Label-free Detection Industry Milestones
- March 2021: Sartorius launched the Octet R series of high-performance label-free analytical systems, expanding its product portfolio and strengthening its market position.
- October 2021: Gator Bio, Inc. introduced the Gator SMAP and Gator mFC probes for its BLI systems, enhancing capabilities for small molecule-protein interaction studies.
- August 2022: Bruker Corporation launched the nanoElute 2 nano-LC system and advanced software, boosting research in protein-protein interactions and metaproteomics.
Future Outlook for Label-Free Detection Industry Market
The LFD industry is poised for continued robust growth, driven by technological advancements, increasing demand from the pharmaceutical and biotechnology sectors, and substantial research funding. Strategic partnerships and the development of integrated platforms will further enhance the market potential, creating significant opportunities for both established and emerging players. The ongoing development of novel LFD technologies and their integration into high-throughput screening workflows will solidify the market’s future growth.
Label-free Detection Industry Segmentation
-
1. Product
-
1.1. Consumables
- 1.1.1. Biosensor Chips
- 1.1.2. Microplates
- 1.2. Instruments
-
1.1. Consumables
-
2. Technology
- 2.1. Mass Spectrometry
- 2.2. Surface Plasmon Resonance (SPR)
- 2.3. Bio-Layer Interferometry
- 2.4. Isothermal Titration Calorimetry
- 2.5. Differential Scanning Calorimetry
- 2.6. Other LFD Technologies
-
3. Application
- 3.1. Binding Kinetics
- 3.2. Binding Thermodynamics
- 3.3. Endogenous Receptor Detection
- 3.4. Hit Confirmation
- 3.5. Lead Generation
- 3.6. Other Applications
-
4. End-User
- 4.1. Pharmaceutical & Biotechnology Companies
- 4.2. Academic & Research Institutes
- 4.3. Contract Research Organizations
Label-free Detection Industry Segmentation By Geography
-
1. North America
- 1.1. United States
- 1.2. Canada
- 1.3. Mexico
-
2. Europe
- 2.1. Germany
- 2.2. United Kingdom
- 2.3. France
- 2.4. Italy
- 2.5. Spain
- 2.6. Rest of Europe
-
3. Asia Pacific
- 3.1. China
- 3.2. Japan
- 3.3. India
- 3.4. Australia
- 3.5. South Korea
- 3.6. Rest of Asia Pacific
-
4. Middle East and Africa
- 4.1. GCC
- 4.2. South Africa
- 4.3. Rest of Middle East and Africa
-
5. South America
- 5.1. Brazil
- 5.2. Argentina
- 5.3. Rest of South America
Label-free Detection Industry REPORT HIGHLIGHTS
| Aspects | Details |
|---|---|
| Study Period | 2019-2033 |
| Base Year | 2024 |
| Estimated Year | 2025 |
| Forecast Period | 2025-2033 |
| Historical Period | 2019-2024 |
| Growth Rate | CAGR of 11.60% from 2019-2033 |
| Segmentation |
|
Table of Contents
- 1. Introduction
- 1.1. Research Scope
- 1.2. Market Segmentation
- 1.3. Research Methodology
- 1.4. Definitions and Assumptions
- 2. Executive Summary
- 2.1. Introduction
- 3. Market Dynamics
- 3.1. Introduction
- 3.2. Market Drivers
- 3.2.1. Increasing R&D Activities Through Research Partnerships Between Pharmaceutical Companies and Academic Institutes; Innovations in Label-free Detection Technologies
- 3.3. Market Restrains
- 3.3.1. High Cost of Instruments; Issues in Sensitivty and Throughput
- 3.4. Market Trends
- 3.4.1. Surface Plasmon Resonance (SPR) Segment is Expected to Hold Largest Share of Global Label-Free Detection (LFD) Market
- 4. Market Factor Analysis
- 4.1. Porters Five Forces
- 4.2. Supply/Value Chain
- 4.3. PESTEL analysis
- 4.4. Market Entropy
- 4.5. Patent/Trademark Analysis
- 5. Global Label-free Detection Industry Analysis, Insights and Forecast, 2019-2031
- 5.1. Market Analysis, Insights and Forecast - by Product
- 5.1.1. Consumables
- 5.1.1.1. Biosensor Chips
- 5.1.1.2. Microplates
- 5.1.2. Instruments
- 5.1.1. Consumables
- 5.2. Market Analysis, Insights and Forecast - by Technology
- 5.2.1. Mass Spectrometry
- 5.2.2. Surface Plasmon Resonance (SPR)
- 5.2.3. Bio-Layer Interferometry
- 5.2.4. Isothermal Titration Calorimetry
- 5.2.5. Differential Scanning Calorimetry
- 5.2.6. Other LFD Technologies
- 5.3. Market Analysis, Insights and Forecast - by Application
- 5.3.1. Binding Kinetics
- 5.3.2. Binding Thermodynamics
- 5.3.3. Endogenous Receptor Detection
- 5.3.4. Hit Confirmation
- 5.3.5. Lead Generation
- 5.3.6. Other Applications
- 5.4. Market Analysis, Insights and Forecast - by End-User
- 5.4.1. Pharmaceutical & Biotechnology Companies
- 5.4.2. Academic & Research Institutes
- 5.4.3. Contract Research Organizations
- 5.5. Market Analysis, Insights and Forecast - by Region
- 5.5.1. North America
- 5.5.2. Europe
- 5.5.3. Asia Pacific
- 5.5.4. Middle East and Africa
- 5.5.5. South America
- 5.1. Market Analysis, Insights and Forecast - by Product
- 6. North America Label-free Detection Industry Analysis, Insights and Forecast, 2019-2031
- 6.1. Market Analysis, Insights and Forecast - by Product
- 6.1.1. Consumables
- 6.1.1.1. Biosensor Chips
- 6.1.1.2. Microplates
- 6.1.2. Instruments
- 6.1.1. Consumables
- 6.2. Market Analysis, Insights and Forecast - by Technology
- 6.2.1. Mass Spectrometry
- 6.2.2. Surface Plasmon Resonance (SPR)
- 6.2.3. Bio-Layer Interferometry
- 6.2.4. Isothermal Titration Calorimetry
- 6.2.5. Differential Scanning Calorimetry
- 6.2.6. Other LFD Technologies
- 6.3. Market Analysis, Insights and Forecast - by Application
- 6.3.1. Binding Kinetics
- 6.3.2. Binding Thermodynamics
- 6.3.3. Endogenous Receptor Detection
- 6.3.4. Hit Confirmation
- 6.3.5. Lead Generation
- 6.3.6. Other Applications
- 6.4. Market Analysis, Insights and Forecast - by End-User
- 6.4.1. Pharmaceutical & Biotechnology Companies
- 6.4.2. Academic & Research Institutes
- 6.4.3. Contract Research Organizations
- 6.1. Market Analysis, Insights and Forecast - by Product
- 7. Europe Label-free Detection Industry Analysis, Insights and Forecast, 2019-2031
- 7.1. Market Analysis, Insights and Forecast - by Product
- 7.1.1. Consumables
- 7.1.1.1. Biosensor Chips
- 7.1.1.2. Microplates
- 7.1.2. Instruments
- 7.1.1. Consumables
- 7.2. Market Analysis, Insights and Forecast - by Technology
- 7.2.1. Mass Spectrometry
- 7.2.2. Surface Plasmon Resonance (SPR)
- 7.2.3. Bio-Layer Interferometry
- 7.2.4. Isothermal Titration Calorimetry
- 7.2.5. Differential Scanning Calorimetry
- 7.2.6. Other LFD Technologies
- 7.3. Market Analysis, Insights and Forecast - by Application
- 7.3.1. Binding Kinetics
- 7.3.2. Binding Thermodynamics
- 7.3.3. Endogenous Receptor Detection
- 7.3.4. Hit Confirmation
- 7.3.5. Lead Generation
- 7.3.6. Other Applications
- 7.4. Market Analysis, Insights and Forecast - by End-User
- 7.4.1. Pharmaceutical & Biotechnology Companies
- 7.4.2. Academic & Research Institutes
- 7.4.3. Contract Research Organizations
- 7.1. Market Analysis, Insights and Forecast - by Product
- 8. Asia Pacific Label-free Detection Industry Analysis, Insights and Forecast, 2019-2031
- 8.1. Market Analysis, Insights and Forecast - by Product
- 8.1.1. Consumables
- 8.1.1.1. Biosensor Chips
- 8.1.1.2. Microplates
- 8.1.2. Instruments
- 8.1.1. Consumables
- 8.2. Market Analysis, Insights and Forecast - by Technology
- 8.2.1. Mass Spectrometry
- 8.2.2. Surface Plasmon Resonance (SPR)
- 8.2.3. Bio-Layer Interferometry
- 8.2.4. Isothermal Titration Calorimetry
- 8.2.5. Differential Scanning Calorimetry
- 8.2.6. Other LFD Technologies
- 8.3. Market Analysis, Insights and Forecast - by Application
- 8.3.1. Binding Kinetics
- 8.3.2. Binding Thermodynamics
- 8.3.3. Endogenous Receptor Detection
- 8.3.4. Hit Confirmation
- 8.3.5. Lead Generation
- 8.3.6. Other Applications
- 8.4. Market Analysis, Insights and Forecast - by End-User
- 8.4.1. Pharmaceutical & Biotechnology Companies
- 8.4.2. Academic & Research Institutes
- 8.4.3. Contract Research Organizations
- 8.1. Market Analysis, Insights and Forecast - by Product
- 9. Middle East and Africa Label-free Detection Industry Analysis, Insights and Forecast, 2019-2031
- 9.1. Market Analysis, Insights and Forecast - by Product
- 9.1.1. Consumables
- 9.1.1.1. Biosensor Chips
- 9.1.1.2. Microplates
- 9.1.2. Instruments
- 9.1.1. Consumables
- 9.2. Market Analysis, Insights and Forecast - by Technology
- 9.2.1. Mass Spectrometry
- 9.2.2. Surface Plasmon Resonance (SPR)
- 9.2.3. Bio-Layer Interferometry
- 9.2.4. Isothermal Titration Calorimetry
- 9.2.5. Differential Scanning Calorimetry
- 9.2.6. Other LFD Technologies
- 9.3. Market Analysis, Insights and Forecast - by Application
- 9.3.1. Binding Kinetics
- 9.3.2. Binding Thermodynamics
- 9.3.3. Endogenous Receptor Detection
- 9.3.4. Hit Confirmation
- 9.3.5. Lead Generation
- 9.3.6. Other Applications
- 9.4. Market Analysis, Insights and Forecast - by End-User
- 9.4.1. Pharmaceutical & Biotechnology Companies
- 9.4.2. Academic & Research Institutes
- 9.4.3. Contract Research Organizations
- 9.1. Market Analysis, Insights and Forecast - by Product
- 10. South America Label-free Detection Industry Analysis, Insights and Forecast, 2019-2031
- 10.1. Market Analysis, Insights and Forecast - by Product
- 10.1.1. Consumables
- 10.1.1.1. Biosensor Chips
- 10.1.1.2. Microplates
- 10.1.2. Instruments
- 10.1.1. Consumables
- 10.2. Market Analysis, Insights and Forecast - by Technology
- 10.2.1. Mass Spectrometry
- 10.2.2. Surface Plasmon Resonance (SPR)
- 10.2.3. Bio-Layer Interferometry
- 10.2.4. Isothermal Titration Calorimetry
- 10.2.5. Differential Scanning Calorimetry
- 10.2.6. Other LFD Technologies
- 10.3. Market Analysis, Insights and Forecast - by Application
- 10.3.1. Binding Kinetics
- 10.3.2. Binding Thermodynamics
- 10.3.3. Endogenous Receptor Detection
- 10.3.4. Hit Confirmation
- 10.3.5. Lead Generation
- 10.3.6. Other Applications
- 10.4. Market Analysis, Insights and Forecast - by End-User
- 10.4.1. Pharmaceutical & Biotechnology Companies
- 10.4.2. Academic & Research Institutes
- 10.4.3. Contract Research Organizations
- 10.1. Market Analysis, Insights and Forecast - by Product
- 11. North America Label-free Detection Industry Analysis, Insights and Forecast, 2019-2031
- 11.1. Market Analysis, Insights and Forecast - By Country/Sub-region
- 11.1.1 United States
- 11.1.2 Canada
- 11.1.3 Mexico
- 12. South America Label-free Detection Industry Analysis, Insights and Forecast, 2019-2031
- 12.1. Market Analysis, Insights and Forecast - By Country/Sub-region
- 12.1.1 Brazil
- 12.1.2 Mexico
- 12.1.3 Rest of South America
- 13. Europe Label-free Detection Industry Analysis, Insights and Forecast, 2019-2031
- 13.1. Market Analysis, Insights and Forecast - By Country/Sub-region
- 13.1.1 United Kingdom
- 13.1.2 Germany
- 13.1.3 France
- 13.1.4 Italy
- 13.1.5 Spain
- 13.1.6 Russia
- 13.1.7 Rest of Europe
- 14. Asia Pacific Label-free Detection Industry Analysis, Insights and Forecast, 2019-2031
- 14.1. Market Analysis, Insights and Forecast - By Country/Sub-region
- 14.1.1 China
- 14.1.2 Japan
- 14.1.3 India
- 14.1.4 South Korea
- 14.1.5 Taiwan
- 14.1.6 Australia
- 14.1.7 Rest of Asia-Pacific
- 15. MEA Label-free Detection Industry Analysis, Insights and Forecast, 2019-2031
- 15.1. Market Analysis, Insights and Forecast - By Country/Sub-region
- 15.1.1 Middle East
- 15.1.2 Africa
- 16. Competitive Analysis
- 16.1. Global Market Share Analysis 2024
- 16.2. Company Profiles
- 16.2.1 Horiba Ltd
- 16.2.1.1. Overview
- 16.2.1.2. Products
- 16.2.1.3. SWOT Analysis
- 16.2.1.4. Recent Developments
- 16.2.1.5. Financials (Based on Availability)
- 16.2.2 Waters
- 16.2.2.1. Overview
- 16.2.2.2. Products
- 16.2.2.3. SWOT Analysis
- 16.2.2.4. Recent Developments
- 16.2.2.5. Financials (Based on Availability)
- 16.2.3 Ametek Inc
- 16.2.3.1. Overview
- 16.2.3.2. Products
- 16.2.3.3. SWOT Analysis
- 16.2.3.4. Recent Developments
- 16.2.3.5. Financials (Based on Availability)
- 16.2.4 Fluidic Analytics
- 16.2.4.1. Overview
- 16.2.4.2. Products
- 16.2.4.3. SWOT Analysis
- 16.2.4.4. Recent Developments
- 16.2.4.5. Financials (Based on Availability)
- 16.2.5 PerkinElmer Inc
- 16.2.5.1. Overview
- 16.2.5.2. Products
- 16.2.5.3. SWOT Analysis
- 16.2.5.4. Recent Developments
- 16.2.5.5. Financials (Based on Availability)
- 16.2.6 Malvern Panalytical
- 16.2.6.1. Overview
- 16.2.6.2. Products
- 16.2.6.3. SWOT Analysis
- 16.2.6.4. Recent Developments
- 16.2.6.5. Financials (Based on Availability)
- 16.2.7 Thermo Fisher Scientific
- 16.2.7.1. Overview
- 16.2.7.2. Products
- 16.2.7.3. SWOT Analysis
- 16.2.7.4. Recent Developments
- 16.2.7.5. Financials (Based on Availability)
- 16.2.8 Corning Incorporated
- 16.2.8.1. Overview
- 16.2.8.2. Products
- 16.2.8.3. SWOT Analysis
- 16.2.8.4. Recent Developments
- 16.2.8.5. Financials (Based on Availability)
- 16.2.9 Cytiva (Danaher Corporation)
- 16.2.9.1. Overview
- 16.2.9.2. Products
- 16.2.9.3. SWOT Analysis
- 16.2.9.4. Recent Developments
- 16.2.9.5. Financials (Based on Availability)
- 16.2.10 Shimadzu Corporation
- 16.2.10.1. Overview
- 16.2.10.2. Products
- 16.2.10.3. SWOT Analysis
- 16.2.10.4. Recent Developments
- 16.2.10.5. Financials (Based on Availability)
- 16.2.1 Horiba Ltd
List of Figures
- Figure 1: Global Label-free Detection Industry Revenue Breakdown (Million, %) by Region 2024 & 2032
- Figure 2: North America Label-free Detection Industry Revenue (Million), by Country 2024 & 2032
- Figure 3: North America Label-free Detection Industry Revenue Share (%), by Country 2024 & 2032
- Figure 4: South America Label-free Detection Industry Revenue (Million), by Country 2024 & 2032
- Figure 5: South America Label-free Detection Industry Revenue Share (%), by Country 2024 & 2032
- Figure 6: Europe Label-free Detection Industry Revenue (Million), by Country 2024 & 2032
- Figure 7: Europe Label-free Detection Industry Revenue Share (%), by Country 2024 & 2032
- Figure 8: Asia Pacific Label-free Detection Industry Revenue (Million), by Country 2024 & 2032
- Figure 9: Asia Pacific Label-free Detection Industry Revenue Share (%), by Country 2024 & 2032
- Figure 10: MEA Label-free Detection Industry Revenue (Million), by Country 2024 & 2032
- Figure 11: MEA Label-free Detection Industry Revenue Share (%), by Country 2024 & 2032
- Figure 12: North America Label-free Detection Industry Revenue (Million), by Product 2024 & 2032
- Figure 13: North America Label-free Detection Industry Revenue Share (%), by Product 2024 & 2032
- Figure 14: North America Label-free Detection Industry Revenue (Million), by Technology 2024 & 2032
- Figure 15: North America Label-free Detection Industry Revenue Share (%), by Technology 2024 & 2032
- Figure 16: North America Label-free Detection Industry Revenue (Million), by Application 2024 & 2032
- Figure 17: North America Label-free Detection Industry Revenue Share (%), by Application 2024 & 2032
- Figure 18: North America Label-free Detection Industry Revenue (Million), by End-User 2024 & 2032
- Figure 19: North America Label-free Detection Industry Revenue Share (%), by End-User 2024 & 2032
- Figure 20: North America Label-free Detection Industry Revenue (Million), by Country 2024 & 2032
- Figure 21: North America Label-free Detection Industry Revenue Share (%), by Country 2024 & 2032
- Figure 22: Europe Label-free Detection Industry Revenue (Million), by Product 2024 & 2032
- Figure 23: Europe Label-free Detection Industry Revenue Share (%), by Product 2024 & 2032
- Figure 24: Europe Label-free Detection Industry Revenue (Million), by Technology 2024 & 2032
- Figure 25: Europe Label-free Detection Industry Revenue Share (%), by Technology 2024 & 2032
- Figure 26: Europe Label-free Detection Industry Revenue (Million), by Application 2024 & 2032
- Figure 27: Europe Label-free Detection Industry Revenue Share (%), by Application 2024 & 2032
- Figure 28: Europe Label-free Detection Industry Revenue (Million), by End-User 2024 & 2032
- Figure 29: Europe Label-free Detection Industry Revenue Share (%), by End-User 2024 & 2032
- Figure 30: Europe Label-free Detection Industry Revenue (Million), by Country 2024 & 2032
- Figure 31: Europe Label-free Detection Industry Revenue Share (%), by Country 2024 & 2032
- Figure 32: Asia Pacific Label-free Detection Industry Revenue (Million), by Product 2024 & 2032
- Figure 33: Asia Pacific Label-free Detection Industry Revenue Share (%), by Product 2024 & 2032
- Figure 34: Asia Pacific Label-free Detection Industry Revenue (Million), by Technology 2024 & 2032
- Figure 35: Asia Pacific Label-free Detection Industry Revenue Share (%), by Technology 2024 & 2032
- Figure 36: Asia Pacific Label-free Detection Industry Revenue (Million), by Application 2024 & 2032
- Figure 37: Asia Pacific Label-free Detection Industry Revenue Share (%), by Application 2024 & 2032
- Figure 38: Asia Pacific Label-free Detection Industry Revenue (Million), by End-User 2024 & 2032
- Figure 39: Asia Pacific Label-free Detection Industry Revenue Share (%), by End-User 2024 & 2032
- Figure 40: Asia Pacific Label-free Detection Industry Revenue (Million), by Country 2024 & 2032
- Figure 41: Asia Pacific Label-free Detection Industry Revenue Share (%), by Country 2024 & 2032
- Figure 42: Middle East and Africa Label-free Detection Industry Revenue (Million), by Product 2024 & 2032
- Figure 43: Middle East and Africa Label-free Detection Industry Revenue Share (%), by Product 2024 & 2032
- Figure 44: Middle East and Africa Label-free Detection Industry Revenue (Million), by Technology 2024 & 2032
- Figure 45: Middle East and Africa Label-free Detection Industry Revenue Share (%), by Technology 2024 & 2032
- Figure 46: Middle East and Africa Label-free Detection Industry Revenue (Million), by Application 2024 & 2032
- Figure 47: Middle East and Africa Label-free Detection Industry Revenue Share (%), by Application 2024 & 2032
- Figure 48: Middle East and Africa Label-free Detection Industry Revenue (Million), by End-User 2024 & 2032
- Figure 49: Middle East and Africa Label-free Detection Industry Revenue Share (%), by End-User 2024 & 2032
- Figure 50: Middle East and Africa Label-free Detection Industry Revenue (Million), by Country 2024 & 2032
- Figure 51: Middle East and Africa Label-free Detection Industry Revenue Share (%), by Country 2024 & 2032
- Figure 52: South America Label-free Detection Industry Revenue (Million), by Product 2024 & 2032
- Figure 53: South America Label-free Detection Industry Revenue Share (%), by Product 2024 & 2032
- Figure 54: South America Label-free Detection Industry Revenue (Million), by Technology 2024 & 2032
- Figure 55: South America Label-free Detection Industry Revenue Share (%), by Technology 2024 & 2032
- Figure 56: South America Label-free Detection Industry Revenue (Million), by Application 2024 & 2032
- Figure 57: South America Label-free Detection Industry Revenue Share (%), by Application 2024 & 2032
- Figure 58: South America Label-free Detection Industry Revenue (Million), by End-User 2024 & 2032
- Figure 59: South America Label-free Detection Industry Revenue Share (%), by End-User 2024 & 2032
- Figure 60: South America Label-free Detection Industry Revenue (Million), by Country 2024 & 2032
- Figure 61: South America Label-free Detection Industry Revenue Share (%), by Country 2024 & 2032
List of Tables
- Table 1: Global Label-free Detection Industry Revenue Million Forecast, by Region 2019 & 2032
- Table 2: Global Label-free Detection Industry Revenue Million Forecast, by Product 2019 & 2032
- Table 3: Global Label-free Detection Industry Revenue Million Forecast, by Technology 2019 & 2032
- Table 4: Global Label-free Detection Industry Revenue Million Forecast, by Application 2019 & 2032
- Table 5: Global Label-free Detection Industry Revenue Million Forecast, by End-User 2019 & 2032
- Table 6: Global Label-free Detection Industry Revenue Million Forecast, by Region 2019 & 2032
- Table 7: Global Label-free Detection Industry Revenue Million Forecast, by Country 2019 & 2032
- Table 8: United States Label-free Detection Industry Revenue (Million) Forecast, by Application 2019 & 2032
- Table 9: Canada Label-free Detection Industry Revenue (Million) Forecast, by Application 2019 & 2032
- Table 10: Mexico Label-free Detection Industry Revenue (Million) Forecast, by Application 2019 & 2032
- Table 11: Global Label-free Detection Industry Revenue Million Forecast, by Country 2019 & 2032
- Table 12: Brazil Label-free Detection Industry Revenue (Million) Forecast, by Application 2019 & 2032
- Table 13: Mexico Label-free Detection Industry Revenue (Million) Forecast, by Application 2019 & 2032
- Table 14: Rest of South America Label-free Detection Industry Revenue (Million) Forecast, by Application 2019 & 2032
- Table 15: Global Label-free Detection Industry Revenue Million Forecast, by Country 2019 & 2032
- Table 16: United Kingdom Label-free Detection Industry Revenue (Million) Forecast, by Application 2019 & 2032
- Table 17: Germany Label-free Detection Industry Revenue (Million) Forecast, by Application 2019 & 2032
- Table 18: France Label-free Detection Industry Revenue (Million) Forecast, by Application 2019 & 2032
- Table 19: Italy Label-free Detection Industry Revenue (Million) Forecast, by Application 2019 & 2032
- Table 20: Spain Label-free Detection Industry Revenue (Million) Forecast, by Application 2019 & 2032
- Table 21: Russia Label-free Detection Industry Revenue (Million) Forecast, by Application 2019 & 2032
- Table 22: Rest of Europe Label-free Detection Industry Revenue (Million) Forecast, by Application 2019 & 2032
- Table 23: Global Label-free Detection Industry Revenue Million Forecast, by Country 2019 & 2032
- Table 24: China Label-free Detection Industry Revenue (Million) Forecast, by Application 2019 & 2032
- Table 25: Japan Label-free Detection Industry Revenue (Million) Forecast, by Application 2019 & 2032
- Table 26: India Label-free Detection Industry Revenue (Million) Forecast, by Application 2019 & 2032
- Table 27: South Korea Label-free Detection Industry Revenue (Million) Forecast, by Application 2019 & 2032
- Table 28: Taiwan Label-free Detection Industry Revenue (Million) Forecast, by Application 2019 & 2032
- Table 29: Australia Label-free Detection Industry Revenue (Million) Forecast, by Application 2019 & 2032
- Table 30: Rest of Asia-Pacific Label-free Detection Industry Revenue (Million) Forecast, by Application 2019 & 2032
- Table 31: Global Label-free Detection Industry Revenue Million Forecast, by Country 2019 & 2032
- Table 32: Middle East Label-free Detection Industry Revenue (Million) Forecast, by Application 2019 & 2032
- Table 33: Africa Label-free Detection Industry Revenue (Million) Forecast, by Application 2019 & 2032
- Table 34: Global Label-free Detection Industry Revenue Million Forecast, by Product 2019 & 2032
- Table 35: Global Label-free Detection Industry Revenue Million Forecast, by Technology 2019 & 2032
- Table 36: Global Label-free Detection Industry Revenue Million Forecast, by Application 2019 & 2032
- Table 37: Global Label-free Detection Industry Revenue Million Forecast, by End-User 2019 & 2032
- Table 38: Global Label-free Detection Industry Revenue Million Forecast, by Country 2019 & 2032
- Table 39: United States Label-free Detection Industry Revenue (Million) Forecast, by Application 2019 & 2032
- Table 40: Canada Label-free Detection Industry Revenue (Million) Forecast, by Application 2019 & 2032
- Table 41: Mexico Label-free Detection Industry Revenue (Million) Forecast, by Application 2019 & 2032
- Table 42: Global Label-free Detection Industry Revenue Million Forecast, by Product 2019 & 2032
- Table 43: Global Label-free Detection Industry Revenue Million Forecast, by Technology 2019 & 2032
- Table 44: Global Label-free Detection Industry Revenue Million Forecast, by Application 2019 & 2032
- Table 45: Global Label-free Detection Industry Revenue Million Forecast, by End-User 2019 & 2032
- Table 46: Global Label-free Detection Industry Revenue Million Forecast, by Country 2019 & 2032
- Table 47: Germany Label-free Detection Industry Revenue (Million) Forecast, by Application 2019 & 2032
- Table 48: United Kingdom Label-free Detection Industry Revenue (Million) Forecast, by Application 2019 & 2032
- Table 49: France Label-free Detection Industry Revenue (Million) Forecast, by Application 2019 & 2032
- Table 50: Italy Label-free Detection Industry Revenue (Million) Forecast, by Application 2019 & 2032
- Table 51: Spain Label-free Detection Industry Revenue (Million) Forecast, by Application 2019 & 2032
- Table 52: Rest of Europe Label-free Detection Industry Revenue (Million) Forecast, by Application 2019 & 2032
- Table 53: Global Label-free Detection Industry Revenue Million Forecast, by Product 2019 & 2032
- Table 54: Global Label-free Detection Industry Revenue Million Forecast, by Technology 2019 & 2032
- Table 55: Global Label-free Detection Industry Revenue Million Forecast, by Application 2019 & 2032
- Table 56: Global Label-free Detection Industry Revenue Million Forecast, by End-User 2019 & 2032
- Table 57: Global Label-free Detection Industry Revenue Million Forecast, by Country 2019 & 2032
- Table 58: China Label-free Detection Industry Revenue (Million) Forecast, by Application 2019 & 2032
- Table 59: Japan Label-free Detection Industry Revenue (Million) Forecast, by Application 2019 & 2032
- Table 60: India Label-free Detection Industry Revenue (Million) Forecast, by Application 2019 & 2032
- Table 61: Australia Label-free Detection Industry Revenue (Million) Forecast, by Application 2019 & 2032
- Table 62: South Korea Label-free Detection Industry Revenue (Million) Forecast, by Application 2019 & 2032
- Table 63: Rest of Asia Pacific Label-free Detection Industry Revenue (Million) Forecast, by Application 2019 & 2032
- Table 64: Global Label-free Detection Industry Revenue Million Forecast, by Product 2019 & 2032
- Table 65: Global Label-free Detection Industry Revenue Million Forecast, by Technology 2019 & 2032
- Table 66: Global Label-free Detection Industry Revenue Million Forecast, by Application 2019 & 2032
- Table 67: Global Label-free Detection Industry Revenue Million Forecast, by End-User 2019 & 2032
- Table 68: Global Label-free Detection Industry Revenue Million Forecast, by Country 2019 & 2032
- Table 69: GCC Label-free Detection Industry Revenue (Million) Forecast, by Application 2019 & 2032
- Table 70: South Africa Label-free Detection Industry Revenue (Million) Forecast, by Application 2019 & 2032
- Table 71: Rest of Middle East and Africa Label-free Detection Industry Revenue (Million) Forecast, by Application 2019 & 2032
- Table 72: Global Label-free Detection Industry Revenue Million Forecast, by Product 2019 & 2032
- Table 73: Global Label-free Detection Industry Revenue Million Forecast, by Technology 2019 & 2032
- Table 74: Global Label-free Detection Industry Revenue Million Forecast, by Application 2019 & 2032
- Table 75: Global Label-free Detection Industry Revenue Million Forecast, by End-User 2019 & 2032
- Table 76: Global Label-free Detection Industry Revenue Million Forecast, by Country 2019 & 2032
- Table 77: Brazil Label-free Detection Industry Revenue (Million) Forecast, by Application 2019 & 2032
- Table 78: Argentina Label-free Detection Industry Revenue (Million) Forecast, by Application 2019 & 2032
- Table 79: Rest of South America Label-free Detection Industry Revenue (Million) Forecast, by Application 2019 & 2032
Frequently Asked Questions
1. What is the projected Compound Annual Growth Rate (CAGR) of the Label-free Detection Industry?
The projected CAGR is approximately 11.60%.
2. Which companies are prominent players in the Label-free Detection Industry?
Key companies in the market include Horiba Ltd, Waters, Ametek Inc, Fluidic Analytics, PerkinElmer Inc, Malvern Panalytical, Thermo Fisher Scientific, Corning Incorporated, Cytiva (Danaher Corporation), Shimadzu Corporation.
3. What are the main segments of the Label-free Detection Industry?
The market segments include Product, Technology, Application, End-User.
4. Can you provide details about the market size?
The market size is estimated to be USD 1.72 Million as of 2022.
5. What are some drivers contributing to market growth?
Increasing R&D Activities Through Research Partnerships Between Pharmaceutical Companies and Academic Institutes; Innovations in Label-free Detection Technologies.
6. What are the notable trends driving market growth?
Surface Plasmon Resonance (SPR) Segment is Expected to Hold Largest Share of Global Label-Free Detection (LFD) Market.
7. Are there any restraints impacting market growth?
High Cost of Instruments; Issues in Sensitivty and Throughput.
8. Can you provide examples of recent developments in the market?
August 2022: Bruker Corporation announced the launch of the new nanoElute 2 nano-LC, MetaboScape, and TASQ 2023 software supporting fluxomics and the latest advances in PaSERs intelligent acquisition to enhance research in protein-protein interactions (PPIs) and metaproteomics applications. nanoElute 2 features nano-LC advances that support automated single-cell sample preparation from label-free ProteoCHIP on the CellenONE platform.
9. What pricing options are available for accessing the report?
Pricing options include single-user, multi-user, and enterprise licenses priced at USD 4750, USD 5250, and USD 8750 respectively.
10. Is the market size provided in terms of value or volume?
The market size is provided in terms of value, measured in Million.
11. Are there any specific market keywords associated with the report?
Yes, the market keyword associated with the report is "Label-free Detection Industry," which aids in identifying and referencing the specific market segment covered.
12. How do I determine which pricing option suits my needs best?
The pricing options vary based on user requirements and access needs. Individual users may opt for single-user licenses, while businesses requiring broader access may choose multi-user or enterprise licenses for cost-effective access to the report.
13. Are there any additional resources or data provided in the Label-free Detection Industry report?
While the report offers comprehensive insights, it's advisable to review the specific contents or supplementary materials provided to ascertain if additional resources or data are available.
14. How can I stay updated on further developments or reports in the Label-free Detection Industry?
To stay informed about further developments, trends, and reports in the Label-free Detection Industry, consider subscribing to industry newsletters, following relevant companies and organizations, or regularly checking reputable industry news sources and publications.
Methodology
Step 1 - Identification of Relevant Samples Size from Population Database


Step 2 - Approaches for Defining Global Market Size (Value, Volume* & Price*)

Note*: In applicable scenarios
Step 3 - Data Sources
Primary Research
- Web Analytics
- Survey Reports
- Research Institute
- Latest Research Reports
- Opinion Leaders
Secondary Research
- Annual Reports
- White Paper
- Latest Press Release
- Industry Association
- Paid Database
- Investor Presentations

Step 4 - Data Triangulation
Involves using different sources of information in order to increase the validity of a study
These sources are likely to be stakeholders in a program - participants, other researchers, program staff, other community members, and so on.
Then we put all data in single framework & apply various statistical tools to find out the dynamic on the market.
During the analysis stage, feedback from the stakeholder groups would be compared to determine areas of agreement as well as areas of divergence
