

Key Insights
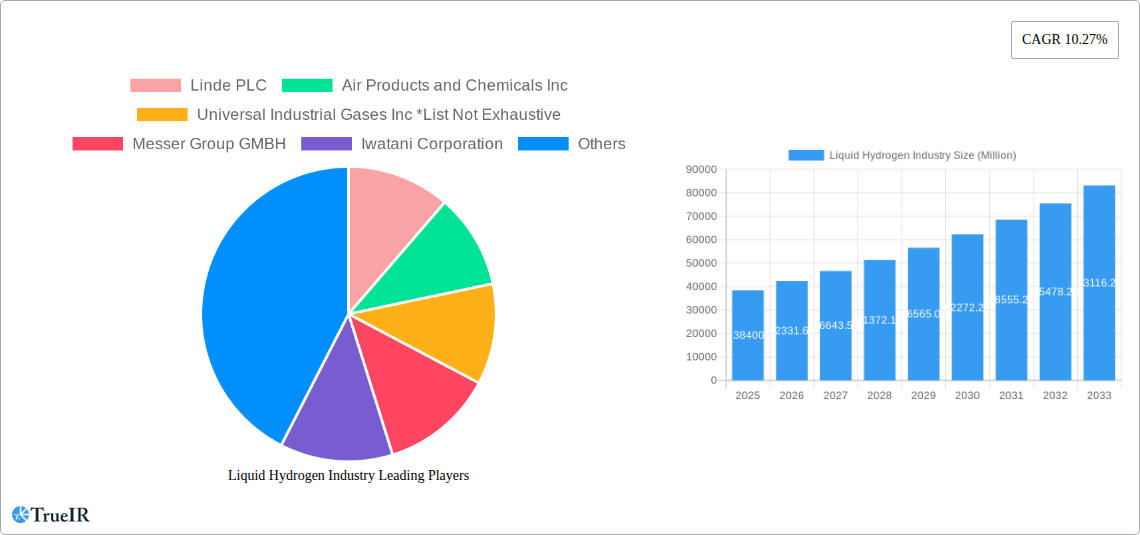
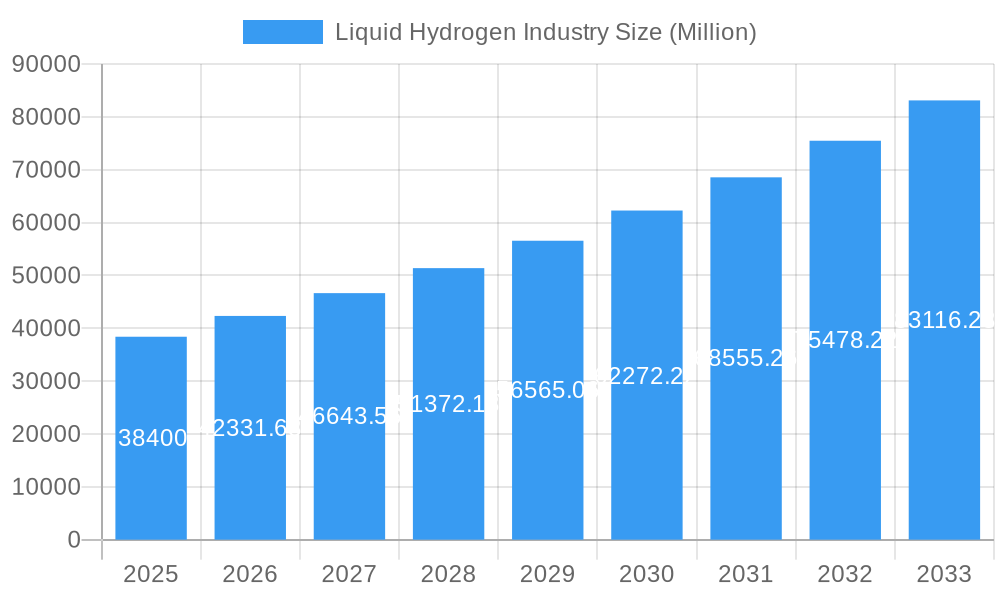
The global liquid hydrogen market, valued at $38.4 billion in 2025, is projected to experience robust growth, driven by the burgeoning demand for clean energy solutions and the increasing adoption of hydrogen fuel cell technology across diverse sectors. A compound annual growth rate (CAGR) of 10.27% from 2025 to 2033 signifies a significant expansion, primarily fueled by government initiatives promoting hydrogen as a sustainable alternative to fossil fuels, particularly in transportation (automotive, aerospace, and marine). The automotive industry's shift towards fuel cell electric vehicles (FCEVs) is a major catalyst, along with the growing aerospace sector's exploration of hydrogen propulsion for both aircraft and space applications. Furthermore, advancements in cryogenic storage and transportation technologies, such as improved cryogenic tanks and high-pressure tube trailers, are enhancing the market's efficiency and accessibility. While infrastructure development and the high cost of production currently pose challenges, ongoing technological improvements and supportive policies are expected to mitigate these restraints. The market segmentation by distribution method (cryogenic tanks and high-pressure tube trailers) and end-user industry (automotive, aerospace, marine, and others) provides a granular understanding of market dynamics, enabling focused strategic decision-making. Key players like Linde PLC, Air Products and Chemicals Inc., and Air Liquide are actively shaping the landscape through strategic investments in production facilities, research and development, and strategic partnerships.
Liquid Hydrogen Industry Market Size (In Billion)
The geographical distribution of the liquid hydrogen market reflects varying levels of adoption across regions. North America and Europe currently hold significant market shares, driven by established industrial bases and supportive governmental policies. However, the Asia-Pacific region is poised for substantial growth, fueled by increasing investments in renewable energy infrastructure and the rapid expansion of its automotive and industrial sectors. China, Japan, and South Korea are expected to be key growth drivers within this region. While South America and the Middle East & Africa regions are currently exhibiting slower growth, increasing government support for clean energy initiatives and emerging industrial demands suggest a potential for accelerated expansion in the coming years. The forecast period of 2025-2033 offers significant opportunities for market participants to capitalize on this expanding market, but strategic planning considering regional nuances and technological advancements will be crucial for success.
Liquid Hydrogen Industry Company Market Share
Liquid Hydrogen Industry: A Comprehensive Market Report (2019-2033)
This dynamic report provides a comprehensive analysis of the global liquid hydrogen industry, offering invaluable insights for investors, industry professionals, and researchers. With a study period spanning 2019-2033, a base year of 2025, and a forecast period of 2025-2033, this report delves into market size, growth drivers, challenges, and competitive dynamics, offering a detailed roadmap for navigating this rapidly evolving sector. The report projects a market value exceeding XX Million by 2033, presenting significant opportunities for growth and investment.
Liquid Hydrogen Industry Market Structure & Competitive Landscape
The liquid hydrogen market is characterized by a moderately concentrated structure, with key players such as Linde PLC, Air Products and Chemicals Inc, and Air Liquide holding significant market share. However, the emergence of innovative smaller companies like ITM Power and regional players is fostering increased competition. The industry's dynamics are shaped by continuous technological advancements, stringent regulatory frameworks focused on emissions reduction, and the growing demand for cleaner energy sources. Product substitution is currently limited due to the unique properties of liquid hydrogen, but alternative energy storage solutions pose a potential long-term threat.
The automotive, aerospace, and marine sectors are the primary end-users, each driving specific technological innovations and influencing market demand. The merger and acquisition (M&A) activity within the sector has been significant, with deals primarily focusing on expanding production capacity, securing raw material supplies, and enhancing distribution networks. While precise figures for M&A volume are not publicly available for this specific period, the high rate of investment suggests a substantial figure in the hundreds of millions, if not Billions of USD. The market concentration ratio (CR4) is estimated to be around xx%, indicating a moderately concentrated market with opportunities for both established players and new entrants. Further analysis explores the detailed influence of governmental policies across leading economies, influencing investments and development.
Liquid Hydrogen Industry Market Trends & Opportunities
The global liquid hydrogen market is experiencing robust growth, driven by the increasing demand for clean energy solutions and substantial investments in renewable energy infrastructure. The market size is projected to reach XX Million by 2033, exhibiting a Compound Annual Growth Rate (CAGR) of xx% during the forecast period. This growth is fueled by several key factors including technological advancements in hydrogen production, storage, and transportation. Government policies aimed at reducing carbon emissions and achieving climate goals are providing substantial incentives to adopt hydrogen as a fuel source. Shifting consumer preferences towards sustainable energy solutions are also creating substantial demand. The rise of hydrogen-powered vehicles in the automotive industry and the exploration of liquid hydrogen for aerospace applications are prominent factors contributing to growth. The market penetration rate for liquid hydrogen in various end-use sectors is projected to increase significantly over the coming years, reaching xx% by 2033 in select sectors like automotive and marine. Competitive dynamics are intensifying, with major players focusing on strategic partnerships, capacity expansions, and technological innovations to maintain a leading position in this expanding market.
Dominant Markets & Segments in Liquid Hydrogen Industry
The global liquid hydrogen market is geographically diverse, with significant growth potential across multiple regions. However, several key markets and segments are driving industry expansion:
Leading Regions/Countries: Asia-Pacific, followed closely by North America and Europe, are projected to dominate the market due to strong government support, substantial investments in renewable energy, and a growing demand for cleaner energy sources.
Dominant Distribution Segments:
- Cryogenic Tanks: This segment holds a substantial market share due to its established infrastructure and cost-effectiveness for bulk storage and transportation of liquid hydrogen.
- High-Pressure Tube Trailers: This segment is witnessing increasing adoption due to its potential for efficient transportation over long distances, though this sector is still relatively underdeveloped compared to cryogenic tanks.
Leading End-User Industries:
- Automotive: The automotive sector presents a significant growth opportunity, driven by the increasing adoption of fuel-cell electric vehicles (FCEVs).
- Aerospace (including Outer Space): The aerospace industry is exploring liquid hydrogen as a sustainable fuel for both ground support equipment and aviation, particularly for space exploration.
- Marine: The marine sector is exploring the potential of liquid hydrogen as a fuel for ships, reducing emissions and promoting sustainable maritime transportation.
Key growth drivers in these segments include the development of supporting infrastructure (e.g., refueling stations, pipelines), supportive government policies and incentives (tax credits, subsidies), and advancements in technologies related to storage, transportation, and production.
Liquid Hydrogen Industry Product Analysis
Significant innovation is driving advancements in liquid hydrogen production, storage, and transportation technologies. This includes improvements in cryogenic tank designs for increased efficiency and safety, development of more efficient high-pressure tube trailers, and advancements in hydrogen liquefaction techniques. The market is seeing a focus on green hydrogen production using renewable energy sources to minimize environmental impact. These technological advancements directly translate to improved market fit and competitive advantages, allowing companies to offer more cost-effective and sustainable solutions to end-users.
Key Drivers, Barriers & Challenges in Liquid Hydrogen Industry
Key Drivers: The primary drivers include increasing demand for clean energy, supportive government policies and regulations, technological advancements in production and storage, and falling production costs. For instance, the growth of renewable energy sources is providing a cost-effective way to produce green hydrogen.
Key Challenges: Major challenges involve the high cost of production and infrastructure development, lack of widespread infrastructure for distribution, safety concerns related to hydrogen handling, and the competitive landscape with other clean energy sources. The lack of standardized regulations and safety protocols across different regions adds complexity. For example, the current cost of green hydrogen production is still significantly higher than fossil fuels. This creates a barrier to wider adoption. These issues, if not addressed, could significantly impact projected growth trajectories.
Growth Drivers in the Liquid Hydrogen Industry Market
The liquid hydrogen market's growth is fueled by several key factors. Stringent emission reduction targets by governments globally are creating considerable demand for clean energy alternatives. Technological progress in production and storage, particularly in green hydrogen methods, is lowering costs and improving efficiency. Increasing investments in hydrogen infrastructure, including refueling stations and pipelines, are enhancing accessibility. Finally, strategic alliances and collaborations between various industry players are fostering innovation and driving market expansion.
Challenges Impacting Liquid Hydrogen Industry Growth
Several factors hinder the liquid hydrogen industry's growth. The high capital expenditure required for establishing production facilities and distribution infrastructure poses a significant challenge for many smaller players. Safety concerns related to hydrogen storage and transportation require robust regulatory frameworks and safety protocols, which can slow down market expansion. Moreover, competition from other clean energy technologies, including battery electric vehicles and other energy storage solutions, poses a threat to liquid hydrogen's market share.
Key Players Shaping the Liquid Hydrogen Industry Market
- Linde PLC
- Air Products and Chemicals Inc
- Universal Industrial Gases Inc
- Messer Group GMBH
- Iwatani Corporation
- Air Liquide
- Nippon Sanso Holdings Corporation
- Praxair Technology Inc.
- ITM Power
Significant Liquid Hydrogen Industry Milestones
- May 2022: Air Liquide invested USD 250 Million and established its largest liquid hydrogen production and logistics infrastructure complex in North Las Vegas, Nevada. This significantly increased liquid hydrogen production capacity in the US.
- Sept 2022: Linde announced the construction of a 35-megawatt PEM electrolyzer in Niagara Falls, New York, marking the largest electrolyzer installation globally by Linde and expanding its green liquid hydrogen production capacity.
- Mar 2023: Iwatani Corporation and ENEOS Corporation initiated the "Liquefied Hydrogen Supply Chain Commercialization Demonstration Project," aiming to develop marine transportation technologies for liquefied hydrogen and reduce supply costs to 30 JPY/Nm3 by 2030.
Future Outlook for Liquid Hydrogen Industry Market
The future of the liquid hydrogen industry is bright, driven by several key catalysts. Continued technological advancements will reduce production costs and improve efficiency. Expanding government support through policy initiatives and investment will accelerate infrastructure development. Growing consumer demand for sustainable energy solutions, coupled with increasing collaborations within the industry, will fuel further market expansion. The market is poised for substantial growth, offering immense opportunities for established players and new entrants alike. The potential for liquid hydrogen to play a crucial role in decarbonizing various sectors ensures a promising future for this dynamic industry.
Liquid Hydrogen Industry Segmentation
-
1. Distribution
- 1.1. Cryogenic Tank
- 1.2. High-Pressure Tube Trailers
-
2. End-user Industry
- 2.1. Automotive
- 2.2. Aerospace (including Outer Space)
- 2.3. Marine
- 2.4. Other End-User Industries
Liquid Hydrogen Industry Segmentation By Geography
-
1. Asia Pacific
- 1.1. China
- 1.2. India
- 1.3. Japan
- 1.4. South Korea
- 1.5. Rest of Asia Pacific
-
2. North America
- 2.1. United States
- 2.2. Canada
- 2.3. Mexico
-
3. Europe
- 3.1. Germany
- 3.2. United Kingdom
- 3.3. Italy
- 3.4. France
- 3.5. Rest of Europe
-
4. Rest of the World
- 4.1. South America
- 4.2. Middle East and Africa
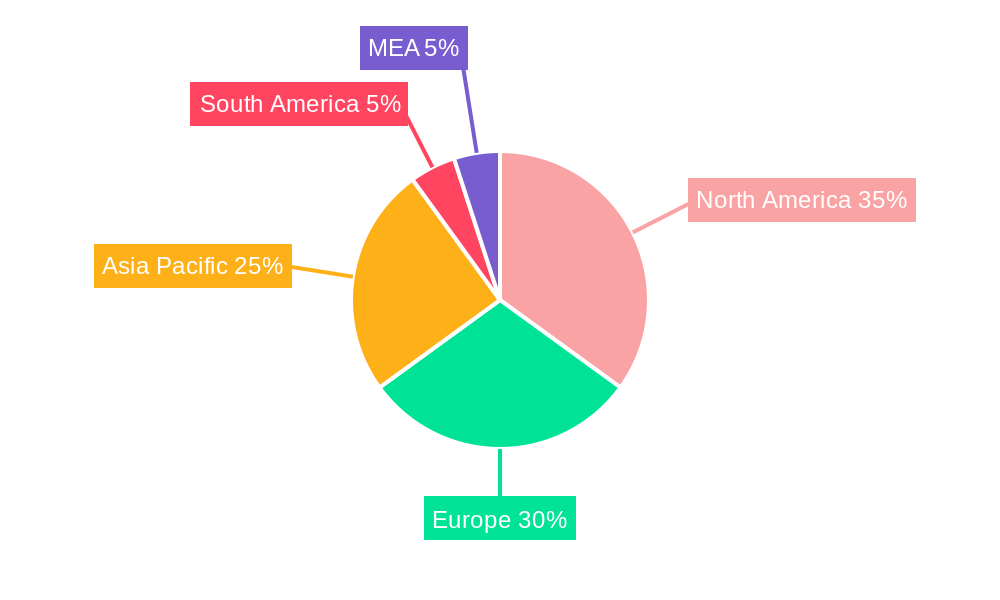
Liquid Hydrogen Industry Regional Market Share
Geographic Coverage of Liquid Hydrogen Industry
Liquid Hydrogen Industry REPORT HIGHLIGHTS
| Aspects | Details |
|---|---|
| Study Period | 2020-2034 |
| Base Year | 2025 |
| Estimated Year | 2026 |
| Forecast Period | 2026-2034 |
| Historical Period | 2020-2025 |
| Growth Rate | CAGR of 10.27% from 2020-2034 |
| Segmentation |
|
Table of Contents
- 1. Introduction
- 1.1. Research Scope
- 1.2. Market Segmentation
- 1.3. Research Objective
- 1.4. Definitions and Assumptions
- 2. Executive Summary
- 2.1. Market Snapshot
- 3. Market Dynamics
- 3.1. Market Drivers
- 3.2. Market Restrains
- 3.3. Market Trends
- 3.4. Market Opportunities
- 4. Market Factor Analysis
- 4.1. Porters Five Forces
- 4.1.1. Bargaining Power of Suppliers
- 4.1.2. Bargaining Power of Buyers
- 4.1.3. Threat of New Entrants
- 4.1.4. Threat of Substitutes
- 4.1.5. Competitive Rivalry
- 4.2. PESTEL analysis
- 4.3. BCG Analysis
- 4.3.1. Stars (High Growth, High Market Share)
- 4.3.2. Cash Cows (Low Growth, High Market Share)
- 4.3.3. Question Mark (High Growth, Low Market Share)
- 4.3.4. Dogs (Low Growth, Low Market Share)
- 4.4. Ansoff Matrix Analysis
- 4.5. Supply Chain Analysis
- 4.6. Regulatory Landscape
- 4.7. Current Market Potential and Opportunity Assessment (TAM–SAM–SOM Framework)
- 4.8. TIR Analyst Note
- 4.1. Porters Five Forces
- 5. Market Analysis, Insights and Forecast 2021-2033
- 5.1. Market Analysis, Insights and Forecast - by Distribution
- 5.1.1. Cryogenic Tank
- 5.1.2. High-Pressure Tube Trailers
- 5.2. Market Analysis, Insights and Forecast - by End-user Industry
- 5.2.1. Automotive
- 5.2.2. Aerospace (including Outer Space)
- 5.2.3. Marine
- 5.2.4. Other End-User Industries
- 5.3. Market Analysis, Insights and Forecast - by Region
- 5.3.1. Asia Pacific
- 5.3.2. North America
- 5.3.3. Europe
- 5.3.4. Rest of the World
- 5.1. Market Analysis, Insights and Forecast - by Distribution
- 6. Global Liquid Hydrogen Industry Analysis, Insights and Forecast, 2021-2033
- 6.1. Market Analysis, Insights and Forecast - by Distribution
- 6.1.1. Cryogenic Tank
- 6.1.2. High-Pressure Tube Trailers
- 6.2. Market Analysis, Insights and Forecast - by End-user Industry
- 6.2.1. Automotive
- 6.2.2. Aerospace (including Outer Space)
- 6.2.3. Marine
- 6.2.4. Other End-User Industries
- 6.1. Market Analysis, Insights and Forecast - by Distribution
- 7. Asia Pacific Liquid Hydrogen Industry Analysis, Insights and Forecast, 2020-2032
- 7.1. Market Analysis, Insights and Forecast - by Distribution
- 7.1.1. Cryogenic Tank
- 7.1.2. High-Pressure Tube Trailers
- 7.2. Market Analysis, Insights and Forecast - by End-user Industry
- 7.2.1. Automotive
- 7.2.2. Aerospace (including Outer Space)
- 7.2.3. Marine
- 7.2.4. Other End-User Industries
- 7.1. Market Analysis, Insights and Forecast - by Distribution
- 8. North America Liquid Hydrogen Industry Analysis, Insights and Forecast, 2020-2032
- 8.1. Market Analysis, Insights and Forecast - by Distribution
- 8.1.1. Cryogenic Tank
- 8.1.2. High-Pressure Tube Trailers
- 8.2. Market Analysis, Insights and Forecast - by End-user Industry
- 8.2.1. Automotive
- 8.2.2. Aerospace (including Outer Space)
- 8.2.3. Marine
- 8.2.4. Other End-User Industries
- 8.1. Market Analysis, Insights and Forecast - by Distribution
- 9. Europe Liquid Hydrogen Industry Analysis, Insights and Forecast, 2020-2032
- 9.1. Market Analysis, Insights and Forecast - by Distribution
- 9.1.1. Cryogenic Tank
- 9.1.2. High-Pressure Tube Trailers
- 9.2. Market Analysis, Insights and Forecast - by End-user Industry
- 9.2.1. Automotive
- 9.2.2. Aerospace (including Outer Space)
- 9.2.3. Marine
- 9.2.4. Other End-User Industries
- 9.1. Market Analysis, Insights and Forecast - by Distribution
- 10. Rest of the World Liquid Hydrogen Industry Analysis, Insights and Forecast, 2020-2032
- 10.1. Market Analysis, Insights and Forecast - by Distribution
- 10.1.1. Cryogenic Tank
- 10.1.2. High-Pressure Tube Trailers
- 10.2. Market Analysis, Insights and Forecast - by End-user Industry
- 10.2.1. Automotive
- 10.2.2. Aerospace (including Outer Space)
- 10.2.3. Marine
- 10.2.4. Other End-User Industries
- 10.1. Market Analysis, Insights and Forecast - by Distribution
- 11. Competitive Analysis
- 11.1. Company Profiles
- 11.1.1 Linde PLC
- 11.1.1.1. Company Overview
- 11.1.1.2. Products
- 11.1.1.3. Company Financials
- 11.1.1.4. SWOT Analysis
- 11.1.2 Air Products and Chemicals Inc
- 11.1.2.1. Company Overview
- 11.1.2.2. Products
- 11.1.2.3. Company Financials
- 11.1.2.4. SWOT Analysis
- 11.1.3 Universal Industrial Gases Inc *List Not Exhaustive
- 11.1.3.1. Company Overview
- 11.1.3.2. Products
- 11.1.3.3. Company Financials
- 11.1.3.4. SWOT Analysis
- 11.1.4 Messer Group GMBH
- 11.1.4.1. Company Overview
- 11.1.4.2. Products
- 11.1.4.3. Company Financials
- 11.1.4.4. SWOT Analysis
- 11.1.5 Iwatani Corporation
- 11.1.5.1. Company Overview
- 11.1.5.2. Products
- 11.1.5.3. Company Financials
- 11.1.5.4. SWOT Analysis
- 11.1.6 Air Liquide
- 11.1.6.1. Company Overview
- 11.1.6.2. Products
- 11.1.6.3. Company Financials
- 11.1.6.4. SWOT Analysis
- 11.1.7 Nippon Sanso Holdings Corporation
- 11.1.7.1. Company Overview
- 11.1.7.2. Products
- 11.1.7.3. Company Financials
- 11.1.7.4. SWOT Analysis
- 11.1.8 Nippon Sanso Holdings Corporation
- 11.1.8.1. Company Overview
- 11.1.8.2. Products
- 11.1.8.3. Company Financials
- 11.1.8.4. SWOT Analysis
- 11.1.9 Praxair Technology Inc.
- 11.1.9.1. Company Overview
- 11.1.9.2. Products
- 11.1.9.3. Company Financials
- 11.1.9.4. SWOT Analysis
- 11.1.10 ITM Power
- 11.1.10.1. Company Overview
- 11.1.10.2. Products
- 11.1.10.3. Company Financials
- 11.1.10.4. SWOT Analysis
- 11.1.1 Linde PLC
- 11.2. Market Entropy
- 11.2.1 Company's Key Areas Served
- 11.2.2 Recent Developments
- 11.3. Company Market Share Analysis 2025
- 11.3.1 Top 5 Companies Market Share Analysis
- 11.3.2 Top 3 Companies Market Share Analysis
- 11.4. List of Potential Customers
- 12. Research Methodology
List of Figures
- Figure 1: Global Liquid Hydrogen Industry Revenue Breakdown (Million, %) by Region 2025 & 2033
- Figure 2: Global Liquid Hydrogen Industry Volume Breakdown (kilotons, %) by Region 2025 & 2033
- Figure 3: Asia Pacific Liquid Hydrogen Industry Revenue (Million), by Distribution 2025 & 2033
- Figure 4: Asia Pacific Liquid Hydrogen Industry Volume (kilotons), by Distribution 2025 & 2033
- Figure 5: Asia Pacific Liquid Hydrogen Industry Revenue Share (%), by Distribution 2025 & 2033
- Figure 6: Asia Pacific Liquid Hydrogen Industry Volume Share (%), by Distribution 2025 & 2033
- Figure 7: Asia Pacific Liquid Hydrogen Industry Revenue (Million), by End-user Industry 2025 & 2033
- Figure 8: Asia Pacific Liquid Hydrogen Industry Volume (kilotons), by End-user Industry 2025 & 2033
- Figure 9: Asia Pacific Liquid Hydrogen Industry Revenue Share (%), by End-user Industry 2025 & 2033
- Figure 10: Asia Pacific Liquid Hydrogen Industry Volume Share (%), by End-user Industry 2025 & 2033
- Figure 11: Asia Pacific Liquid Hydrogen Industry Revenue (Million), by Country 2025 & 2033
- Figure 12: Asia Pacific Liquid Hydrogen Industry Volume (kilotons), by Country 2025 & 2033
- Figure 13: Asia Pacific Liquid Hydrogen Industry Revenue Share (%), by Country 2025 & 2033
- Figure 14: Asia Pacific Liquid Hydrogen Industry Volume Share (%), by Country 2025 & 2033
- Figure 15: North America Liquid Hydrogen Industry Revenue (Million), by Distribution 2025 & 2033
- Figure 16: North America Liquid Hydrogen Industry Volume (kilotons), by Distribution 2025 & 2033
- Figure 17: North America Liquid Hydrogen Industry Revenue Share (%), by Distribution 2025 & 2033
- Figure 18: North America Liquid Hydrogen Industry Volume Share (%), by Distribution 2025 & 2033
- Figure 19: North America Liquid Hydrogen Industry Revenue (Million), by End-user Industry 2025 & 2033
- Figure 20: North America Liquid Hydrogen Industry Volume (kilotons), by End-user Industry 2025 & 2033
- Figure 21: North America Liquid Hydrogen Industry Revenue Share (%), by End-user Industry 2025 & 2033
- Figure 22: North America Liquid Hydrogen Industry Volume Share (%), by End-user Industry 2025 & 2033
- Figure 23: North America Liquid Hydrogen Industry Revenue (Million), by Country 2025 & 2033
- Figure 24: North America Liquid Hydrogen Industry Volume (kilotons), by Country 2025 & 2033
- Figure 25: North America Liquid Hydrogen Industry Revenue Share (%), by Country 2025 & 2033
- Figure 26: North America Liquid Hydrogen Industry Volume Share (%), by Country 2025 & 2033
- Figure 27: Europe Liquid Hydrogen Industry Revenue (Million), by Distribution 2025 & 2033
- Figure 28: Europe Liquid Hydrogen Industry Volume (kilotons), by Distribution 2025 & 2033
- Figure 29: Europe Liquid Hydrogen Industry Revenue Share (%), by Distribution 2025 & 2033
- Figure 30: Europe Liquid Hydrogen Industry Volume Share (%), by Distribution 2025 & 2033
- Figure 31: Europe Liquid Hydrogen Industry Revenue (Million), by End-user Industry 2025 & 2033
- Figure 32: Europe Liquid Hydrogen Industry Volume (kilotons), by End-user Industry 2025 & 2033
- Figure 33: Europe Liquid Hydrogen Industry Revenue Share (%), by End-user Industry 2025 & 2033
- Figure 34: Europe Liquid Hydrogen Industry Volume Share (%), by End-user Industry 2025 & 2033
- Figure 35: Europe Liquid Hydrogen Industry Revenue (Million), by Country 2025 & 2033
- Figure 36: Europe Liquid Hydrogen Industry Volume (kilotons), by Country 2025 & 2033
- Figure 37: Europe Liquid Hydrogen Industry Revenue Share (%), by Country 2025 & 2033
- Figure 38: Europe Liquid Hydrogen Industry Volume Share (%), by Country 2025 & 2033
- Figure 39: Rest of the World Liquid Hydrogen Industry Revenue (Million), by Distribution 2025 & 2033
- Figure 40: Rest of the World Liquid Hydrogen Industry Volume (kilotons), by Distribution 2025 & 2033
- Figure 41: Rest of the World Liquid Hydrogen Industry Revenue Share (%), by Distribution 2025 & 2033
- Figure 42: Rest of the World Liquid Hydrogen Industry Volume Share (%), by Distribution 2025 & 2033
- Figure 43: Rest of the World Liquid Hydrogen Industry Revenue (Million), by End-user Industry 2025 & 2033
- Figure 44: Rest of the World Liquid Hydrogen Industry Volume (kilotons), by End-user Industry 2025 & 2033
- Figure 45: Rest of the World Liquid Hydrogen Industry Revenue Share (%), by End-user Industry 2025 & 2033
- Figure 46: Rest of the World Liquid Hydrogen Industry Volume Share (%), by End-user Industry 2025 & 2033
- Figure 47: Rest of the World Liquid Hydrogen Industry Revenue (Million), by Country 2025 & 2033
- Figure 48: Rest of the World Liquid Hydrogen Industry Volume (kilotons), by Country 2025 & 2033
- Figure 49: Rest of the World Liquid Hydrogen Industry Revenue Share (%), by Country 2025 & 2033
- Figure 50: Rest of the World Liquid Hydrogen Industry Volume Share (%), by Country 2025 & 2033
List of Tables
- Table 1: Global Liquid Hydrogen Industry Revenue Million Forecast, by Distribution 2020 & 2033
- Table 2: Global Liquid Hydrogen Industry Volume kilotons Forecast, by Distribution 2020 & 2033
- Table 3: Global Liquid Hydrogen Industry Revenue Million Forecast, by End-user Industry 2020 & 2033
- Table 4: Global Liquid Hydrogen Industry Volume kilotons Forecast, by End-user Industry 2020 & 2033
- Table 5: Global Liquid Hydrogen Industry Revenue Million Forecast, by Region 2020 & 2033
- Table 6: Global Liquid Hydrogen Industry Volume kilotons Forecast, by Region 2020 & 2033
- Table 7: Global Liquid Hydrogen Industry Revenue Million Forecast, by Distribution 2020 & 2033
- Table 8: Global Liquid Hydrogen Industry Volume kilotons Forecast, by Distribution 2020 & 2033
- Table 9: Global Liquid Hydrogen Industry Revenue Million Forecast, by End-user Industry 2020 & 2033
- Table 10: Global Liquid Hydrogen Industry Volume kilotons Forecast, by End-user Industry 2020 & 2033
- Table 11: Global Liquid Hydrogen Industry Revenue Million Forecast, by Country 2020 & 2033
- Table 12: Global Liquid Hydrogen Industry Volume kilotons Forecast, by Country 2020 & 2033
- Table 13: China Liquid Hydrogen Industry Revenue (Million) Forecast, by Application 2020 & 2033
- Table 14: China Liquid Hydrogen Industry Volume (kilotons) Forecast, by Application 2020 & 2033
- Table 15: India Liquid Hydrogen Industry Revenue (Million) Forecast, by Application 2020 & 2033
- Table 16: India Liquid Hydrogen Industry Volume (kilotons) Forecast, by Application 2020 & 2033
- Table 17: Japan Liquid Hydrogen Industry Revenue (Million) Forecast, by Application 2020 & 2033
- Table 18: Japan Liquid Hydrogen Industry Volume (kilotons) Forecast, by Application 2020 & 2033
- Table 19: South Korea Liquid Hydrogen Industry Revenue (Million) Forecast, by Application 2020 & 2033
- Table 20: South Korea Liquid Hydrogen Industry Volume (kilotons) Forecast, by Application 2020 & 2033
- Table 21: Rest of Asia Pacific Liquid Hydrogen Industry Revenue (Million) Forecast, by Application 2020 & 2033
- Table 22: Rest of Asia Pacific Liquid Hydrogen Industry Volume (kilotons) Forecast, by Application 2020 & 2033
- Table 23: Global Liquid Hydrogen Industry Revenue Million Forecast, by Distribution 2020 & 2033
- Table 24: Global Liquid Hydrogen Industry Volume kilotons Forecast, by Distribution 2020 & 2033
- Table 25: Global Liquid Hydrogen Industry Revenue Million Forecast, by End-user Industry 2020 & 2033
- Table 26: Global Liquid Hydrogen Industry Volume kilotons Forecast, by End-user Industry 2020 & 2033
- Table 27: Global Liquid Hydrogen Industry Revenue Million Forecast, by Country 2020 & 2033
- Table 28: Global Liquid Hydrogen Industry Volume kilotons Forecast, by Country 2020 & 2033
- Table 29: United States Liquid Hydrogen Industry Revenue (Million) Forecast, by Application 2020 & 2033
- Table 30: United States Liquid Hydrogen Industry Volume (kilotons) Forecast, by Application 2020 & 2033
- Table 31: Canada Liquid Hydrogen Industry Revenue (Million) Forecast, by Application 2020 & 2033
- Table 32: Canada Liquid Hydrogen Industry Volume (kilotons) Forecast, by Application 2020 & 2033
- Table 33: Mexico Liquid Hydrogen Industry Revenue (Million) Forecast, by Application 2020 & 2033
- Table 34: Mexico Liquid Hydrogen Industry Volume (kilotons) Forecast, by Application 2020 & 2033
- Table 35: Global Liquid Hydrogen Industry Revenue Million Forecast, by Distribution 2020 & 2033
- Table 36: Global Liquid Hydrogen Industry Volume kilotons Forecast, by Distribution 2020 & 2033
- Table 37: Global Liquid Hydrogen Industry Revenue Million Forecast, by End-user Industry 2020 & 2033
- Table 38: Global Liquid Hydrogen Industry Volume kilotons Forecast, by End-user Industry 2020 & 2033
- Table 39: Global Liquid Hydrogen Industry Revenue Million Forecast, by Country 2020 & 2033
- Table 40: Global Liquid Hydrogen Industry Volume kilotons Forecast, by Country 2020 & 2033
- Table 41: Germany Liquid Hydrogen Industry Revenue (Million) Forecast, by Application 2020 & 2033
- Table 42: Germany Liquid Hydrogen Industry Volume (kilotons) Forecast, by Application 2020 & 2033
- Table 43: United Kingdom Liquid Hydrogen Industry Revenue (Million) Forecast, by Application 2020 & 2033
- Table 44: United Kingdom Liquid Hydrogen Industry Volume (kilotons) Forecast, by Application 2020 & 2033
- Table 45: Italy Liquid Hydrogen Industry Revenue (Million) Forecast, by Application 2020 & 2033
- Table 46: Italy Liquid Hydrogen Industry Volume (kilotons) Forecast, by Application 2020 & 2033
- Table 47: France Liquid Hydrogen Industry Revenue (Million) Forecast, by Application 2020 & 2033
- Table 48: France Liquid Hydrogen Industry Volume (kilotons) Forecast, by Application 2020 & 2033
- Table 49: Rest of Europe Liquid Hydrogen Industry Revenue (Million) Forecast, by Application 2020 & 2033
- Table 50: Rest of Europe Liquid Hydrogen Industry Volume (kilotons) Forecast, by Application 2020 & 2033
- Table 51: Global Liquid Hydrogen Industry Revenue Million Forecast, by Distribution 2020 & 2033
- Table 52: Global Liquid Hydrogen Industry Volume kilotons Forecast, by Distribution 2020 & 2033
- Table 53: Global Liquid Hydrogen Industry Revenue Million Forecast, by End-user Industry 2020 & 2033
- Table 54: Global Liquid Hydrogen Industry Volume kilotons Forecast, by End-user Industry 2020 & 2033
- Table 55: Global Liquid Hydrogen Industry Revenue Million Forecast, by Country 2020 & 2033
- Table 56: Global Liquid Hydrogen Industry Volume kilotons Forecast, by Country 2020 & 2033
- Table 57: South America Liquid Hydrogen Industry Revenue (Million) Forecast, by Application 2020 & 2033
- Table 58: South America Liquid Hydrogen Industry Volume (kilotons) Forecast, by Application 2020 & 2033
- Table 59: Middle East and Africa Liquid Hydrogen Industry Revenue (Million) Forecast, by Application 2020 & 2033
- Table 60: Middle East and Africa Liquid Hydrogen Industry Volume (kilotons) Forecast, by Application 2020 & 2033
Frequently Asked Questions
1. What is the projected Compound Annual Growth Rate (CAGR) of the Liquid Hydrogen Industry?
The projected CAGR is approximately 10.27%.
2. Which companies are prominent players in the Liquid Hydrogen Industry?
Key companies in the market include Linde PLC, Air Products and Chemicals Inc, Universal Industrial Gases Inc *List Not Exhaustive, Messer Group GMBH, Iwatani Corporation, Air Liquide, Nippon Sanso Holdings Corporation, Nippon Sanso Holdings Corporation , Praxair Technology Inc. , ITM Power.
3. What are the main segments of the Liquid Hydrogen Industry?
The market segments include Distribution, End-user Industry.
4. Can you provide details about the market size?
The market size is estimated to be USD 38400 Million as of 2022.
5. What are some drivers contributing to market growth?
Growing Demand for Liquid Hydrogen for Space Exploration; Increasing Adoption of Hydrogen Fuel Cell in Commercial Vehicle.
6. What are the notable trends driving market growth?
Aerospace Industry to Dominate the Market.
7. Are there any restraints impacting market growth?
High Cost Associated with Handling and Storage; Other Restraints.
8. Can you provide examples of recent developments in the market?
Mar 2023: Iwatani Corporation and ENEOS Corporation were working to deliver a "Liquefied Hydrogen Supply Chain Commercialization Demonstration Project. The project aims to develop marine transportation technologies of liquefied clean hydrogen, which will help to achieve a hydrogen supply cost of 30 JPY/Nm3 by 2030.
9. What pricing options are available for accessing the report?
Pricing options include single-user, multi-user, and enterprise licenses priced at USD 4750, USD 5250, and USD 8750 respectively.
10. Is the market size provided in terms of value or volume?
The market size is provided in terms of value, measured in Million and volume, measured in kilotons.
11. Are there any specific market keywords associated with the report?
Yes, the market keyword associated with the report is "Liquid Hydrogen Industry," which aids in identifying and referencing the specific market segment covered.
12. How do I determine which pricing option suits my needs best?
The pricing options vary based on user requirements and access needs. Individual users may opt for single-user licenses, while businesses requiring broader access may choose multi-user or enterprise licenses for cost-effective access to the report.
13. Are there any additional resources or data provided in the Liquid Hydrogen Industry report?
While the report offers comprehensive insights, it's advisable to review the specific contents or supplementary materials provided to ascertain if additional resources or data are available.
14. How can I stay updated on further developments or reports in the Liquid Hydrogen Industry?
To stay informed about further developments, trends, and reports in the Liquid Hydrogen Industry, consider subscribing to industry newsletters, following relevant companies and organizations, or regularly checking reputable industry news sources and publications.
Methodology
Step 1 - Identification of Relevant Samples Size from Population Database


Step 2 - Approaches for Defining Global Market Size (Value, Volume* & Price*)

Note*: In applicable scenarios
Step 3 - Data Sources
Primary Research
- Web Analytics
- Survey Reports
- Research Institute
- Latest Research Reports
- Opinion Leaders
Secondary Research
- Annual Reports
- White Paper
- Latest Press Release
- Industry Association
- Paid Database
- Investor Presentations

Step 4 - Data Triangulation
Involves using different sources of information in order to increase the validity of a study
These sources are likely to be stakeholders in a program - participants, other researchers, program staff, other community members, and so on.
Then we put all data in single framework & apply various statistical tools to find out the dynamic on the market.
During the analysis stage, feedback from the stakeholder groups would be compared to determine areas of agreement as well as areas of divergence