

Key Insights
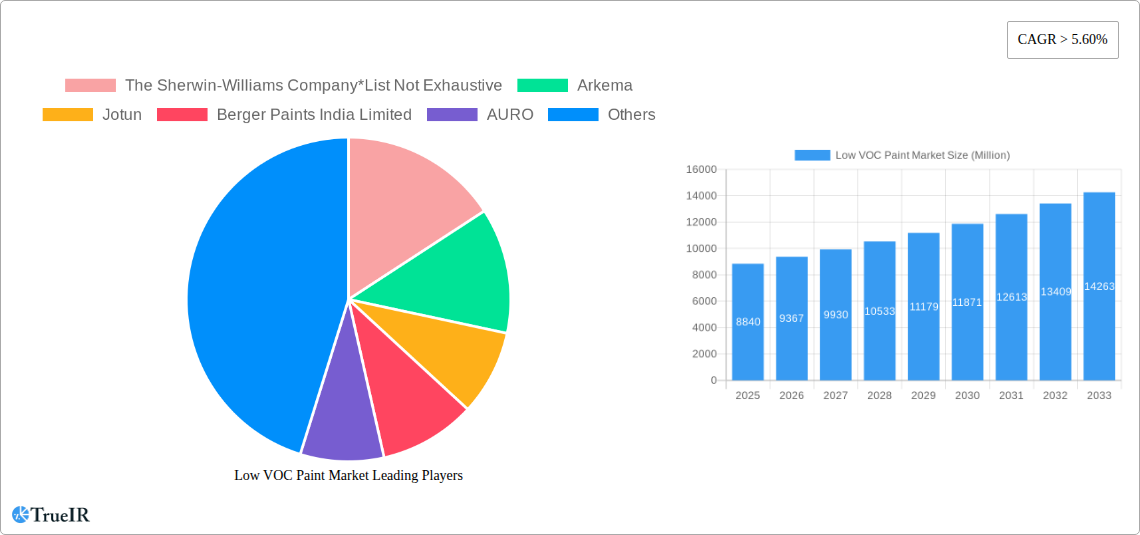
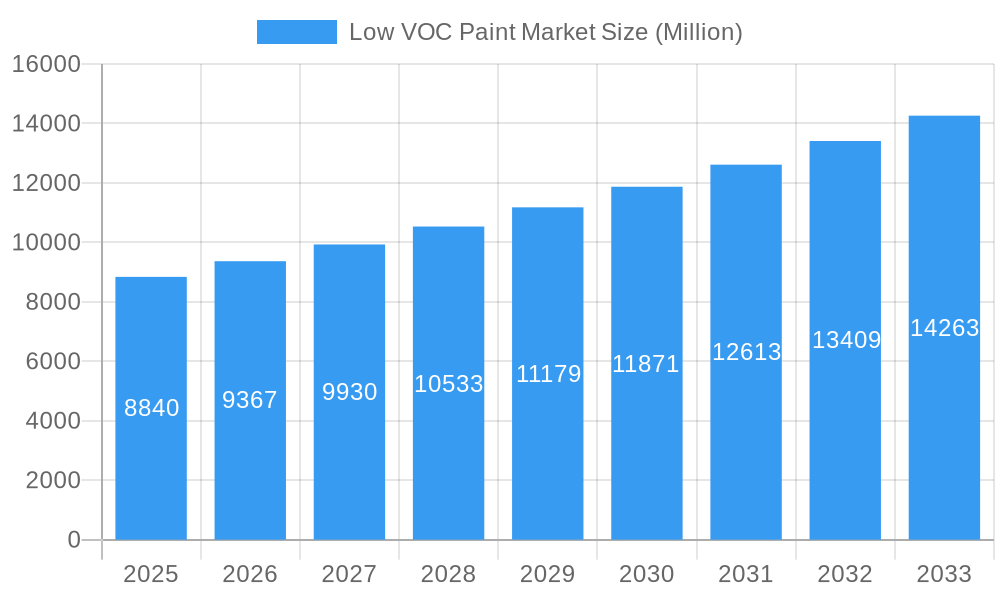
The low VOC paint market, valued at $8.84 billion in 2025, is experiencing robust growth, projected to expand at a CAGR exceeding 5.60% from 2025 to 2033. This growth is fueled by stringent environmental regulations globally, increasing consumer awareness of indoor air quality, and a rising demand for eco-friendly building materials across various sectors. The architectural and decorative segment currently dominates the market, driven by new construction and renovation projects in residential and commercial spaces. However, significant growth potential lies within the automotive refinish and general industrial sectors, as manufacturers increasingly adopt low-VOC paints to meet sustainability targets and reduce their carbon footprint. Water-borne formulations currently hold the largest market share due to their ease of application and lower environmental impact compared to solvent-borne alternatives. The Asia-Pacific region, particularly China and India, is expected to witness the fastest growth due to rapid urbanization and industrialization, coupled with rising disposable incomes. Competition is intense, with major players like Sherwin-Williams, PPG Industries, Akzo Nobel, and Asian Paints vying for market share through innovation in product formulations, expansion into new markets, and strategic acquisitions. The market also witnesses the rise of smaller, specialized companies focusing on niche applications and natural or zero-VOC formulations, catering to the growing demand for premium, high-performance, and environmentally conscious products.
Low VOC Paint Market Market Size (In Billion)
The market's restraints include the higher initial cost of low-VOC paints compared to conventional options and potential performance limitations in certain applications. However, these challenges are being mitigated through technological advancements, resulting in improved performance characteristics and cost reductions. Future trends point towards a continued shift towards powder coatings due to their superior durability and reduced environmental impact. Furthermore, the development of bio-based and recycled content paints is expected to gain traction, driven by growing sustainability concerns and the circular economy trend. The increasing adoption of digital technologies for paint application and color matching will also reshape the market landscape in the coming years, fostering efficiency gains and improved customer experience. The market's steady expansion indicates a positive outlook, driven by an ongoing convergence of regulatory pressures, heightened consumer awareness, and continuous technological innovations.
Low VOC Paint Market Company Market Share
Low VOC Paint Market: A Comprehensive Report 2019-2033
This comprehensive report provides a detailed analysis of the Low VOC Paint Market from 2019 to 2033, offering valuable insights for stakeholders across the value chain. The study covers market size, segmentation, competitive landscape, growth drivers, challenges, and future outlook, leveraging extensive data analysis and expert perspectives. This report is crucial for businesses seeking to navigate the evolving landscape of environmentally conscious coatings and capitalize on emerging opportunities. The market is projected to reach xx Million by 2033, exhibiting a healthy CAGR of xx% during the forecast period (2025-2033).
Low VOC Paint Market Structure & Competitive Landscape
The Low VOC paint market exhibits a moderately concentrated structure, with key players like The Sherwin-Williams Company, Sherwin-Williams, PPG Industries Inc, PPG Industries, Akzo Nobel N.V., and BASF SE holding significant market share. However, the market also features a number of regional and niche players, creating a dynamic competitive landscape. The market concentration ratio (CR4) is estimated at xx% in 2025.
Innovation Drivers: Increased demand for environmentally friendly products, stringent VOC regulations, and advancements in water-borne and powder coating technologies are key innovation drivers.
Regulatory Impacts: Government regulations concerning VOC emissions are significantly shaping market dynamics, incentivizing the adoption of low-VOC paints across various applications. These regulations vary across regions, presenting both opportunities and challenges for manufacturers.
Product Substitutes: While traditional high-VOC paints remain available, their market share is steadily declining due to environmental concerns and regulatory pressure. The increasing availability of natural and bio-based alternatives further intensifies competition.
End-User Segmentation: The market is broadly segmented by application, including Architecture & Decorative, General Industrial, Automotive OEM, Automotive Refinish, Marine, Consumer Durables, and Other (Pharmaceuticals, Electronics, etc.). The Architecture & Decorative segment currently holds the largest market share.
M&A Trends: The past five years have witnessed xx major mergers and acquisitions in the Low VOC paint market, primarily driven by companies seeking to expand their product portfolios and geographic reach. This trend is expected to continue, leading to further consolidation in the market.
Low VOC Paint Market Market Trends & Opportunities
The global Low VOC paint market is experiencing robust growth, driven by increasing environmental awareness, stricter emission regulations, and a growing preference for healthier indoor environments. The market size is projected to reach xx Million by 2025, with a CAGR of xx% from 2019 to 2024. This growth is particularly pronounced in developing economies, where rising disposable incomes and urbanization are fueling construction and infrastructure development.
Technological advancements, such as the development of innovative water-borne and powder coating technologies, are further driving market expansion. Consumer preference for eco-friendly and sustainable products is also significantly influencing market trends. The market penetration rate of Low VOC paints is estimated at xx% in 2025, indicating substantial room for growth. Competitive dynamics are characterized by product innovation, brand building, and strategic partnerships.
Dominant Markets & Segments in Low VOC Paint Market
Leading Region/Country: The North American region currently holds the largest market share, followed by Europe and Asia-Pacific. However, the Asia-Pacific region is anticipated to witness the fastest growth rate during the forecast period due to rapid industrialization and urbanization.
Dominant Segments:
- Type: Water-borne Low-VOC paints dominate the market due to their ease of application, lower cost, and reduced environmental impact.
- Formulation Type: Water-borne formulations hold the largest market share, driven by their environmental benefits and superior performance characteristics compared to solvent-borne options.
- Application: The Architecture and Decorative segment is the largest, fueled by the growth of the construction industry and increased demand for environmentally friendly paints for residential and commercial buildings.
Key Growth Drivers:
- Stringent environmental regulations: Governments worldwide are increasingly implementing strict regulations on VOC emissions, driving the adoption of Low VOC paints.
- Rising consumer awareness: Growing awareness of the health risks associated with high-VOC paints is prompting consumers to choose eco-friendly alternatives.
- Infrastructure development: Rapid urbanization and infrastructure projects in developing economies are boosting the demand for paints.
Low VOC Paint Market Product Analysis
Technological advancements are driving product innovation in the Low VOC paint market. Manufacturers are focusing on developing high-performance water-borne and powder coatings with improved durability, color retention, and application properties. The emphasis is on creating products that meet stringent environmental regulations while delivering superior performance and aesthetics. These innovations are expanding the market's reach into new applications and enhancing the competitive landscape.
Key Drivers, Barriers & Challenges in Low VOC Paint Market
Key Drivers:
- Increasing environmental regulations: Stringent regulations on VOC emissions are a major driver of market growth.
- Growing consumer demand for eco-friendly products: Consumer awareness of health and environmental issues is leading to increased demand for low-VOC paints.
- Technological advancements: Innovations in water-borne and powder coating technologies are improving the performance and affordability of low-VOC paints.
Challenges and Restraints:
- Higher production costs: The production of low-VOC paints can be more expensive than traditional high-VOC paints.
- Limited availability of raw materials: The supply of some raw materials used in low-VOC paints can be limited, potentially impacting production and pricing.
- Performance limitations: Some low-VOC paints may have slightly inferior performance characteristics compared to high-VOC paints, though this gap is narrowing with technological advancements. The estimated impact on market growth due to these challenges is approximately xx%.
Growth Drivers in the Low VOC Paint Market Market
Stringent environmental regulations, rising consumer awareness of health and environmental concerns, and technological advancements in water-borne and powder coatings are the primary drivers of the Low VOC paint market's growth. The increasing demand from the construction and automotive industries further fuels this growth. Government incentives and support for sustainable building practices also contribute positively to market expansion.
Challenges Impacting Low VOC Paint Growth
Challenges include the higher production costs compared to traditional paints, potential performance limitations in certain applications, and the limited availability of some raw materials. Regulatory complexities and stringent testing requirements can also pose challenges for manufacturers. Competition from established players and new entrants is another factor influencing market dynamics.
Key Players Shaping the Low VOC Paint Market Market
- The Sherwin-Williams Company, Sherwin-Williams
- Arkema
- Jotun
- Berger Paints India Limited
- AURO
- American Formulating & Manufacturing
- PPG Industries Inc, PPG Industries
- Benjamin Moore & Co
- Nippon Paint Holdings Co Ltd
- BASF SE
- Cloverdale Paint Inc
- Kalekim
- Akzo Nobel N V
- BioShield Paint Company
- Crown Trade
- Axalta Coating Systems LLC
- Asian Paints
- Kansai Paint Co Ltd
- Fine Paints of Europe
Significant Low VOC Paint Market Industry Milestones
- 2020: Increased focus on sustainable building practices by several governments globally.
- 2021: Launch of several new low-VOC paint formulations with improved performance characteristics.
- 2022: Several key players invested heavily in R&D to improve the quality and affordability of low-VOC paints.
- 2023: Merger of two smaller paint manufacturers, leading to increased market consolidation.
Future Outlook for Low VOC Paint Market Market
The Low VOC paint market is poised for continued growth, driven by the factors outlined above. Strategic opportunities exist for companies to develop innovative products that meet evolving consumer preferences and address the challenges related to sustainability and performance. The market’s expansion into new applications, particularly in high-growth regions, presents significant potential for future growth. The market is expected to maintain a positive growth trajectory, with continued innovation and increased adoption driving market expansion in the years to come.
Low VOC Paint Market Segmentation
-
1. Type
- 1.1. Low-VOC
- 1.2. No or Zero VOC
- 1.3. Natural
-
2. Formulation Type
- 2.1. Water-borne
- 2.2. Solvent-borne
- 2.3. Powder
-
3. Application
- 3.1. Architecture and Decorative
- 3.2. General Industrial
- 3.3. Automotive OEM
- 3.4. Automotive Refinish
- 3.5. Marine
- 3.6. Consumer Durables
- 3.7. Other Ap
Low VOC Paint Market Segmentation By Geography
-
1. Asia Pacific
- 1.1. China
- 1.2. India
- 1.3. Japan
- 1.4. South Korea
- 1.5. Rest of Asia Pacific
-
2. North America
- 2.1. United States
- 2.2. Canada
- 2.3. Mexico
-
3. Europe
- 3.1. Germany
- 3.2. United Kingdom
- 3.3. France
- 3.4. Italy
- 3.5. Rest of Europe
-
4. South America
- 4.1. Brazil
- 4.2. Argentina
- 4.3. Rest of South America
-
5. Middle East and Africa
- 5.1. Saudi Arabia
- 5.2. South Africa
- 5.3. Rest of Middle East and Africa
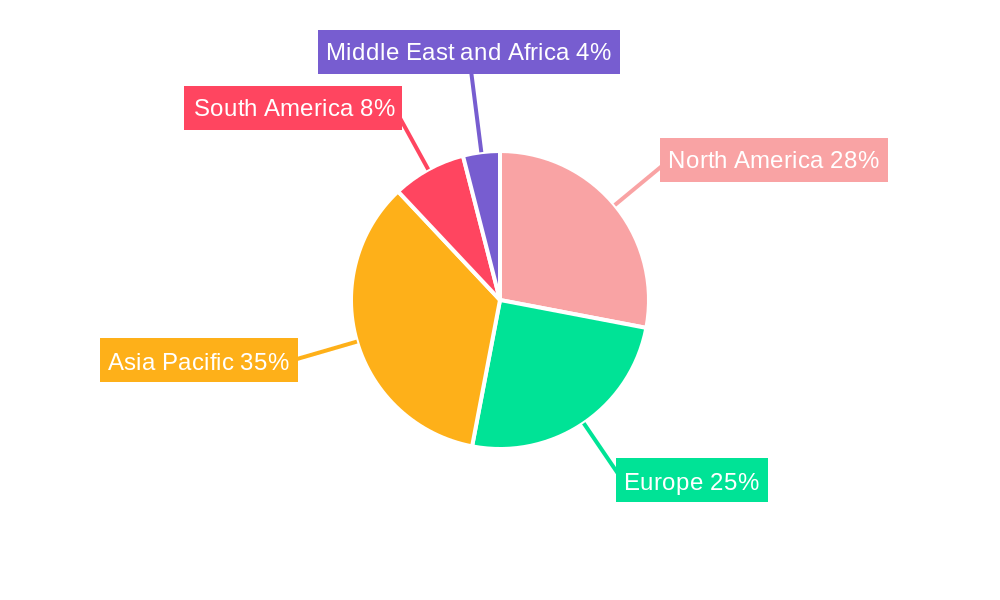
Low VOC Paint Market Regional Market Share
Geographic Coverage of Low VOC Paint Market
Low VOC Paint Market REPORT HIGHLIGHTS
| Aspects | Details |
|---|---|
| Study Period | 2020-2034 |
| Base Year | 2025 |
| Estimated Year | 2026 |
| Forecast Period | 2026-2034 |
| Historical Period | 2020-2025 |
| Growth Rate | CAGR of > 5.60% from 2020-2034 |
| Segmentation |
|
Table of Contents
- 1. Introduction
- 1.1. Research Scope
- 1.2. Market Segmentation
- 1.3. Research Objective
- 1.4. Definitions and Assumptions
- 2. Executive Summary
- 2.1. Market Snapshot
- 3. Market Dynamics
- 3.1. Market Drivers
- 3.2. Market Restrains
- 3.3. Market Trends
- 3.4. Market Opportunities
- 4. Market Factor Analysis
- 4.1. Porters Five Forces
- 4.1.1. Bargaining Power of Suppliers
- 4.1.2. Bargaining Power of Buyers
- 4.1.3. Threat of New Entrants
- 4.1.4. Threat of Substitutes
- 4.1.5. Competitive Rivalry
- 4.2. PESTEL analysis
- 4.3. BCG Analysis
- 4.3.1. Stars (High Growth, High Market Share)
- 4.3.2. Cash Cows (Low Growth, High Market Share)
- 4.3.3. Question Mark (High Growth, Low Market Share)
- 4.3.4. Dogs (Low Growth, Low Market Share)
- 4.4. Ansoff Matrix Analysis
- 4.5. Supply Chain Analysis
- 4.6. Regulatory Landscape
- 4.7. Current Market Potential and Opportunity Assessment (TAM–SAM–SOM Framework)
- 4.8. TIR Analyst Note
- 4.1. Porters Five Forces
- 5. Market Analysis, Insights and Forecast 2021-2033
- 5.1. Market Analysis, Insights and Forecast - by Type
- 5.1.1. Low-VOC
- 5.1.2. No or Zero VOC
- 5.1.3. Natural
- 5.2. Market Analysis, Insights and Forecast - by Formulation Type
- 5.2.1. Water-borne
- 5.2.2. Solvent-borne
- 5.2.3. Powder
- 5.3. Market Analysis, Insights and Forecast - by Application
- 5.3.1. Architecture and Decorative
- 5.3.2. General Industrial
- 5.3.3. Automotive OEM
- 5.3.4. Automotive Refinish
- 5.3.5. Marine
- 5.3.6. Consumer Durables
- 5.3.7. Other Ap
- 5.4. Market Analysis, Insights and Forecast - by Region
- 5.4.1. Asia Pacific
- 5.4.2. North America
- 5.4.3. Europe
- 5.4.4. South America
- 5.4.5. Middle East and Africa
- 5.1. Market Analysis, Insights and Forecast - by Type
- 6. Global Low VOC Paint Market Analysis, Insights and Forecast, 2021-2033
- 6.1. Market Analysis, Insights and Forecast - by Type
- 6.1.1. Low-VOC
- 6.1.2. No or Zero VOC
- 6.1.3. Natural
- 6.2. Market Analysis, Insights and Forecast - by Formulation Type
- 6.2.1. Water-borne
- 6.2.2. Solvent-borne
- 6.2.3. Powder
- 6.3. Market Analysis, Insights and Forecast - by Application
- 6.3.1. Architecture and Decorative
- 6.3.2. General Industrial
- 6.3.3. Automotive OEM
- 6.3.4. Automotive Refinish
- 6.3.5. Marine
- 6.3.6. Consumer Durables
- 6.3.7. Other Ap
- 6.1. Market Analysis, Insights and Forecast - by Type
- 7. Asia Pacific Low VOC Paint Market Analysis, Insights and Forecast, 2020-2032
- 7.1. Market Analysis, Insights and Forecast - by Type
- 7.1.1. Low-VOC
- 7.1.2. No or Zero VOC
- 7.1.3. Natural
- 7.2. Market Analysis, Insights and Forecast - by Formulation Type
- 7.2.1. Water-borne
- 7.2.2. Solvent-borne
- 7.2.3. Powder
- 7.3. Market Analysis, Insights and Forecast - by Application
- 7.3.1. Architecture and Decorative
- 7.3.2. General Industrial
- 7.3.3. Automotive OEM
- 7.3.4. Automotive Refinish
- 7.3.5. Marine
- 7.3.6. Consumer Durables
- 7.3.7. Other Ap
- 7.1. Market Analysis, Insights and Forecast - by Type
- 8. North America Low VOC Paint Market Analysis, Insights and Forecast, 2020-2032
- 8.1. Market Analysis, Insights and Forecast - by Type
- 8.1.1. Low-VOC
- 8.1.2. No or Zero VOC
- 8.1.3. Natural
- 8.2. Market Analysis, Insights and Forecast - by Formulation Type
- 8.2.1. Water-borne
- 8.2.2. Solvent-borne
- 8.2.3. Powder
- 8.3. Market Analysis, Insights and Forecast - by Application
- 8.3.1. Architecture and Decorative
- 8.3.2. General Industrial
- 8.3.3. Automotive OEM
- 8.3.4. Automotive Refinish
- 8.3.5. Marine
- 8.3.6. Consumer Durables
- 8.3.7. Other Ap
- 8.1. Market Analysis, Insights and Forecast - by Type
- 9. Europe Low VOC Paint Market Analysis, Insights and Forecast, 2020-2032
- 9.1. Market Analysis, Insights and Forecast - by Type
- 9.1.1. Low-VOC
- 9.1.2. No or Zero VOC
- 9.1.3. Natural
- 9.2. Market Analysis, Insights and Forecast - by Formulation Type
- 9.2.1. Water-borne
- 9.2.2. Solvent-borne
- 9.2.3. Powder
- 9.3. Market Analysis, Insights and Forecast - by Application
- 9.3.1. Architecture and Decorative
- 9.3.2. General Industrial
- 9.3.3. Automotive OEM
- 9.3.4. Automotive Refinish
- 9.3.5. Marine
- 9.3.6. Consumer Durables
- 9.3.7. Other Ap
- 9.1. Market Analysis, Insights and Forecast - by Type
- 10. South America Low VOC Paint Market Analysis, Insights and Forecast, 2020-2032
- 10.1. Market Analysis, Insights and Forecast - by Type
- 10.1.1. Low-VOC
- 10.1.2. No or Zero VOC
- 10.1.3. Natural
- 10.2. Market Analysis, Insights and Forecast - by Formulation Type
- 10.2.1. Water-borne
- 10.2.2. Solvent-borne
- 10.2.3. Powder
- 10.3. Market Analysis, Insights and Forecast - by Application
- 10.3.1. Architecture and Decorative
- 10.3.2. General Industrial
- 10.3.3. Automotive OEM
- 10.3.4. Automotive Refinish
- 10.3.5. Marine
- 10.3.6. Consumer Durables
- 10.3.7. Other Ap
- 10.1. Market Analysis, Insights and Forecast - by Type
- 11. Middle East and Africa Low VOC Paint Market Analysis, Insights and Forecast, 2020-2032
- 11.1. Market Analysis, Insights and Forecast - by Type
- 11.1.1. Low-VOC
- 11.1.2. No or Zero VOC
- 11.1.3. Natural
- 11.2. Market Analysis, Insights and Forecast - by Formulation Type
- 11.2.1. Water-borne
- 11.2.2. Solvent-borne
- 11.2.3. Powder
- 11.3. Market Analysis, Insights and Forecast - by Application
- 11.3.1. Architecture and Decorative
- 11.3.2. General Industrial
- 11.3.3. Automotive OEM
- 11.3.4. Automotive Refinish
- 11.3.5. Marine
- 11.3.6. Consumer Durables
- 11.3.7. Other Ap
- 11.1. Market Analysis, Insights and Forecast - by Type
- 12. Competitive Analysis
- 12.1. Company Profiles
- 12.1.1 The Sherwin-Williams Company*List Not Exhaustive
- 12.1.1.1. Company Overview
- 12.1.1.2. Products
- 12.1.1.3. Company Financials
- 12.1.1.4. SWOT Analysis
- 12.1.2 Arkema
- 12.1.2.1. Company Overview
- 12.1.2.2. Products
- 12.1.2.3. Company Financials
- 12.1.2.4. SWOT Analysis
- 12.1.3 Jotun
- 12.1.3.1. Company Overview
- 12.1.3.2. Products
- 12.1.3.3. Company Financials
- 12.1.3.4. SWOT Analysis
- 12.1.4 Berger Paints India Limited
- 12.1.4.1. Company Overview
- 12.1.4.2. Products
- 12.1.4.3. Company Financials
- 12.1.4.4. SWOT Analysis
- 12.1.5 AURO
- 12.1.5.1. Company Overview
- 12.1.5.2. Products
- 12.1.5.3. Company Financials
- 12.1.5.4. SWOT Analysis
- 12.1.6 American Formulating & Manufacturing
- 12.1.6.1. Company Overview
- 12.1.6.2. Products
- 12.1.6.3. Company Financials
- 12.1.6.4. SWOT Analysis
- 12.1.7 PPG Industries Inc
- 12.1.7.1. Company Overview
- 12.1.7.2. Products
- 12.1.7.3. Company Financials
- 12.1.7.4. SWOT Analysis
- 12.1.8 Benjamin Moore & Co
- 12.1.8.1. Company Overview
- 12.1.8.2. Products
- 12.1.8.3. Company Financials
- 12.1.8.4. SWOT Analysis
- 12.1.9 Nippon Paint Holdings Co Ltd
- 12.1.9.1. Company Overview
- 12.1.9.2. Products
- 12.1.9.3. Company Financials
- 12.1.9.4. SWOT Analysis
- 12.1.10 BASF SE
- 12.1.10.1. Company Overview
- 12.1.10.2. Products
- 12.1.10.3. Company Financials
- 12.1.10.4. SWOT Analysis
- 12.1.11 Cloverdale Paint Inc
- 12.1.11.1. Company Overview
- 12.1.11.2. Products
- 12.1.11.3. Company Financials
- 12.1.11.4. SWOT Analysis
- 12.1.12 Kalekim
- 12.1.12.1. Company Overview
- 12.1.12.2. Products
- 12.1.12.3. Company Financials
- 12.1.12.4. SWOT Analysis
- 12.1.13 Akzo Nobel N V
- 12.1.13.1. Company Overview
- 12.1.13.2. Products
- 12.1.13.3. Company Financials
- 12.1.13.4. SWOT Analysis
- 12.1.14 BioShield Paint Company
- 12.1.14.1. Company Overview
- 12.1.14.2. Products
- 12.1.14.3. Company Financials
- 12.1.14.4. SWOT Analysis
- 12.1.15 Crown Trade
- 12.1.15.1. Company Overview
- 12.1.15.2. Products
- 12.1.15.3. Company Financials
- 12.1.15.4. SWOT Analysis
- 12.1.16 Axalta Coating Systems LLC
- 12.1.16.1. Company Overview
- 12.1.16.2. Products
- 12.1.16.3. Company Financials
- 12.1.16.4. SWOT Analysis
- 12.1.17 Asian Paints
- 12.1.17.1. Company Overview
- 12.1.17.2. Products
- 12.1.17.3. Company Financials
- 12.1.17.4. SWOT Analysis
- 12.1.18 Kansai Paint Co Ltd
- 12.1.18.1. Company Overview
- 12.1.18.2. Products
- 12.1.18.3. Company Financials
- 12.1.18.4. SWOT Analysis
- 12.1.19 Fine Paints of Europe
- 12.1.19.1. Company Overview
- 12.1.19.2. Products
- 12.1.19.3. Company Financials
- 12.1.19.4. SWOT Analysis
- 12.1.1 The Sherwin-Williams Company*List Not Exhaustive
- 12.2. Market Entropy
- 12.2.1 Company's Key Areas Served
- 12.2.2 Recent Developments
- 12.3. Company Market Share Analysis 2025
- 12.3.1 Top 5 Companies Market Share Analysis
- 12.3.2 Top 3 Companies Market Share Analysis
- 12.4. List of Potential Customers
- 13. Research Methodology
List of Figures
- Figure 1: Global Low VOC Paint Market Revenue Breakdown (Million, %) by Region 2025 & 2033
- Figure 2: Global Low VOC Paint Market Volume Breakdown (K Tons, %) by Region 2025 & 2033
- Figure 3: Asia Pacific Low VOC Paint Market Revenue (Million), by Type 2025 & 2033
- Figure 4: Asia Pacific Low VOC Paint Market Volume (K Tons), by Type 2025 & 2033
- Figure 5: Asia Pacific Low VOC Paint Market Revenue Share (%), by Type 2025 & 2033
- Figure 6: Asia Pacific Low VOC Paint Market Volume Share (%), by Type 2025 & 2033
- Figure 7: Asia Pacific Low VOC Paint Market Revenue (Million), by Formulation Type 2025 & 2033
- Figure 8: Asia Pacific Low VOC Paint Market Volume (K Tons), by Formulation Type 2025 & 2033
- Figure 9: Asia Pacific Low VOC Paint Market Revenue Share (%), by Formulation Type 2025 & 2033
- Figure 10: Asia Pacific Low VOC Paint Market Volume Share (%), by Formulation Type 2025 & 2033
- Figure 11: Asia Pacific Low VOC Paint Market Revenue (Million), by Application 2025 & 2033
- Figure 12: Asia Pacific Low VOC Paint Market Volume (K Tons), by Application 2025 & 2033
- Figure 13: Asia Pacific Low VOC Paint Market Revenue Share (%), by Application 2025 & 2033
- Figure 14: Asia Pacific Low VOC Paint Market Volume Share (%), by Application 2025 & 2033
- Figure 15: Asia Pacific Low VOC Paint Market Revenue (Million), by Country 2025 & 2033
- Figure 16: Asia Pacific Low VOC Paint Market Volume (K Tons), by Country 2025 & 2033
- Figure 17: Asia Pacific Low VOC Paint Market Revenue Share (%), by Country 2025 & 2033
- Figure 18: Asia Pacific Low VOC Paint Market Volume Share (%), by Country 2025 & 2033
- Figure 19: North America Low VOC Paint Market Revenue (Million), by Type 2025 & 2033
- Figure 20: North America Low VOC Paint Market Volume (K Tons), by Type 2025 & 2033
- Figure 21: North America Low VOC Paint Market Revenue Share (%), by Type 2025 & 2033
- Figure 22: North America Low VOC Paint Market Volume Share (%), by Type 2025 & 2033
- Figure 23: North America Low VOC Paint Market Revenue (Million), by Formulation Type 2025 & 2033
- Figure 24: North America Low VOC Paint Market Volume (K Tons), by Formulation Type 2025 & 2033
- Figure 25: North America Low VOC Paint Market Revenue Share (%), by Formulation Type 2025 & 2033
- Figure 26: North America Low VOC Paint Market Volume Share (%), by Formulation Type 2025 & 2033
- Figure 27: North America Low VOC Paint Market Revenue (Million), by Application 2025 & 2033
- Figure 28: North America Low VOC Paint Market Volume (K Tons), by Application 2025 & 2033
- Figure 29: North America Low VOC Paint Market Revenue Share (%), by Application 2025 & 2033
- Figure 30: North America Low VOC Paint Market Volume Share (%), by Application 2025 & 2033
- Figure 31: North America Low VOC Paint Market Revenue (Million), by Country 2025 & 2033
- Figure 32: North America Low VOC Paint Market Volume (K Tons), by Country 2025 & 2033
- Figure 33: North America Low VOC Paint Market Revenue Share (%), by Country 2025 & 2033
- Figure 34: North America Low VOC Paint Market Volume Share (%), by Country 2025 & 2033
- Figure 35: Europe Low VOC Paint Market Revenue (Million), by Type 2025 & 2033
- Figure 36: Europe Low VOC Paint Market Volume (K Tons), by Type 2025 & 2033
- Figure 37: Europe Low VOC Paint Market Revenue Share (%), by Type 2025 & 2033
- Figure 38: Europe Low VOC Paint Market Volume Share (%), by Type 2025 & 2033
- Figure 39: Europe Low VOC Paint Market Revenue (Million), by Formulation Type 2025 & 2033
- Figure 40: Europe Low VOC Paint Market Volume (K Tons), by Formulation Type 2025 & 2033
- Figure 41: Europe Low VOC Paint Market Revenue Share (%), by Formulation Type 2025 & 2033
- Figure 42: Europe Low VOC Paint Market Volume Share (%), by Formulation Type 2025 & 2033
- Figure 43: Europe Low VOC Paint Market Revenue (Million), by Application 2025 & 2033
- Figure 44: Europe Low VOC Paint Market Volume (K Tons), by Application 2025 & 2033
- Figure 45: Europe Low VOC Paint Market Revenue Share (%), by Application 2025 & 2033
- Figure 46: Europe Low VOC Paint Market Volume Share (%), by Application 2025 & 2033
- Figure 47: Europe Low VOC Paint Market Revenue (Million), by Country 2025 & 2033
- Figure 48: Europe Low VOC Paint Market Volume (K Tons), by Country 2025 & 2033
- Figure 49: Europe Low VOC Paint Market Revenue Share (%), by Country 2025 & 2033
- Figure 50: Europe Low VOC Paint Market Volume Share (%), by Country 2025 & 2033
- Figure 51: South America Low VOC Paint Market Revenue (Million), by Type 2025 & 2033
- Figure 52: South America Low VOC Paint Market Volume (K Tons), by Type 2025 & 2033
- Figure 53: South America Low VOC Paint Market Revenue Share (%), by Type 2025 & 2033
- Figure 54: South America Low VOC Paint Market Volume Share (%), by Type 2025 & 2033
- Figure 55: South America Low VOC Paint Market Revenue (Million), by Formulation Type 2025 & 2033
- Figure 56: South America Low VOC Paint Market Volume (K Tons), by Formulation Type 2025 & 2033
- Figure 57: South America Low VOC Paint Market Revenue Share (%), by Formulation Type 2025 & 2033
- Figure 58: South America Low VOC Paint Market Volume Share (%), by Formulation Type 2025 & 2033
- Figure 59: South America Low VOC Paint Market Revenue (Million), by Application 2025 & 2033
- Figure 60: South America Low VOC Paint Market Volume (K Tons), by Application 2025 & 2033
- Figure 61: South America Low VOC Paint Market Revenue Share (%), by Application 2025 & 2033
- Figure 62: South America Low VOC Paint Market Volume Share (%), by Application 2025 & 2033
- Figure 63: South America Low VOC Paint Market Revenue (Million), by Country 2025 & 2033
- Figure 64: South America Low VOC Paint Market Volume (K Tons), by Country 2025 & 2033
- Figure 65: South America Low VOC Paint Market Revenue Share (%), by Country 2025 & 2033
- Figure 66: South America Low VOC Paint Market Volume Share (%), by Country 2025 & 2033
- Figure 67: Middle East and Africa Low VOC Paint Market Revenue (Million), by Type 2025 & 2033
- Figure 68: Middle East and Africa Low VOC Paint Market Volume (K Tons), by Type 2025 & 2033
- Figure 69: Middle East and Africa Low VOC Paint Market Revenue Share (%), by Type 2025 & 2033
- Figure 70: Middle East and Africa Low VOC Paint Market Volume Share (%), by Type 2025 & 2033
- Figure 71: Middle East and Africa Low VOC Paint Market Revenue (Million), by Formulation Type 2025 & 2033
- Figure 72: Middle East and Africa Low VOC Paint Market Volume (K Tons), by Formulation Type 2025 & 2033
- Figure 73: Middle East and Africa Low VOC Paint Market Revenue Share (%), by Formulation Type 2025 & 2033
- Figure 74: Middle East and Africa Low VOC Paint Market Volume Share (%), by Formulation Type 2025 & 2033
- Figure 75: Middle East and Africa Low VOC Paint Market Revenue (Million), by Application 2025 & 2033
- Figure 76: Middle East and Africa Low VOC Paint Market Volume (K Tons), by Application 2025 & 2033
- Figure 77: Middle East and Africa Low VOC Paint Market Revenue Share (%), by Application 2025 & 2033
- Figure 78: Middle East and Africa Low VOC Paint Market Volume Share (%), by Application 2025 & 2033
- Figure 79: Middle East and Africa Low VOC Paint Market Revenue (Million), by Country 2025 & 2033
- Figure 80: Middle East and Africa Low VOC Paint Market Volume (K Tons), by Country 2025 & 2033
- Figure 81: Middle East and Africa Low VOC Paint Market Revenue Share (%), by Country 2025 & 2033
- Figure 82: Middle East and Africa Low VOC Paint Market Volume Share (%), by Country 2025 & 2033
List of Tables
- Table 1: Global Low VOC Paint Market Revenue Million Forecast, by Type 2020 & 2033
- Table 2: Global Low VOC Paint Market Volume K Tons Forecast, by Type 2020 & 2033
- Table 3: Global Low VOC Paint Market Revenue Million Forecast, by Formulation Type 2020 & 2033
- Table 4: Global Low VOC Paint Market Volume K Tons Forecast, by Formulation Type 2020 & 2033
- Table 5: Global Low VOC Paint Market Revenue Million Forecast, by Application 2020 & 2033
- Table 6: Global Low VOC Paint Market Volume K Tons Forecast, by Application 2020 & 2033
- Table 7: Global Low VOC Paint Market Revenue Million Forecast, by Region 2020 & 2033
- Table 8: Global Low VOC Paint Market Volume K Tons Forecast, by Region 2020 & 2033
- Table 9: Global Low VOC Paint Market Revenue Million Forecast, by Type 2020 & 2033
- Table 10: Global Low VOC Paint Market Volume K Tons Forecast, by Type 2020 & 2033
- Table 11: Global Low VOC Paint Market Revenue Million Forecast, by Formulation Type 2020 & 2033
- Table 12: Global Low VOC Paint Market Volume K Tons Forecast, by Formulation Type 2020 & 2033
- Table 13: Global Low VOC Paint Market Revenue Million Forecast, by Application 2020 & 2033
- Table 14: Global Low VOC Paint Market Volume K Tons Forecast, by Application 2020 & 2033
- Table 15: Global Low VOC Paint Market Revenue Million Forecast, by Country 2020 & 2033
- Table 16: Global Low VOC Paint Market Volume K Tons Forecast, by Country 2020 & 2033
- Table 17: China Low VOC Paint Market Revenue (Million) Forecast, by Application 2020 & 2033
- Table 18: China Low VOC Paint Market Volume (K Tons) Forecast, by Application 2020 & 2033
- Table 19: India Low VOC Paint Market Revenue (Million) Forecast, by Application 2020 & 2033
- Table 20: India Low VOC Paint Market Volume (K Tons) Forecast, by Application 2020 & 2033
- Table 21: Japan Low VOC Paint Market Revenue (Million) Forecast, by Application 2020 & 2033
- Table 22: Japan Low VOC Paint Market Volume (K Tons) Forecast, by Application 2020 & 2033
- Table 23: South Korea Low VOC Paint Market Revenue (Million) Forecast, by Application 2020 & 2033
- Table 24: South Korea Low VOC Paint Market Volume (K Tons) Forecast, by Application 2020 & 2033
- Table 25: Rest of Asia Pacific Low VOC Paint Market Revenue (Million) Forecast, by Application 2020 & 2033
- Table 26: Rest of Asia Pacific Low VOC Paint Market Volume (K Tons) Forecast, by Application 2020 & 2033
- Table 27: Global Low VOC Paint Market Revenue Million Forecast, by Type 2020 & 2033
- Table 28: Global Low VOC Paint Market Volume K Tons Forecast, by Type 2020 & 2033
- Table 29: Global Low VOC Paint Market Revenue Million Forecast, by Formulation Type 2020 & 2033
- Table 30: Global Low VOC Paint Market Volume K Tons Forecast, by Formulation Type 2020 & 2033
- Table 31: Global Low VOC Paint Market Revenue Million Forecast, by Application 2020 & 2033
- Table 32: Global Low VOC Paint Market Volume K Tons Forecast, by Application 2020 & 2033
- Table 33: Global Low VOC Paint Market Revenue Million Forecast, by Country 2020 & 2033
- Table 34: Global Low VOC Paint Market Volume K Tons Forecast, by Country 2020 & 2033
- Table 35: United States Low VOC Paint Market Revenue (Million) Forecast, by Application 2020 & 2033
- Table 36: United States Low VOC Paint Market Volume (K Tons) Forecast, by Application 2020 & 2033
- Table 37: Canada Low VOC Paint Market Revenue (Million) Forecast, by Application 2020 & 2033
- Table 38: Canada Low VOC Paint Market Volume (K Tons) Forecast, by Application 2020 & 2033
- Table 39: Mexico Low VOC Paint Market Revenue (Million) Forecast, by Application 2020 & 2033
- Table 40: Mexico Low VOC Paint Market Volume (K Tons) Forecast, by Application 2020 & 2033
- Table 41: Global Low VOC Paint Market Revenue Million Forecast, by Type 2020 & 2033
- Table 42: Global Low VOC Paint Market Volume K Tons Forecast, by Type 2020 & 2033
- Table 43: Global Low VOC Paint Market Revenue Million Forecast, by Formulation Type 2020 & 2033
- Table 44: Global Low VOC Paint Market Volume K Tons Forecast, by Formulation Type 2020 & 2033
- Table 45: Global Low VOC Paint Market Revenue Million Forecast, by Application 2020 & 2033
- Table 46: Global Low VOC Paint Market Volume K Tons Forecast, by Application 2020 & 2033
- Table 47: Global Low VOC Paint Market Revenue Million Forecast, by Country 2020 & 2033
- Table 48: Global Low VOC Paint Market Volume K Tons Forecast, by Country 2020 & 2033
- Table 49: Germany Low VOC Paint Market Revenue (Million) Forecast, by Application 2020 & 2033
- Table 50: Germany Low VOC Paint Market Volume (K Tons) Forecast, by Application 2020 & 2033
- Table 51: United Kingdom Low VOC Paint Market Revenue (Million) Forecast, by Application 2020 & 2033
- Table 52: United Kingdom Low VOC Paint Market Volume (K Tons) Forecast, by Application 2020 & 2033
- Table 53: France Low VOC Paint Market Revenue (Million) Forecast, by Application 2020 & 2033
- Table 54: France Low VOC Paint Market Volume (K Tons) Forecast, by Application 2020 & 2033
- Table 55: Italy Low VOC Paint Market Revenue (Million) Forecast, by Application 2020 & 2033
- Table 56: Italy Low VOC Paint Market Volume (K Tons) Forecast, by Application 2020 & 2033
- Table 57: Rest of Europe Low VOC Paint Market Revenue (Million) Forecast, by Application 2020 & 2033
- Table 58: Rest of Europe Low VOC Paint Market Volume (K Tons) Forecast, by Application 2020 & 2033
- Table 59: Global Low VOC Paint Market Revenue Million Forecast, by Type 2020 & 2033
- Table 60: Global Low VOC Paint Market Volume K Tons Forecast, by Type 2020 & 2033
- Table 61: Global Low VOC Paint Market Revenue Million Forecast, by Formulation Type 2020 & 2033
- Table 62: Global Low VOC Paint Market Volume K Tons Forecast, by Formulation Type 2020 & 2033
- Table 63: Global Low VOC Paint Market Revenue Million Forecast, by Application 2020 & 2033
- Table 64: Global Low VOC Paint Market Volume K Tons Forecast, by Application 2020 & 2033
- Table 65: Global Low VOC Paint Market Revenue Million Forecast, by Country 2020 & 2033
- Table 66: Global Low VOC Paint Market Volume K Tons Forecast, by Country 2020 & 2033
- Table 67: Brazil Low VOC Paint Market Revenue (Million) Forecast, by Application 2020 & 2033
- Table 68: Brazil Low VOC Paint Market Volume (K Tons) Forecast, by Application 2020 & 2033
- Table 69: Argentina Low VOC Paint Market Revenue (Million) Forecast, by Application 2020 & 2033
- Table 70: Argentina Low VOC Paint Market Volume (K Tons) Forecast, by Application 2020 & 2033
- Table 71: Rest of South America Low VOC Paint Market Revenue (Million) Forecast, by Application 2020 & 2033
- Table 72: Rest of South America Low VOC Paint Market Volume (K Tons) Forecast, by Application 2020 & 2033
- Table 73: Global Low VOC Paint Market Revenue Million Forecast, by Type 2020 & 2033
- Table 74: Global Low VOC Paint Market Volume K Tons Forecast, by Type 2020 & 2033
- Table 75: Global Low VOC Paint Market Revenue Million Forecast, by Formulation Type 2020 & 2033
- Table 76: Global Low VOC Paint Market Volume K Tons Forecast, by Formulation Type 2020 & 2033
- Table 77: Global Low VOC Paint Market Revenue Million Forecast, by Application 2020 & 2033
- Table 78: Global Low VOC Paint Market Volume K Tons Forecast, by Application 2020 & 2033
- Table 79: Global Low VOC Paint Market Revenue Million Forecast, by Country 2020 & 2033
- Table 80: Global Low VOC Paint Market Volume K Tons Forecast, by Country 2020 & 2033
- Table 81: Saudi Arabia Low VOC Paint Market Revenue (Million) Forecast, by Application 2020 & 2033
- Table 82: Saudi Arabia Low VOC Paint Market Volume (K Tons) Forecast, by Application 2020 & 2033
- Table 83: South Africa Low VOC Paint Market Revenue (Million) Forecast, by Application 2020 & 2033
- Table 84: South Africa Low VOC Paint Market Volume (K Tons) Forecast, by Application 2020 & 2033
- Table 85: Rest of Middle East and Africa Low VOC Paint Market Revenue (Million) Forecast, by Application 2020 & 2033
- Table 86: Rest of Middle East and Africa Low VOC Paint Market Volume (K Tons) Forecast, by Application 2020 & 2033
Frequently Asked Questions
1. What is the projected Compound Annual Growth Rate (CAGR) of the Low VOC Paint Market?
The projected CAGR is approximately > 5.60%.
2. Which companies are prominent players in the Low VOC Paint Market?
Key companies in the market include The Sherwin-Williams Company*List Not Exhaustive, Arkema, Jotun, Berger Paints India Limited, AURO, American Formulating & Manufacturing, PPG Industries Inc, Benjamin Moore & Co, Nippon Paint Holdings Co Ltd, BASF SE, Cloverdale Paint Inc, Kalekim, Akzo Nobel N V, BioShield Paint Company, Crown Trade, Axalta Coating Systems LLC, Asian Paints, Kansai Paint Co Ltd, Fine Paints of Europe.
3. What are the main segments of the Low VOC Paint Market?
The market segments include Type, Formulation Type, Application.
4. Can you provide details about the market size?
The market size is estimated to be USD 8.84 Million as of 2022.
5. What are some drivers contributing to market growth?
Increasing Awareness about Harmful Effects of Conventional Paint4.1.2 increasing Demand in Architectural and Decorative Industry; Other Drivers.
6. What are the notable trends driving market growth?
Architectural and Decorative Segment to Dominate the Market.
7. Are there any restraints impacting market growth?
High Cost in Comparison to Conventional Paint; Other Restraints.
8. Can you provide examples of recent developments in the market?
N/A
9. What pricing options are available for accessing the report?
Pricing options include single-user, multi-user, and enterprise licenses priced at USD 4750, USD 5250, and USD 8750 respectively.
10. Is the market size provided in terms of value or volume?
The market size is provided in terms of value, measured in Million and volume, measured in K Tons.
11. Are there any specific market keywords associated with the report?
Yes, the market keyword associated with the report is "Low VOC Paint Market," which aids in identifying and referencing the specific market segment covered.
12. How do I determine which pricing option suits my needs best?
The pricing options vary based on user requirements and access needs. Individual users may opt for single-user licenses, while businesses requiring broader access may choose multi-user or enterprise licenses for cost-effective access to the report.
13. Are there any additional resources or data provided in the Low VOC Paint Market report?
While the report offers comprehensive insights, it's advisable to review the specific contents or supplementary materials provided to ascertain if additional resources or data are available.
14. How can I stay updated on further developments or reports in the Low VOC Paint Market?
To stay informed about further developments, trends, and reports in the Low VOC Paint Market, consider subscribing to industry newsletters, following relevant companies and organizations, or regularly checking reputable industry news sources and publications.
Methodology
Step 1 - Identification of Relevant Samples Size from Population Database


Step 2 - Approaches for Defining Global Market Size (Value, Volume* & Price*)

Note*: In applicable scenarios
Step 3 - Data Sources
Primary Research
- Web Analytics
- Survey Reports
- Research Institute
- Latest Research Reports
- Opinion Leaders
Secondary Research
- Annual Reports
- White Paper
- Latest Press Release
- Industry Association
- Paid Database
- Investor Presentations

Step 4 - Data Triangulation
Involves using different sources of information in order to increase the validity of a study
These sources are likely to be stakeholders in a program - participants, other researchers, program staff, other community members, and so on.
Then we put all data in single framework & apply various statistical tools to find out the dynamic on the market.
During the analysis stage, feedback from the stakeholder groups would be compared to determine areas of agreement as well as areas of divergence