

Key Insights
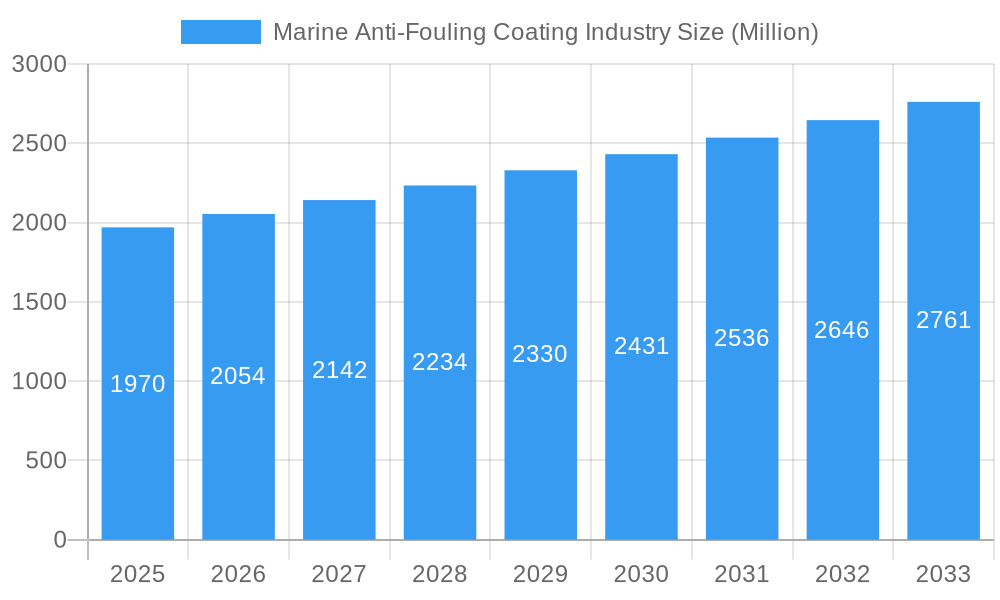
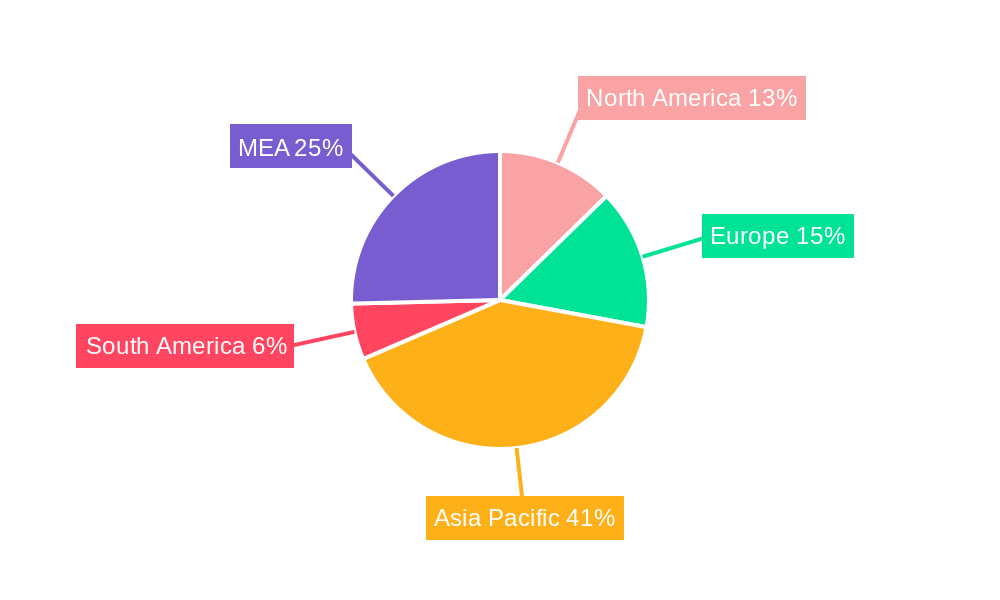
The global marine anti-fouling coating market, valued at $1.97 billion in 2025, is projected to experience robust growth, exceeding a 4% CAGR through 2033. This expansion is driven by several key factors. The increasing global shipping and maritime activities necessitate frequent hull maintenance and recoating to prevent biofouling, which directly impacts fuel efficiency and operational costs. Stringent environmental regulations, focused on reducing the environmental impact of traditional antifouling agents like tributyltin (TBT), are pushing the market towards eco-friendly alternatives, such as self-polishing copolymer (SPC) and silicone-based coatings. Technological advancements in coating formulations, leading to improved performance characteristics such as enhanced durability, longer lifespan, and superior antifouling properties, further contribute to market growth. The burgeoning demand for high-performance coatings across various segments, including hull coatings for large commercial vessels and specialized coatings for yachts and smaller vessels, fuels this positive growth trajectory. The Asia-Pacific region is expected to witness significant growth, driven by the expansion of port infrastructure and a rise in shipping activities in countries like China and India.
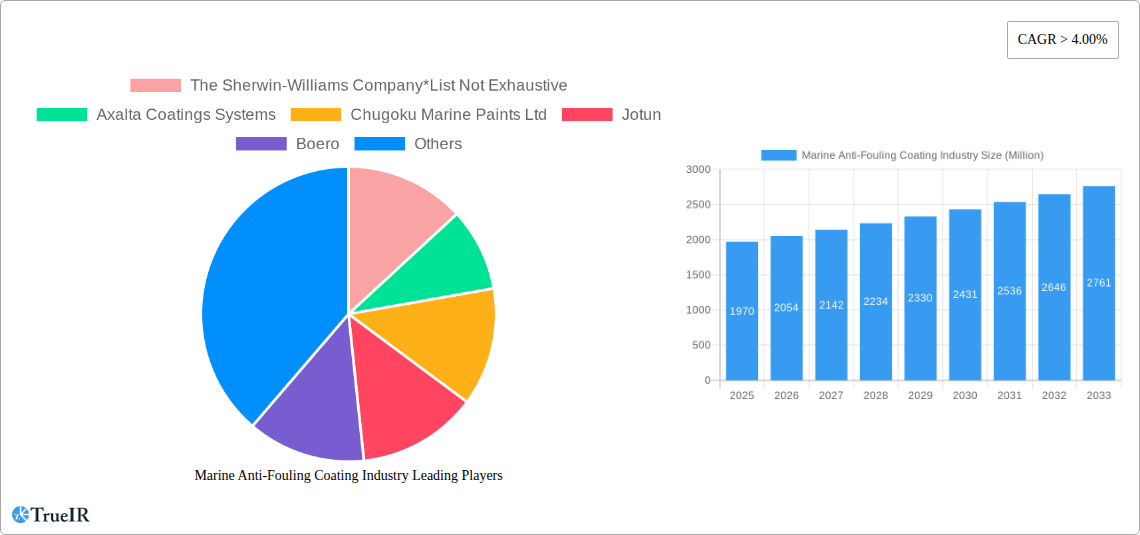
Marine Anti-Fouling Coating Industry Market Size (In Billion)
The market is segmented by type (copper-based, self-polishing, hybrid, and others) and application (hull coatings, tank coatings, and other applications). Copper-based coatings remain a dominant segment, although self-polishing coatings, due to their environmentally friendly profile and effectiveness, are gaining traction. Growth in the hull coating segment is largely tied to the global shipping industry, while growth in tank coatings is driven by the need for preventing corrosion and biofouling in the storage of various marine materials. Competitive landscape is characterized by several major players, including Sherwin-Williams, Axalta, Jotun, and Hempel, along with regional players, contributing to market innovation and product differentiation. While growth is anticipated to be substantial, potential restraints include fluctuations in raw material prices, particularly for metal-based coatings, and potential regulatory changes impacting the adoption of specific antifouling agents. Continuous innovation in eco-friendly formulations and effective biocide technology will be crucial for sustained market growth in the coming years.
Marine Anti-Fouling Coating Industry Company Market Share
Marine Anti-Fouling Coating Industry Market Report: 2019-2033
This comprehensive report provides a detailed analysis of the global marine anti-fouling coating industry, offering invaluable insights for stakeholders, investors, and industry professionals. The report covers market size, segmentation, competitive landscape, key players, technological advancements, and future growth projections, with a focus on driving factors and challenges. The study period spans 2019-2033, with 2025 as the base year and a forecast period of 2025-2033. The market is expected to reach xx Million by 2033.
Marine Anti-Fouling Coating Industry Market Structure & Competitive Landscape
The global marine anti-fouling coating market is moderately concentrated, with several major players holding significant market share. The industry exhibits intense competition, driven by innovation in coating technology, stringent environmental regulations, and the increasing demand for sustainable solutions. Concentration ratios (e.g., CR4, CR8) show xx% market share by the top 4 players in 2024.
- Key Players: The Sherwin-Williams Company, Axalta Coatings Systems, Chugoku Marine Paints Ltd, Jotun, Boero, RPM International Inc, Kansai Paint Co Ltd, Akzo Nobel NV, PPG Industries Inc, Nippon Paint Marine Coatings Co Ltd, BASF SE, Hempel A/S, Lanxess. These companies engage in both organic growth (product innovation) and inorganic growth (M&A).
- Innovation Drivers: The primary drivers of innovation include the development of biocide-free and low-biocide antifouling coatings, improved performance characteristics (e.g., increased durability, enhanced fouling control), and the use of advanced technologies (e.g., UV-C light, nanotechnology).
- Regulatory Impacts: International Maritime Organization (IMO) regulations and regional environmental policies significantly impact the industry, driving the adoption of eco-friendly solutions. Stringent regulations on biocides have spurred the development of biocide-free alternatives.
- Product Substitutes: While limited, alternative technologies like hull cleaning systems and hydrodynamic hull designs present some competition.
- End-User Segmentation: The market is segmented by vessel type (e.g., commercial ships, yachts, fishing vessels), creating diverse application needs and influencing product selection.
- M&A Trends: The industry witnesses frequent mergers and acquisitions (M&A), with larger players strategically acquiring smaller companies to expand their product portfolios and market reach. The total value of M&A deals in the last five years reached approximately xx Million.
Marine Anti-Fouling Coating Industry Market Trends & Opportunities
The global marine anti-fouling coating market exhibits substantial growth potential, driven by several key factors. The market is projected to experience a Compound Annual Growth Rate (CAGR) of xx% from 2025 to 2033. This robust growth is fueled by increasing global shipping traffic, stricter environmental regulations pushing for eco-friendly solutions, and technological advancements in coating formulations. The rising demand for fuel-efficient vessels, improved operational efficiency, and reduced greenhouse gas emissions also significantly contributes to market expansion. Market penetration rates vary by region and application, with developing economies showing significant growth potential. Technological advancements, including the development of biocide-free and self-polishing coatings, offer significant opportunities for industry players. Consumer preferences are shifting toward sustainable and high-performance coatings, presenting further growth avenues. Intense competition and the need for continuous innovation drive ongoing product development and improvement in the industry.
Dominant Markets & Segments in Marine Anti-Fouling Coating Industry
The Asia-Pacific region is currently the dominant market for marine anti-fouling coatings, driven by a large shipbuilding industry and expanding maritime trade. Europe and North America are also significant markets. Within the segmentations:
By Type: The self-polishing (silver-based) and copper-based coatings currently dominate the market due to their established efficacy and widespread use. However, the "Other Types" segment, particularly organometallic and silane-based coatings, is witnessing significant growth owing to their environmentally friendly characteristics and performance advantages.
By Application: Hull coatings represent the largest segment in terms of volume and value. Tank coatings constitute a significant market share, driven by the need to prevent fouling in storage tanks and maintain product quality. Other applications, such as yacht and vessel coatings, are growing due to the increasing number of leisure crafts.
Key Growth Drivers (Asia-Pacific):
- Rapid growth in shipbuilding and shipping activities.
- Expansion of port infrastructure and maritime trade routes.
- Governmental support for the maritime industry.
- Increasing awareness of environmental sustainability and regulations.
The detailed analysis of regional dominance and respective growth drivers is elaborated upon in the full report.
Marine Anti-Fouling Coating Industry Product Analysis
The marine anti-fouling coating market showcases continuous innovation, with a strong emphasis on developing environmentally friendly and high-performance solutions. Recent advancements include copper-free formulations, biocide-free technologies (like AkzoNobel's B-Free range), and self-polishing coatings with improved longevity and reduced environmental impact. These advancements improve vessel efficiency, reduce fuel consumption, and minimize the release of harmful substances into marine ecosystems. The market fit of these innovative products is determined by their cost-effectiveness, regulatory compliance, and performance in real-world applications.
Key Drivers, Barriers & Challenges in Marine Anti-Fouling Coating Industry
Key Drivers: The growth of the global shipping industry, increasing demand for fuel-efficient vessels, tightening environmental regulations (IMO 2020), and technological advancements in coating formulations are the major drivers of market growth. For instance, the IMO's sulfur cap has incentivized the development of coatings that reduce fuel consumption, improving profitability for shipping companies and making such coatings more attractive.
Challenges: Stringent environmental regulations concerning biocides pose a major challenge. Supply chain disruptions, particularly regarding raw materials, can impact production and pricing. Intense competition from established players and new entrants necessitates continuous innovation and cost optimization. Fluctuations in raw material prices, geopolitical factors, and economic downturns also present challenges for industry growth.
Growth Drivers in the Marine Anti-Fouling Coating Industry Market
The key drivers for growth include increasing global trade and shipping, strict environmental regulations prompting eco-friendly coating adoption, and technological advancements creating more efficient and sustainable products. The demand for fuel-efficient vessels and operational efficiency further contributes to the market's upward trajectory.
Challenges Impacting Marine Anti-Fouling Coating Industry Growth
Regulatory complexities around biocide usage, along with supply chain vulnerabilities and pricing volatility of raw materials, significantly impact market growth. Intense competition among major players also creates pressure on profit margins.
Key Players Shaping the Marine Anti-Fouling Coating Industry Market
- The Sherwin-Williams Company
- Axalta Coatings Systems
- Chugoku Marine Paints Ltd
- Jotun
- Boero
- RPM International Inc
- Kansai Paint Co Ltd
- Akzo Nobel NV
- PPG Industries Inc
- Nippon Paint Marine Coatings Co Ltd
- BASF SE
- Hempel A/S
- Lanxess
Significant Marine Anti-Fouling Coating Industry Industry Milestones
- November 2022: AkzoNobel NV launched a new biocide-free (B-Free) fouling control range, emphasizing environmental sustainability and hull efficiency.
- December 2022: I-Tech AB and LANXESS successfully tested antifouling coating formulations containing Selektope and SEA NINE biocides, offering manufacturers new biocide combinations.
- April 2023: Damen Shipyards, AkzoNobel, and Philips collaborated on a pioneering fouling control solution using UV-C light technology.
- October 2023: Hempel A/S inaugurated a new antifouling coatings production facility in Zhangjiagang, China, to meet growing market demand.
- March 2024: PPG Industries Inc. launched PPG Nexeon 810, a copper-free antifouling coating designed for improved vessel performance, emissions reduction, and sustainability, promising up to a 10% power boost and 15% operational efficiency increase.
Future Outlook for Marine Anti-Fouling Coating Industry Market
The future of the marine anti-fouling coating industry is promising, driven by the continuous development of sustainable and high-performance coatings. The increasing focus on environmental protection, coupled with advancements in biocide-free and low-biocide technologies, will shape the market's trajectory. Strategic partnerships and acquisitions will further consolidate the industry, leading to more efficient production and wider market reach. The market presents significant opportunities for companies that can successfully innovate and adapt to evolving regulatory landscapes and customer demands.
Marine Anti-Fouling Coating Industry Segmentation
-
1. Type
- 1.1. Copper-based
- 1.2. Self-polishing (Silver-based)
- 1.3. Hybrid
- 1.4. Other Types (Organo Metallic, Silane)
-
2. Application
- 2.1. Hull Coatings
- 2.2. Tank Coatings
- 2.3. Other Applications (Yachts and Vessels)
Marine Anti-Fouling Coating Industry Segmentation By Geography
-
1. Asia Pacific
- 1.1. China
- 1.2. India
- 1.3. Japan
- 1.4. South Korea
- 1.5. Thailand
- 1.6. Vietnam
- 1.7. Indonesia
- 1.8. Malaysia
- 1.9. Rest of Asia Pacific
-
2. North America
- 2.1. United States
- 2.2. Canada
- 2.3. Mexico
-
3. Europe
- 3.1. Germany
- 3.2. United Kingdom
- 3.3. France
- 3.4. Italy
- 3.5. Spain
- 3.6. Russia
- 3.7. NORDIC Countries
- 3.8. Turkey
- 3.9. Rest of Europe
-
4. South America
- 4.1. Brazil
- 4.2. Argentina
- 4.3. Colombia
- 4.4. Rest of South America
-
5. Middle East and Africa
- 5.1. Saudi Arabia
- 5.2. South Africa
- 5.3. Nigeria
- 5.4. United Arab Emirates
- 5.5. Qatar
- 5.6. Egypt
- 5.7. Rest of Middle East and Africa
Marine Anti-Fouling Coating Industry Regional Market Share
Geographic Coverage of Marine Anti-Fouling Coating Industry
Marine Anti-Fouling Coating Industry REPORT HIGHLIGHTS
| Aspects | Details |
|---|---|
| Study Period | 2020-2034 |
| Base Year | 2025 |
| Estimated Year | 2026 |
| Forecast Period | 2026-2034 |
| Historical Period | 2020-2025 |
| Growth Rate | CAGR of > 4.00% from 2020-2034 |
| Segmentation |
|
Table of Contents
- 1. Introduction
- 1.1. Research Scope
- 1.2. Market Segmentation
- 1.3. Research Objective
- 1.4. Definitions and Assumptions
- 2. Executive Summary
- 2.1. Market Snapshot
- 3. Market Dynamics
- 3.1. Market Drivers
- 3.2. Market Restrains
- 3.3. Market Trends
- 3.4. Market Opportunities
- 4. Market Factor Analysis
- 4.1. Porters Five Forces
- 4.1.1. Bargaining Power of Suppliers
- 4.1.2. Bargaining Power of Buyers
- 4.1.3. Threat of New Entrants
- 4.1.4. Threat of Substitutes
- 4.1.5. Competitive Rivalry
- 4.2. PESTEL analysis
- 4.3. BCG Analysis
- 4.3.1. Stars (High Growth, High Market Share)
- 4.3.2. Cash Cows (Low Growth, High Market Share)
- 4.3.3. Question Mark (High Growth, Low Market Share)
- 4.3.4. Dogs (Low Growth, Low Market Share)
- 4.4. Ansoff Matrix Analysis
- 4.5. Supply Chain Analysis
- 4.6. Regulatory Landscape
- 4.7. Current Market Potential and Opportunity Assessment (TAM–SAM–SOM Framework)
- 4.8. TIR Analyst Note
- 4.1. Porters Five Forces
- 5. Market Analysis, Insights and Forecast 2021-2033
- 5.1. Market Analysis, Insights and Forecast - by Type
- 5.1.1. Copper-based
- 5.1.2. Self-polishing (Silver-based)
- 5.1.3. Hybrid
- 5.1.4. Other Types (Organo Metallic, Silane)
- 5.2. Market Analysis, Insights and Forecast - by Application
- 5.2.1. Hull Coatings
- 5.2.2. Tank Coatings
- 5.2.3. Other Applications (Yachts and Vessels)
- 5.3. Market Analysis, Insights and Forecast - by Region
- 5.3.1. Asia Pacific
- 5.3.2. North America
- 5.3.3. Europe
- 5.3.4. South America
- 5.3.5. Middle East and Africa
- 5.1. Market Analysis, Insights and Forecast - by Type
- 6. Global Marine Anti-Fouling Coating Industry Analysis, Insights and Forecast, 2021-2033
- 6.1. Market Analysis, Insights and Forecast - by Type
- 6.1.1. Copper-based
- 6.1.2. Self-polishing (Silver-based)
- 6.1.3. Hybrid
- 6.1.4. Other Types (Organo Metallic, Silane)
- 6.2. Market Analysis, Insights and Forecast - by Application
- 6.2.1. Hull Coatings
- 6.2.2. Tank Coatings
- 6.2.3. Other Applications (Yachts and Vessels)
- 6.1. Market Analysis, Insights and Forecast - by Type
- 7. Asia Pacific Marine Anti-Fouling Coating Industry Analysis, Insights and Forecast, 2020-2032
- 7.1. Market Analysis, Insights and Forecast - by Type
- 7.1.1. Copper-based
- 7.1.2. Self-polishing (Silver-based)
- 7.1.3. Hybrid
- 7.1.4. Other Types (Organo Metallic, Silane)
- 7.2. Market Analysis, Insights and Forecast - by Application
- 7.2.1. Hull Coatings
- 7.2.2. Tank Coatings
- 7.2.3. Other Applications (Yachts and Vessels)
- 7.1. Market Analysis, Insights and Forecast - by Type
- 8. North America Marine Anti-Fouling Coating Industry Analysis, Insights and Forecast, 2020-2032
- 8.1. Market Analysis, Insights and Forecast - by Type
- 8.1.1. Copper-based
- 8.1.2. Self-polishing (Silver-based)
- 8.1.3. Hybrid
- 8.1.4. Other Types (Organo Metallic, Silane)
- 8.2. Market Analysis, Insights and Forecast - by Application
- 8.2.1. Hull Coatings
- 8.2.2. Tank Coatings
- 8.2.3. Other Applications (Yachts and Vessels)
- 8.1. Market Analysis, Insights and Forecast - by Type
- 9. Europe Marine Anti-Fouling Coating Industry Analysis, Insights and Forecast, 2020-2032
- 9.1. Market Analysis, Insights and Forecast - by Type
- 9.1.1. Copper-based
- 9.1.2. Self-polishing (Silver-based)
- 9.1.3. Hybrid
- 9.1.4. Other Types (Organo Metallic, Silane)
- 9.2. Market Analysis, Insights and Forecast - by Application
- 9.2.1. Hull Coatings
- 9.2.2. Tank Coatings
- 9.2.3. Other Applications (Yachts and Vessels)
- 9.1. Market Analysis, Insights and Forecast - by Type
- 10. South America Marine Anti-Fouling Coating Industry Analysis, Insights and Forecast, 2020-2032
- 10.1. Market Analysis, Insights and Forecast - by Type
- 10.1.1. Copper-based
- 10.1.2. Self-polishing (Silver-based)
- 10.1.3. Hybrid
- 10.1.4. Other Types (Organo Metallic, Silane)
- 10.2. Market Analysis, Insights and Forecast - by Application
- 10.2.1. Hull Coatings
- 10.2.2. Tank Coatings
- 10.2.3. Other Applications (Yachts and Vessels)
- 10.1. Market Analysis, Insights and Forecast - by Type
- 11. Middle East and Africa Marine Anti-Fouling Coating Industry Analysis, Insights and Forecast, 2020-2032
- 11.1. Market Analysis, Insights and Forecast - by Type
- 11.1.1. Copper-based
- 11.1.2. Self-polishing (Silver-based)
- 11.1.3. Hybrid
- 11.1.4. Other Types (Organo Metallic, Silane)
- 11.2. Market Analysis, Insights and Forecast - by Application
- 11.2.1. Hull Coatings
- 11.2.2. Tank Coatings
- 11.2.3. Other Applications (Yachts and Vessels)
- 11.1. Market Analysis, Insights and Forecast - by Type
- 12. Competitive Analysis
- 12.1. Company Profiles
- 12.1.1 The Sherwin-Williams Company*List Not Exhaustive
- 12.1.1.1. Company Overview
- 12.1.1.2. Products
- 12.1.1.3. Company Financials
- 12.1.1.4. SWOT Analysis
- 12.1.2 Axalta Coatings Systems
- 12.1.2.1. Company Overview
- 12.1.2.2. Products
- 12.1.2.3. Company Financials
- 12.1.2.4. SWOT Analysis
- 12.1.3 Chugoku Marine Paints Ltd
- 12.1.3.1. Company Overview
- 12.1.3.2. Products
- 12.1.3.3. Company Financials
- 12.1.3.4. SWOT Analysis
- 12.1.4 Jotun
- 12.1.4.1. Company Overview
- 12.1.4.2. Products
- 12.1.4.3. Company Financials
- 12.1.4.4. SWOT Analysis
- 12.1.5 Boero
- 12.1.5.1. Company Overview
- 12.1.5.2. Products
- 12.1.5.3. Company Financials
- 12.1.5.4. SWOT Analysis
- 12.1.6 RPM International Inc
- 12.1.6.1. Company Overview
- 12.1.6.2. Products
- 12.1.6.3. Company Financials
- 12.1.6.4. SWOT Analysis
- 12.1.7 Kansai Paint Co Ltd
- 12.1.7.1. Company Overview
- 12.1.7.2. Products
- 12.1.7.3. Company Financials
- 12.1.7.4. SWOT Analysis
- 12.1.8 Akzo Nobel NV
- 12.1.8.1. Company Overview
- 12.1.8.2. Products
- 12.1.8.3. Company Financials
- 12.1.8.4. SWOT Analysis
- 12.1.9 PPG Industries Inc
- 12.1.9.1. Company Overview
- 12.1.9.2. Products
- 12.1.9.3. Company Financials
- 12.1.9.4. SWOT Analysis
- 12.1.10 Nippon Paint Marine Coatings Co Ltd
- 12.1.10.1. Company Overview
- 12.1.10.2. Products
- 12.1.10.3. Company Financials
- 12.1.10.4. SWOT Analysis
- 12.1.11 BASF SE
- 12.1.11.1. Company Overview
- 12.1.11.2. Products
- 12.1.11.3. Company Financials
- 12.1.11.4. SWOT Analysis
- 12.1.12 Hempel A/S
- 12.1.12.1. Company Overview
- 12.1.12.2. Products
- 12.1.12.3. Company Financials
- 12.1.12.4. SWOT Analysis
- 12.1.13 Lanxess
- 12.1.13.1. Company Overview
- 12.1.13.2. Products
- 12.1.13.3. Company Financials
- 12.1.13.4. SWOT Analysis
- 12.1.1 The Sherwin-Williams Company*List Not Exhaustive
- 12.2. Market Entropy
- 12.2.1 Company's Key Areas Served
- 12.2.2 Recent Developments
- 12.3. Company Market Share Analysis 2025
- 12.3.1 Top 5 Companies Market Share Analysis
- 12.3.2 Top 3 Companies Market Share Analysis
- 12.4. List of Potential Customers
- 13. Research Methodology
List of Figures
- Figure 1: Global Marine Anti-Fouling Coating Industry Revenue Breakdown (Million, %) by Region 2025 & 2033
- Figure 2: Global Marine Anti-Fouling Coating Industry Volume Breakdown (liter, %) by Region 2025 & 2033
- Figure 3: Asia Pacific Marine Anti-Fouling Coating Industry Revenue (Million), by Type 2025 & 2033
- Figure 4: Asia Pacific Marine Anti-Fouling Coating Industry Volume (liter), by Type 2025 & 2033
- Figure 5: Asia Pacific Marine Anti-Fouling Coating Industry Revenue Share (%), by Type 2025 & 2033
- Figure 6: Asia Pacific Marine Anti-Fouling Coating Industry Volume Share (%), by Type 2025 & 2033
- Figure 7: Asia Pacific Marine Anti-Fouling Coating Industry Revenue (Million), by Application 2025 & 2033
- Figure 8: Asia Pacific Marine Anti-Fouling Coating Industry Volume (liter), by Application 2025 & 2033
- Figure 9: Asia Pacific Marine Anti-Fouling Coating Industry Revenue Share (%), by Application 2025 & 2033
- Figure 10: Asia Pacific Marine Anti-Fouling Coating Industry Volume Share (%), by Application 2025 & 2033
- Figure 11: Asia Pacific Marine Anti-Fouling Coating Industry Revenue (Million), by Country 2025 & 2033
- Figure 12: Asia Pacific Marine Anti-Fouling Coating Industry Volume (liter), by Country 2025 & 2033
- Figure 13: Asia Pacific Marine Anti-Fouling Coating Industry Revenue Share (%), by Country 2025 & 2033
- Figure 14: Asia Pacific Marine Anti-Fouling Coating Industry Volume Share (%), by Country 2025 & 2033
- Figure 15: North America Marine Anti-Fouling Coating Industry Revenue (Million), by Type 2025 & 2033
- Figure 16: North America Marine Anti-Fouling Coating Industry Volume (liter), by Type 2025 & 2033
- Figure 17: North America Marine Anti-Fouling Coating Industry Revenue Share (%), by Type 2025 & 2033
- Figure 18: North America Marine Anti-Fouling Coating Industry Volume Share (%), by Type 2025 & 2033
- Figure 19: North America Marine Anti-Fouling Coating Industry Revenue (Million), by Application 2025 & 2033
- Figure 20: North America Marine Anti-Fouling Coating Industry Volume (liter), by Application 2025 & 2033
- Figure 21: North America Marine Anti-Fouling Coating Industry Revenue Share (%), by Application 2025 & 2033
- Figure 22: North America Marine Anti-Fouling Coating Industry Volume Share (%), by Application 2025 & 2033
- Figure 23: North America Marine Anti-Fouling Coating Industry Revenue (Million), by Country 2025 & 2033
- Figure 24: North America Marine Anti-Fouling Coating Industry Volume (liter), by Country 2025 & 2033
- Figure 25: North America Marine Anti-Fouling Coating Industry Revenue Share (%), by Country 2025 & 2033
- Figure 26: North America Marine Anti-Fouling Coating Industry Volume Share (%), by Country 2025 & 2033
- Figure 27: Europe Marine Anti-Fouling Coating Industry Revenue (Million), by Type 2025 & 2033
- Figure 28: Europe Marine Anti-Fouling Coating Industry Volume (liter), by Type 2025 & 2033
- Figure 29: Europe Marine Anti-Fouling Coating Industry Revenue Share (%), by Type 2025 & 2033
- Figure 30: Europe Marine Anti-Fouling Coating Industry Volume Share (%), by Type 2025 & 2033
- Figure 31: Europe Marine Anti-Fouling Coating Industry Revenue (Million), by Application 2025 & 2033
- Figure 32: Europe Marine Anti-Fouling Coating Industry Volume (liter), by Application 2025 & 2033
- Figure 33: Europe Marine Anti-Fouling Coating Industry Revenue Share (%), by Application 2025 & 2033
- Figure 34: Europe Marine Anti-Fouling Coating Industry Volume Share (%), by Application 2025 & 2033
- Figure 35: Europe Marine Anti-Fouling Coating Industry Revenue (Million), by Country 2025 & 2033
- Figure 36: Europe Marine Anti-Fouling Coating Industry Volume (liter), by Country 2025 & 2033
- Figure 37: Europe Marine Anti-Fouling Coating Industry Revenue Share (%), by Country 2025 & 2033
- Figure 38: Europe Marine Anti-Fouling Coating Industry Volume Share (%), by Country 2025 & 2033
- Figure 39: South America Marine Anti-Fouling Coating Industry Revenue (Million), by Type 2025 & 2033
- Figure 40: South America Marine Anti-Fouling Coating Industry Volume (liter), by Type 2025 & 2033
- Figure 41: South America Marine Anti-Fouling Coating Industry Revenue Share (%), by Type 2025 & 2033
- Figure 42: South America Marine Anti-Fouling Coating Industry Volume Share (%), by Type 2025 & 2033
- Figure 43: South America Marine Anti-Fouling Coating Industry Revenue (Million), by Application 2025 & 2033
- Figure 44: South America Marine Anti-Fouling Coating Industry Volume (liter), by Application 2025 & 2033
- Figure 45: South America Marine Anti-Fouling Coating Industry Revenue Share (%), by Application 2025 & 2033
- Figure 46: South America Marine Anti-Fouling Coating Industry Volume Share (%), by Application 2025 & 2033
- Figure 47: South America Marine Anti-Fouling Coating Industry Revenue (Million), by Country 2025 & 2033
- Figure 48: South America Marine Anti-Fouling Coating Industry Volume (liter), by Country 2025 & 2033
- Figure 49: South America Marine Anti-Fouling Coating Industry Revenue Share (%), by Country 2025 & 2033
- Figure 50: South America Marine Anti-Fouling Coating Industry Volume Share (%), by Country 2025 & 2033
- Figure 51: Middle East and Africa Marine Anti-Fouling Coating Industry Revenue (Million), by Type 2025 & 2033
- Figure 52: Middle East and Africa Marine Anti-Fouling Coating Industry Volume (liter), by Type 2025 & 2033
- Figure 53: Middle East and Africa Marine Anti-Fouling Coating Industry Revenue Share (%), by Type 2025 & 2033
- Figure 54: Middle East and Africa Marine Anti-Fouling Coating Industry Volume Share (%), by Type 2025 & 2033
- Figure 55: Middle East and Africa Marine Anti-Fouling Coating Industry Revenue (Million), by Application 2025 & 2033
- Figure 56: Middle East and Africa Marine Anti-Fouling Coating Industry Volume (liter), by Application 2025 & 2033
- Figure 57: Middle East and Africa Marine Anti-Fouling Coating Industry Revenue Share (%), by Application 2025 & 2033
- Figure 58: Middle East and Africa Marine Anti-Fouling Coating Industry Volume Share (%), by Application 2025 & 2033
- Figure 59: Middle East and Africa Marine Anti-Fouling Coating Industry Revenue (Million), by Country 2025 & 2033
- Figure 60: Middle East and Africa Marine Anti-Fouling Coating Industry Volume (liter), by Country 2025 & 2033
- Figure 61: Middle East and Africa Marine Anti-Fouling Coating Industry Revenue Share (%), by Country 2025 & 2033
- Figure 62: Middle East and Africa Marine Anti-Fouling Coating Industry Volume Share (%), by Country 2025 & 2033
List of Tables
- Table 1: Global Marine Anti-Fouling Coating Industry Revenue Million Forecast, by Type 2020 & 2033
- Table 2: Global Marine Anti-Fouling Coating Industry Volume liter Forecast, by Type 2020 & 2033
- Table 3: Global Marine Anti-Fouling Coating Industry Revenue Million Forecast, by Application 2020 & 2033
- Table 4: Global Marine Anti-Fouling Coating Industry Volume liter Forecast, by Application 2020 & 2033
- Table 5: Global Marine Anti-Fouling Coating Industry Revenue Million Forecast, by Region 2020 & 2033
- Table 6: Global Marine Anti-Fouling Coating Industry Volume liter Forecast, by Region 2020 & 2033
- Table 7: Global Marine Anti-Fouling Coating Industry Revenue Million Forecast, by Type 2020 & 2033
- Table 8: Global Marine Anti-Fouling Coating Industry Volume liter Forecast, by Type 2020 & 2033
- Table 9: Global Marine Anti-Fouling Coating Industry Revenue Million Forecast, by Application 2020 & 2033
- Table 10: Global Marine Anti-Fouling Coating Industry Volume liter Forecast, by Application 2020 & 2033
- Table 11: Global Marine Anti-Fouling Coating Industry Revenue Million Forecast, by Country 2020 & 2033
- Table 12: Global Marine Anti-Fouling Coating Industry Volume liter Forecast, by Country 2020 & 2033
- Table 13: China Marine Anti-Fouling Coating Industry Revenue (Million) Forecast, by Application 2020 & 2033
- Table 14: China Marine Anti-Fouling Coating Industry Volume (liter) Forecast, by Application 2020 & 2033
- Table 15: India Marine Anti-Fouling Coating Industry Revenue (Million) Forecast, by Application 2020 & 2033
- Table 16: India Marine Anti-Fouling Coating Industry Volume (liter) Forecast, by Application 2020 & 2033
- Table 17: Japan Marine Anti-Fouling Coating Industry Revenue (Million) Forecast, by Application 2020 & 2033
- Table 18: Japan Marine Anti-Fouling Coating Industry Volume (liter) Forecast, by Application 2020 & 2033
- Table 19: South Korea Marine Anti-Fouling Coating Industry Revenue (Million) Forecast, by Application 2020 & 2033
- Table 20: South Korea Marine Anti-Fouling Coating Industry Volume (liter) Forecast, by Application 2020 & 2033
- Table 21: Thailand Marine Anti-Fouling Coating Industry Revenue (Million) Forecast, by Application 2020 & 2033
- Table 22: Thailand Marine Anti-Fouling Coating Industry Volume (liter) Forecast, by Application 2020 & 2033
- Table 23: Vietnam Marine Anti-Fouling Coating Industry Revenue (Million) Forecast, by Application 2020 & 2033
- Table 24: Vietnam Marine Anti-Fouling Coating Industry Volume (liter) Forecast, by Application 2020 & 2033
- Table 25: Indonesia Marine Anti-Fouling Coating Industry Revenue (Million) Forecast, by Application 2020 & 2033
- Table 26: Indonesia Marine Anti-Fouling Coating Industry Volume (liter) Forecast, by Application 2020 & 2033
- Table 27: Malaysia Marine Anti-Fouling Coating Industry Revenue (Million) Forecast, by Application 2020 & 2033
- Table 28: Malaysia Marine Anti-Fouling Coating Industry Volume (liter) Forecast, by Application 2020 & 2033
- Table 29: Rest of Asia Pacific Marine Anti-Fouling Coating Industry Revenue (Million) Forecast, by Application 2020 & 2033
- Table 30: Rest of Asia Pacific Marine Anti-Fouling Coating Industry Volume (liter) Forecast, by Application 2020 & 2033
- Table 31: Global Marine Anti-Fouling Coating Industry Revenue Million Forecast, by Type 2020 & 2033
- Table 32: Global Marine Anti-Fouling Coating Industry Volume liter Forecast, by Type 2020 & 2033
- Table 33: Global Marine Anti-Fouling Coating Industry Revenue Million Forecast, by Application 2020 & 2033
- Table 34: Global Marine Anti-Fouling Coating Industry Volume liter Forecast, by Application 2020 & 2033
- Table 35: Global Marine Anti-Fouling Coating Industry Revenue Million Forecast, by Country 2020 & 2033
- Table 36: Global Marine Anti-Fouling Coating Industry Volume liter Forecast, by Country 2020 & 2033
- Table 37: United States Marine Anti-Fouling Coating Industry Revenue (Million) Forecast, by Application 2020 & 2033
- Table 38: United States Marine Anti-Fouling Coating Industry Volume (liter) Forecast, by Application 2020 & 2033
- Table 39: Canada Marine Anti-Fouling Coating Industry Revenue (Million) Forecast, by Application 2020 & 2033
- Table 40: Canada Marine Anti-Fouling Coating Industry Volume (liter) Forecast, by Application 2020 & 2033
- Table 41: Mexico Marine Anti-Fouling Coating Industry Revenue (Million) Forecast, by Application 2020 & 2033
- Table 42: Mexico Marine Anti-Fouling Coating Industry Volume (liter) Forecast, by Application 2020 & 2033
- Table 43: Global Marine Anti-Fouling Coating Industry Revenue Million Forecast, by Type 2020 & 2033
- Table 44: Global Marine Anti-Fouling Coating Industry Volume liter Forecast, by Type 2020 & 2033
- Table 45: Global Marine Anti-Fouling Coating Industry Revenue Million Forecast, by Application 2020 & 2033
- Table 46: Global Marine Anti-Fouling Coating Industry Volume liter Forecast, by Application 2020 & 2033
- Table 47: Global Marine Anti-Fouling Coating Industry Revenue Million Forecast, by Country 2020 & 2033
- Table 48: Global Marine Anti-Fouling Coating Industry Volume liter Forecast, by Country 2020 & 2033
- Table 49: Germany Marine Anti-Fouling Coating Industry Revenue (Million) Forecast, by Application 2020 & 2033
- Table 50: Germany Marine Anti-Fouling Coating Industry Volume (liter) Forecast, by Application 2020 & 2033
- Table 51: United Kingdom Marine Anti-Fouling Coating Industry Revenue (Million) Forecast, by Application 2020 & 2033
- Table 52: United Kingdom Marine Anti-Fouling Coating Industry Volume (liter) Forecast, by Application 2020 & 2033
- Table 53: France Marine Anti-Fouling Coating Industry Revenue (Million) Forecast, by Application 2020 & 2033
- Table 54: France Marine Anti-Fouling Coating Industry Volume (liter) Forecast, by Application 2020 & 2033
- Table 55: Italy Marine Anti-Fouling Coating Industry Revenue (Million) Forecast, by Application 2020 & 2033
- Table 56: Italy Marine Anti-Fouling Coating Industry Volume (liter) Forecast, by Application 2020 & 2033
- Table 57: Spain Marine Anti-Fouling Coating Industry Revenue (Million) Forecast, by Application 2020 & 2033
- Table 58: Spain Marine Anti-Fouling Coating Industry Volume (liter) Forecast, by Application 2020 & 2033
- Table 59: Russia Marine Anti-Fouling Coating Industry Revenue (Million) Forecast, by Application 2020 & 2033
- Table 60: Russia Marine Anti-Fouling Coating Industry Volume (liter) Forecast, by Application 2020 & 2033
- Table 61: NORDIC Countries Marine Anti-Fouling Coating Industry Revenue (Million) Forecast, by Application 2020 & 2033
- Table 62: NORDIC Countries Marine Anti-Fouling Coating Industry Volume (liter) Forecast, by Application 2020 & 2033
- Table 63: Turkey Marine Anti-Fouling Coating Industry Revenue (Million) Forecast, by Application 2020 & 2033
- Table 64: Turkey Marine Anti-Fouling Coating Industry Volume (liter) Forecast, by Application 2020 & 2033
- Table 65: Rest of Europe Marine Anti-Fouling Coating Industry Revenue (Million) Forecast, by Application 2020 & 2033
- Table 66: Rest of Europe Marine Anti-Fouling Coating Industry Volume (liter) Forecast, by Application 2020 & 2033
- Table 67: Global Marine Anti-Fouling Coating Industry Revenue Million Forecast, by Type 2020 & 2033
- Table 68: Global Marine Anti-Fouling Coating Industry Volume liter Forecast, by Type 2020 & 2033
- Table 69: Global Marine Anti-Fouling Coating Industry Revenue Million Forecast, by Application 2020 & 2033
- Table 70: Global Marine Anti-Fouling Coating Industry Volume liter Forecast, by Application 2020 & 2033
- Table 71: Global Marine Anti-Fouling Coating Industry Revenue Million Forecast, by Country 2020 & 2033
- Table 72: Global Marine Anti-Fouling Coating Industry Volume liter Forecast, by Country 2020 & 2033
- Table 73: Brazil Marine Anti-Fouling Coating Industry Revenue (Million) Forecast, by Application 2020 & 2033
- Table 74: Brazil Marine Anti-Fouling Coating Industry Volume (liter) Forecast, by Application 2020 & 2033
- Table 75: Argentina Marine Anti-Fouling Coating Industry Revenue (Million) Forecast, by Application 2020 & 2033
- Table 76: Argentina Marine Anti-Fouling Coating Industry Volume (liter) Forecast, by Application 2020 & 2033
- Table 77: Colombia Marine Anti-Fouling Coating Industry Revenue (Million) Forecast, by Application 2020 & 2033
- Table 78: Colombia Marine Anti-Fouling Coating Industry Volume (liter) Forecast, by Application 2020 & 2033
- Table 79: Rest of South America Marine Anti-Fouling Coating Industry Revenue (Million) Forecast, by Application 2020 & 2033
- Table 80: Rest of South America Marine Anti-Fouling Coating Industry Volume (liter) Forecast, by Application 2020 & 2033
- Table 81: Global Marine Anti-Fouling Coating Industry Revenue Million Forecast, by Type 2020 & 2033
- Table 82: Global Marine Anti-Fouling Coating Industry Volume liter Forecast, by Type 2020 & 2033
- Table 83: Global Marine Anti-Fouling Coating Industry Revenue Million Forecast, by Application 2020 & 2033
- Table 84: Global Marine Anti-Fouling Coating Industry Volume liter Forecast, by Application 2020 & 2033
- Table 85: Global Marine Anti-Fouling Coating Industry Revenue Million Forecast, by Country 2020 & 2033
- Table 86: Global Marine Anti-Fouling Coating Industry Volume liter Forecast, by Country 2020 & 2033
- Table 87: Saudi Arabia Marine Anti-Fouling Coating Industry Revenue (Million) Forecast, by Application 2020 & 2033
- Table 88: Saudi Arabia Marine Anti-Fouling Coating Industry Volume (liter) Forecast, by Application 2020 & 2033
- Table 89: South Africa Marine Anti-Fouling Coating Industry Revenue (Million) Forecast, by Application 2020 & 2033
- Table 90: South Africa Marine Anti-Fouling Coating Industry Volume (liter) Forecast, by Application 2020 & 2033
- Table 91: Nigeria Marine Anti-Fouling Coating Industry Revenue (Million) Forecast, by Application 2020 & 2033
- Table 92: Nigeria Marine Anti-Fouling Coating Industry Volume (liter) Forecast, by Application 2020 & 2033
- Table 93: United Arab Emirates Marine Anti-Fouling Coating Industry Revenue (Million) Forecast, by Application 2020 & 2033
- Table 94: United Arab Emirates Marine Anti-Fouling Coating Industry Volume (liter) Forecast, by Application 2020 & 2033
- Table 95: Qatar Marine Anti-Fouling Coating Industry Revenue (Million) Forecast, by Application 2020 & 2033
- Table 96: Qatar Marine Anti-Fouling Coating Industry Volume (liter) Forecast, by Application 2020 & 2033
- Table 97: Egypt Marine Anti-Fouling Coating Industry Revenue (Million) Forecast, by Application 2020 & 2033
- Table 98: Egypt Marine Anti-Fouling Coating Industry Volume (liter) Forecast, by Application 2020 & 2033
- Table 99: Rest of Middle East and Africa Marine Anti-Fouling Coating Industry Revenue (Million) Forecast, by Application 2020 & 2033
- Table 100: Rest of Middle East and Africa Marine Anti-Fouling Coating Industry Volume (liter) Forecast, by Application 2020 & 2033
Frequently Asked Questions
1. What is the projected Compound Annual Growth Rate (CAGR) of the Marine Anti-Fouling Coating Industry?
The projected CAGR is approximately > 4.00%.
2. Which companies are prominent players in the Marine Anti-Fouling Coating Industry?
Key companies in the market include The Sherwin-Williams Company*List Not Exhaustive, Axalta Coatings Systems, Chugoku Marine Paints Ltd, Jotun, Boero, RPM International Inc, Kansai Paint Co Ltd, Akzo Nobel NV, PPG Industries Inc, Nippon Paint Marine Coatings Co Ltd, BASF SE, Hempel A/S, Lanxess.
3. What are the main segments of the Marine Anti-Fouling Coating Industry?
The market segments include Type, Application.
4. Can you provide details about the market size?
The market size is estimated to be USD 1.97 Million as of 2022.
5. What are some drivers contributing to market growth?
Increasing Production of Leisure Boats and Cruise Ships; Increase in Ship Repairs and Maintenance Activities; Surging Demand from Oil and Gas Industry.
6. What are the notable trends driving market growth?
Hull Coatings Segment to Dominate the Market.
7. Are there any restraints impacting market growth?
Stringent Government Regulations; Increased Usage of High-standard Durable Products.
8. Can you provide examples of recent developments in the market?
March 2024: PPG Industries Inc. launched PPG Nexeon 810, a copper-free antifouling coating developed with an emphasis on vessel performance, emissions reduction, and sustainability. It can yield an immediate boost in power of up to 10% and enhance operational efficiency by up to 15% due to improved fouling control performance.
9. What pricing options are available for accessing the report?
Pricing options include single-user, multi-user, and enterprise licenses priced at USD 4750, USD 5250, and USD 8750 respectively.
10. Is the market size provided in terms of value or volume?
The market size is provided in terms of value, measured in Million and volume, measured in liter.
11. Are there any specific market keywords associated with the report?
Yes, the market keyword associated with the report is "Marine Anti-Fouling Coating Industry," which aids in identifying and referencing the specific market segment covered.
12. How do I determine which pricing option suits my needs best?
The pricing options vary based on user requirements and access needs. Individual users may opt for single-user licenses, while businesses requiring broader access may choose multi-user or enterprise licenses for cost-effective access to the report.
13. Are there any additional resources or data provided in the Marine Anti-Fouling Coating Industry report?
While the report offers comprehensive insights, it's advisable to review the specific contents or supplementary materials provided to ascertain if additional resources or data are available.
14. How can I stay updated on further developments or reports in the Marine Anti-Fouling Coating Industry?
To stay informed about further developments, trends, and reports in the Marine Anti-Fouling Coating Industry, consider subscribing to industry newsletters, following relevant companies and organizations, or regularly checking reputable industry news sources and publications.
Methodology
Step 1 - Identification of Relevant Samples Size from Population Database


Step 2 - Approaches for Defining Global Market Size (Value, Volume* & Price*)

Note*: In applicable scenarios
Step 3 - Data Sources
Primary Research
- Web Analytics
- Survey Reports
- Research Institute
- Latest Research Reports
- Opinion Leaders
Secondary Research
- Annual Reports
- White Paper
- Latest Press Release
- Industry Association
- Paid Database
- Investor Presentations

Step 4 - Data Triangulation
Involves using different sources of information in order to increase the validity of a study
These sources are likely to be stakeholders in a program - participants, other researchers, program staff, other community members, and so on.
Then we put all data in single framework & apply various statistical tools to find out the dynamic on the market.
During the analysis stage, feedback from the stakeholder groups would be compared to determine areas of agreement as well as areas of divergence