

Key Insights
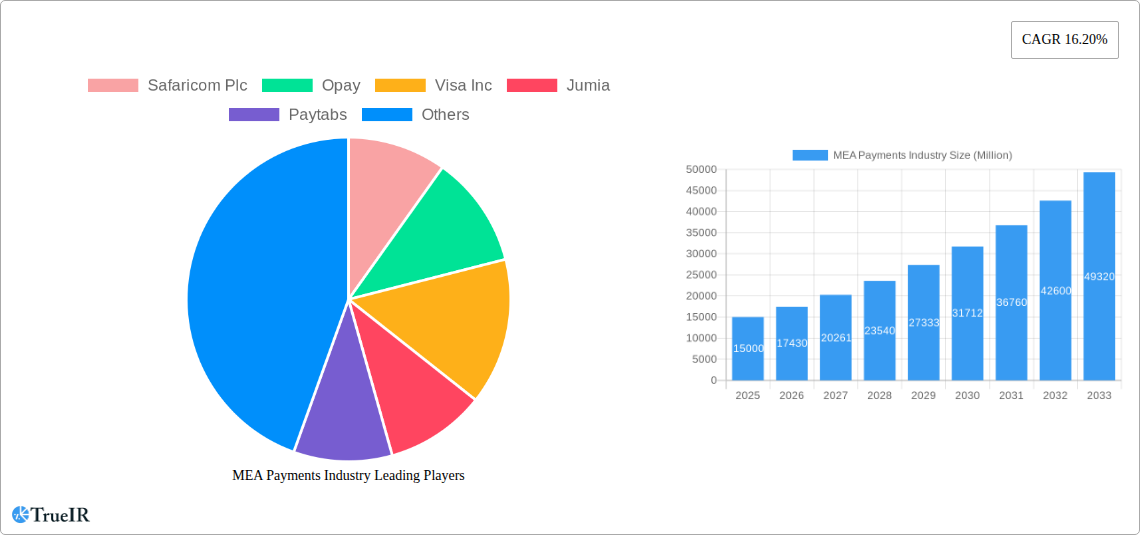
The Middle East and Africa (MEA) payments industry is experiencing robust growth, driven by factors such as rising smartphone penetration, increasing internet and mobile banking adoption, and a burgeoning e-commerce sector. The region's young and digitally-savvy population is readily embracing cashless transactions, fueling demand for diverse payment solutions. A 16.20% Compound Annual Growth Rate (CAGR) indicates a significant expansion, with the market projected to reach substantial value over the forecast period (2025-2033). Key growth segments include online sales, particularly within retail, entertainment, and healthcare sectors. While point-of-sale (POS) systems remain prevalent, mobile payment solutions are rapidly gaining traction, facilitated by the widespread availability of mobile money platforms. Growth is unevenly distributed geographically, with countries like South Africa, the United Arab Emirates, and Saudi Arabia leading the charge due to robust infrastructure and supportive regulatory frameworks. However, challenges remain, including varying levels of digital literacy across the region and infrastructural limitations in some areas. Nevertheless, the overall outlook for the MEA payments industry remains highly positive, presenting significant opportunities for both established players and emerging fintech companies.
The competitive landscape is dynamic, with a mix of global giants like Visa and Mastercard alongside regional and local players such as Safaricom, Opay, and Jumia. These companies are vying for market share through strategic partnerships, technological innovations, and expansion into new markets. The industry's future trajectory will hinge on the continued expansion of digital infrastructure, the development of secure and interoperable payment systems, and the adoption of innovative technologies such as blockchain and artificial intelligence. Regulatory frameworks also play a critical role in shaping market development. Progressive policies promoting financial inclusion and encouraging digital payments will further propel the industry's growth. This competitive environment will drive innovation, further enhancing the user experience and making digital payments more accessible and convenient for consumers across the MEA region.
MEA Payments Industry: A Comprehensive Market Report (2019-2033)
This dynamic report provides a comprehensive analysis of the Middle East and Africa (MEA) payments industry, offering invaluable insights for investors, businesses, and industry professionals. Leveraging extensive data from 2019-2024 (historical period) and projecting to 2033, this report covers market size, key segments, competitive dynamics, and future growth potential. The base year for estimations and forecasts is 2025. The forecast period spans 2025-2033. The market is expected to reach xx Million by 2033, exhibiting a CAGR of xx%.
MEA Payments Industry Market Structure & Competitive Landscape
The MEA payments landscape is characterized by a dynamic mix of established players and innovative startups. Market concentration is moderate, with a few dominant players like Visa Inc and Safaricom Plc alongside a large number of regional and niche players such as Opay, Jumia, Paytabs, PalmPay Technology Co Ltd, Interswitch Ltd, Amazon com Inc, Apple Inc, and Network International Holdings Plc. The industry is witnessing significant M&A activity, with an estimated xx Million in transactions during 2019-2024. Concentration ratios, calculated using the Herfindahl-Hirschman Index (HHI), suggest a moderately competitive market with xx for the top 5 players and xx for the top 10. This competitive landscape is further shaped by:
- Innovation Drivers: Mobile money, digital wallets, and fintech innovations are driving rapid growth.
- Regulatory Impacts: Government regulations on data privacy, cross-border payments, and licensing are key influences.
- Product Substitutes: Cash remains a significant competitor, especially in less developed regions.
- End-User Segmentation: The market is diverse, encompassing retail, entertainment, healthcare, hospitality, and other industries.
- M&A Trends: Consolidation is expected to continue, driven by the need for scale and technological advancements.
MEA Payments Industry Market Trends & Opportunities
The MEA payments market is experiencing explosive growth, fueled by increasing smartphone penetration, rising internet usage, and a burgeoning e-commerce sector. The market size was valued at xx Million in 2024 and is projected to reach xx Million by 2033. Key trends driving this expansion include:
- Technological Shifts: The rapid adoption of mobile payments, digital wallets, and biometric authentication is transforming the industry.
- Consumer Preferences: Consumers increasingly prefer convenient, cashless payment options.
- Competitive Dynamics: Intense competition is fostering innovation and driving down transaction costs.
- Market Penetration: While penetration rates vary across the region, significant growth potential remains, particularly in underserved markets.
The report identifies several lucrative opportunities for businesses, including the expansion of digital payment services in rural areas, the development of innovative payment solutions tailored to specific industry needs, and strategic partnerships to enhance market reach.

Dominant Markets & Segments in MEA Payments Industry
The MEA payments industry is characterized by diverse growth across regions and segments. While specific market share data requires detailed analysis within the full report, initial indications suggest the following:
- By Country: South Africa, the United Arab Emirates, and Saudi Arabia represent significant markets, driven by strong economic activity and supportive regulatory environments. The "Rest of MEA" segment also shows notable growth potential.
- By End-user Industry: The retail sector is a major driver, followed by entertainment and hospitality. Growth in the healthcare and other end-user industries shows strong potential.
- By Mode of Payment: Point-of-sale (POS) payments are dominant, although mobile money and online payment methods are rapidly gaining traction.
- Others: Online Sale: E-commerce is boosting online payment transactions rapidly.
Key Growth Drivers:
- Robust infrastructure development: Expanding internet and mobile network coverage is critical.
- Supportive government policies: Initiatives to promote financial inclusion and digitalization are crucial.
- Increasing financial literacy: Educating consumers on the benefits of digital payments is essential.
MEA Payments Industry Product Analysis
The MEA payments industry is witnessing a surge in innovative payment solutions, including mobile wallets, contactless payments, biometric authentication, and blockchain-based technologies. These products offer enhanced security, convenience, and efficiency, catering to the diverse needs of consumers and businesses across the region. The market is seeing increasing adoption of integrated payment platforms that combine multiple payment methods to provide a seamless experience.
Key Drivers, Barriers & Challenges in MEA Payments Industry
Key Drivers:
- Technological advancements: Mobile money, digital wallets, and biometric authentication are transforming the industry.
- Economic growth: Rising incomes and increased consumer spending are driving demand.
- Supportive government policies: Initiatives to promote financial inclusion are crucial.
Key Challenges:
- Regulatory hurdles: Varying regulations across countries create complexities for businesses.
- Supply chain issues: Infrastructure limitations and cybersecurity threats pose significant challenges.
- Competitive pressures: Intense competition necessitates continuous innovation. For example, the competition between M-Pesa and other mobile payment systems in certain markets limits individual growth potential.
Growth Drivers in the MEA Payments Industry Market
The MEA payments industry is propelled by a confluence of factors, including technological innovations like mobile money and digital wallets, the rise of e-commerce, supportive government policies aiming for financial inclusion, and increasing consumer adoption of cashless transactions. The expanding mobile network coverage and improving digital literacy contribute significantly to market growth.
Challenges Impacting MEA Payments Industry Growth
Significant challenges include limited financial inclusion in certain areas, cybersecurity risks, varying regulatory landscapes across countries, and infrastructure gaps in some regions. These factors can hinder seamless and widespread adoption of digital payment systems.
Key Players Shaping the MEA Payments Industry Market
- Safaricom Plc
- Opay
- Visa Inc
- Jumia
- Paytabs
- PalmPay Technology Co Ltd
- Interswitch Ltd
- Amazon com Inc
- Apple Inc
- Network International Holdings Plc
Significant MEA Payments Industry Industry Milestones
- August 2021: Visa launched digital payments in Sudan, collaborating with eight partners.
- June 2022: LINX established its first African interconnection facility in Nairobi through a partnership with IXAfrica. This development significantly enhances internet infrastructure and potentially supports the growth of digital payments.
Future Outlook for MEA Payments Industry Market
The MEA payments industry is poised for continued robust growth, driven by increasing smartphone penetration, expanding internet access, and government initiatives promoting financial inclusion. Strategic investments in infrastructure, innovative payment solutions, and strategic partnerships will be crucial for success. The market presents substantial opportunities for businesses to capitalize on the region's evolving digital landscape and tap into its substantial growth potential.
MEA Payments Industry Segmentation
-
1. Mode of Payment
-
1.1. Point of Sale
- 1.1.1. Card Pay
- 1.1.2. Digital Wallet (Includes Mobile Wallets)
- 1.1.3. Cash
- 1.1.4. Others
-
1.2. Online Sale
- 1.2.1. Others (
-
1.1. Point of Sale
-
2. End-user Industry
- 2.1. Retail
- 2.2. Entertainment
- 2.3. Healthcare
- 2.4. Hospitality
- 2.5. Other End-user Industries
MEA Payments Industry Segmentation By Geography
-
1. North America
- 1.1. United States
- 1.2. Canada
- 1.3. Mexico
-
2. South America
- 2.1. Brazil
- 2.2. Argentina
- 2.3. Rest of South America
-
3. Europe
- 3.1. United Kingdom
- 3.2. Germany
- 3.3. France
- 3.4. Italy
- 3.5. Spain
- 3.6. Russia
- 3.7. Benelux
- 3.8. Nordics
- 3.9. Rest of Europe
-
4. Middle East & Africa
- 4.1. Turkey
- 4.2. Israel
- 4.3. GCC
- 4.4. North Africa
- 4.5. South Africa
- 4.6. Rest of Middle East & Africa
-
5. Asia Pacific
- 5.1. China
- 5.2. India
- 5.3. Japan
- 5.4. South Korea
- 5.5. ASEAN
- 5.6. Oceania
- 5.7. Rest of Asia Pacific

MEA Payments Industry REPORT HIGHLIGHTS
| Aspects | Details |
|---|---|
| Study Period | 2019-2033 |
| Base Year | 2024 |
| Estimated Year | 2025 |
| Forecast Period | 2025-2033 |
| Historical Period | 2019-2024 |
| Growth Rate | CAGR of 16.20% from 2019-2033 |
| Segmentation |
|
Table of Contents
- 1. Introduction
- 1.1. Research Scope
- 1.2. Market Segmentation
- 1.3. Research Methodology
- 1.4. Definitions and Assumptions
- 2. Executive Summary
- 2.1. Introduction
- 3. Market Dynamics
- 3.1. Introduction
- 3.2. Market Drivers
- 3.2.1 Digital adoption is Accelerating the Payments Market in Middle East and Africa; Key Retailers and the Government are Promoting Market Digitization Through Activation Programs; Increase in Real-Time Payments
- 3.2.2 Particularly Buy Now Pay Later
- 3.3. Market Restrains
- 3.3.1. Lack of Standards in Applications and Initial Costs
- 3.4. Market Trends
- 3.4.1. Digital adoption is Accelerating the Payments Market in Middle East and Africa
- 4. Market Factor Analysis
- 4.1. Porters Five Forces
- 4.2. Supply/Value Chain
- 4.3. PESTEL analysis
- 4.4. Market Entropy
- 4.5. Patent/Trademark Analysis
- 5. Global MEA Payments Industry Analysis, Insights and Forecast, 2019-2031
- 5.1. Market Analysis, Insights and Forecast - by Mode of Payment
- 5.1.1. Point of Sale
- 5.1.1.1. Card Pay
- 5.1.1.2. Digital Wallet (Includes Mobile Wallets)
- 5.1.1.3. Cash
- 5.1.1.4. Others
- 5.1.2. Online Sale
- 5.1.2.1. Others (
- 5.1.1. Point of Sale
- 5.2. Market Analysis, Insights and Forecast - by End-user Industry
- 5.2.1. Retail
- 5.2.2. Entertainment
- 5.2.3. Healthcare
- 5.2.4. Hospitality
- 5.2.5. Other End-user Industries
- 5.3. Market Analysis, Insights and Forecast - by Region
- 5.3.1. North America
- 5.3.2. South America
- 5.3.3. Europe
- 5.3.4. Middle East & Africa
- 5.3.5. Asia Pacific
- 5.1. Market Analysis, Insights and Forecast - by Mode of Payment
- 6. North America MEA Payments Industry Analysis, Insights and Forecast, 2019-2031
- 6.1. Market Analysis, Insights and Forecast - by Mode of Payment
- 6.1.1. Point of Sale
- 6.1.1.1. Card Pay
- 6.1.1.2. Digital Wallet (Includes Mobile Wallets)
- 6.1.1.3. Cash
- 6.1.1.4. Others
- 6.1.2. Online Sale
- 6.1.2.1. Others (
- 6.1.1. Point of Sale
- 6.2. Market Analysis, Insights and Forecast - by End-user Industry
- 6.2.1. Retail
- 6.2.2. Entertainment
- 6.2.3. Healthcare
- 6.2.4. Hospitality
- 6.2.5. Other End-user Industries
- 6.1. Market Analysis, Insights and Forecast - by Mode of Payment
- 7. South America MEA Payments Industry Analysis, Insights and Forecast, 2019-2031
- 7.1. Market Analysis, Insights and Forecast - by Mode of Payment
- 7.1.1. Point of Sale
- 7.1.1.1. Card Pay
- 7.1.1.2. Digital Wallet (Includes Mobile Wallets)
- 7.1.1.3. Cash
- 7.1.1.4. Others
- 7.1.2. Online Sale
- 7.1.2.1. Others (
- 7.1.1. Point of Sale
- 7.2. Market Analysis, Insights and Forecast - by End-user Industry
- 7.2.1. Retail
- 7.2.2. Entertainment
- 7.2.3. Healthcare
- 7.2.4. Hospitality
- 7.2.5. Other End-user Industries
- 7.1. Market Analysis, Insights and Forecast - by Mode of Payment
- 8. Europe MEA Payments Industry Analysis, Insights and Forecast, 2019-2031
- 8.1. Market Analysis, Insights and Forecast - by Mode of Payment
- 8.1.1. Point of Sale
- 8.1.1.1. Card Pay
- 8.1.1.2. Digital Wallet (Includes Mobile Wallets)
- 8.1.1.3. Cash
- 8.1.1.4. Others
- 8.1.2. Online Sale
- 8.1.2.1. Others (
- 8.1.1. Point of Sale
- 8.2. Market Analysis, Insights and Forecast - by End-user Industry
- 8.2.1. Retail
- 8.2.2. Entertainment
- 8.2.3. Healthcare
- 8.2.4. Hospitality
- 8.2.5. Other End-user Industries
- 8.1. Market Analysis, Insights and Forecast - by Mode of Payment
- 9. Middle East & Africa MEA Payments Industry Analysis, Insights and Forecast, 2019-2031
- 9.1. Market Analysis, Insights and Forecast - by Mode of Payment
- 9.1.1. Point of Sale
- 9.1.1.1. Card Pay
- 9.1.1.2. Digital Wallet (Includes Mobile Wallets)
- 9.1.1.3. Cash
- 9.1.1.4. Others
- 9.1.2. Online Sale
- 9.1.2.1. Others (
- 9.1.1. Point of Sale
- 9.2. Market Analysis, Insights and Forecast - by End-user Industry
- 9.2.1. Retail
- 9.2.2. Entertainment
- 9.2.3. Healthcare
- 9.2.4. Hospitality
- 9.2.5. Other End-user Industries
- 9.1. Market Analysis, Insights and Forecast - by Mode of Payment
- 10. Asia Pacific MEA Payments Industry Analysis, Insights and Forecast, 2019-2031
- 10.1. Market Analysis, Insights and Forecast - by Mode of Payment
- 10.1.1. Point of Sale
- 10.1.1.1. Card Pay
- 10.1.1.2. Digital Wallet (Includes Mobile Wallets)
- 10.1.1.3. Cash
- 10.1.1.4. Others
- 10.1.2. Online Sale
- 10.1.2.1. Others (
- 10.1.1. Point of Sale
- 10.2. Market Analysis, Insights and Forecast - by End-user Industry
- 10.2.1. Retail
- 10.2.2. Entertainment
- 10.2.3. Healthcare
- 10.2.4. Hospitality
- 10.2.5. Other End-user Industries
- 10.1. Market Analysis, Insights and Forecast - by Mode of Payment
- 11. North America MEA Payments Industry Analysis, Insights and Forecast, 2019-2031
- 11.1. Market Analysis, Insights and Forecast - By Country/Sub-region
- 11.1.1 United States
- 11.1.2 Canada
- 12. Europe MEA Payments Industry Analysis, Insights and Forecast, 2019-2031
- 12.1. Market Analysis, Insights and Forecast - By Country/Sub-region
- 12.1.1 United Kingdom
- 12.1.2 France
- 12.1.3 Rest of Europe
- 13. Asia Pacific MEA Payments Industry Analysis, Insights and Forecast, 2019-2031
- 13.1. Market Analysis, Insights and Forecast - By Country/Sub-region
- 13.1.1 China
- 13.1.2 Rest of Asia Pacific
- 14. Rest of the World MEA Payments Industry Analysis, Insights and Forecast, 2019-2031
- 14.1. Market Analysis, Insights and Forecast - By Country/Sub-region
- 14.1.1.
- 15. Competitive Analysis
- 15.1. Global Market Share Analysis 2024
- 15.2. Company Profiles
- 15.2.1 Safaricom Plc
- 15.2.1.1. Overview
- 15.2.1.2. Products
- 15.2.1.3. SWOT Analysis
- 15.2.1.4. Recent Developments
- 15.2.1.5. Financials (Based on Availability)
- 15.2.2 Opay
- 15.2.2.1. Overview
- 15.2.2.2. Products
- 15.2.2.3. SWOT Analysis
- 15.2.2.4. Recent Developments
- 15.2.2.5. Financials (Based on Availability)
- 15.2.3 Visa Inc
- 15.2.3.1. Overview
- 15.2.3.2. Products
- 15.2.3.3. SWOT Analysis
- 15.2.3.4. Recent Developments
- 15.2.3.5. Financials (Based on Availability)
- 15.2.4 Jumia
- 15.2.4.1. Overview
- 15.2.4.2. Products
- 15.2.4.3. SWOT Analysis
- 15.2.4.4. Recent Developments
- 15.2.4.5. Financials (Based on Availability)
- 15.2.5 Paytabs
- 15.2.5.1. Overview
- 15.2.5.2. Products
- 15.2.5.3. SWOT Analysis
- 15.2.5.4. Recent Developments
- 15.2.5.5. Financials (Based on Availability)
- 15.2.6 PalmPay Technology Co Ltd
- 15.2.6.1. Overview
- 15.2.6.2. Products
- 15.2.6.3. SWOT Analysis
- 15.2.6.4. Recent Developments
- 15.2.6.5. Financials (Based on Availability)
- 15.2.7 Interswitch Ltd
- 15.2.7.1. Overview
- 15.2.7.2. Products
- 15.2.7.3. SWOT Analysis
- 15.2.7.4. Recent Developments
- 15.2.7.5. Financials (Based on Availability)
- 15.2.8 Amazon com Inc *List Not Exhaustive
- 15.2.8.1. Overview
- 15.2.8.2. Products
- 15.2.8.3. SWOT Analysis
- 15.2.8.4. Recent Developments
- 15.2.8.5. Financials (Based on Availability)
- 15.2.9 Apple Inc
- 15.2.9.1. Overview
- 15.2.9.2. Products
- 15.2.9.3. SWOT Analysis
- 15.2.9.4. Recent Developments
- 15.2.9.5. Financials (Based on Availability)
- 15.2.10 Network International Holdings Plc
- 15.2.10.1. Overview
- 15.2.10.2. Products
- 15.2.10.3. SWOT Analysis
- 15.2.10.4. Recent Developments
- 15.2.10.5. Financials (Based on Availability)
- 15.2.1 Safaricom Plc
List of Figures
- Figure 1: Global MEA Payments Industry Revenue Breakdown (Million, %) by Region 2024 & 2032
- Figure 2: North America MEA Payments Industry Revenue (Million), by Country 2024 & 2032
- Figure 3: North America MEA Payments Industry Revenue Share (%), by Country 2024 & 2032
- Figure 4: Europe MEA Payments Industry Revenue (Million), by Country 2024 & 2032
- Figure 5: Europe MEA Payments Industry Revenue Share (%), by Country 2024 & 2032
- Figure 6: Asia Pacific MEA Payments Industry Revenue (Million), by Country 2024 & 2032
- Figure 7: Asia Pacific MEA Payments Industry Revenue Share (%), by Country 2024 & 2032
- Figure 8: Rest of the World MEA Payments Industry Revenue (Million), by Country 2024 & 2032
- Figure 9: Rest of the World MEA Payments Industry Revenue Share (%), by Country 2024 & 2032
- Figure 10: North America MEA Payments Industry Revenue (Million), by Mode of Payment 2024 & 2032
- Figure 11: North America MEA Payments Industry Revenue Share (%), by Mode of Payment 2024 & 2032
- Figure 12: North America MEA Payments Industry Revenue (Million), by End-user Industry 2024 & 2032
- Figure 13: North America MEA Payments Industry Revenue Share (%), by End-user Industry 2024 & 2032
- Figure 14: North America MEA Payments Industry Revenue (Million), by Country 2024 & 2032
- Figure 15: North America MEA Payments Industry Revenue Share (%), by Country 2024 & 2032
- Figure 16: South America MEA Payments Industry Revenue (Million), by Mode of Payment 2024 & 2032
- Figure 17: South America MEA Payments Industry Revenue Share (%), by Mode of Payment 2024 & 2032
- Figure 18: South America MEA Payments Industry Revenue (Million), by End-user Industry 2024 & 2032
- Figure 19: South America MEA Payments Industry Revenue Share (%), by End-user Industry 2024 & 2032
- Figure 20: South America MEA Payments Industry Revenue (Million), by Country 2024 & 2032
- Figure 21: South America MEA Payments Industry Revenue Share (%), by Country 2024 & 2032
- Figure 22: Europe MEA Payments Industry Revenue (Million), by Mode of Payment 2024 & 2032
- Figure 23: Europe MEA Payments Industry Revenue Share (%), by Mode of Payment 2024 & 2032
- Figure 24: Europe MEA Payments Industry Revenue (Million), by End-user Industry 2024 & 2032
- Figure 25: Europe MEA Payments Industry Revenue Share (%), by End-user Industry 2024 & 2032
- Figure 26: Europe MEA Payments Industry Revenue (Million), by Country 2024 & 2032
- Figure 27: Europe MEA Payments Industry Revenue Share (%), by Country 2024 & 2032
- Figure 28: Middle East & Africa MEA Payments Industry Revenue (Million), by Mode of Payment 2024 & 2032
- Figure 29: Middle East & Africa MEA Payments Industry Revenue Share (%), by Mode of Payment 2024 & 2032
- Figure 30: Middle East & Africa MEA Payments Industry Revenue (Million), by End-user Industry 2024 & 2032
- Figure 31: Middle East & Africa MEA Payments Industry Revenue Share (%), by End-user Industry 2024 & 2032
- Figure 32: Middle East & Africa MEA Payments Industry Revenue (Million), by Country 2024 & 2032
- Figure 33: Middle East & Africa MEA Payments Industry Revenue Share (%), by Country 2024 & 2032
- Figure 34: Asia Pacific MEA Payments Industry Revenue (Million), by Mode of Payment 2024 & 2032
- Figure 35: Asia Pacific MEA Payments Industry Revenue Share (%), by Mode of Payment 2024 & 2032
- Figure 36: Asia Pacific MEA Payments Industry Revenue (Million), by End-user Industry 2024 & 2032
- Figure 37: Asia Pacific MEA Payments Industry Revenue Share (%), by End-user Industry 2024 & 2032
- Figure 38: Asia Pacific MEA Payments Industry Revenue (Million), by Country 2024 & 2032
- Figure 39: Asia Pacific MEA Payments Industry Revenue Share (%), by Country 2024 & 2032
List of Tables
- Table 1: Global MEA Payments Industry Revenue Million Forecast, by Region 2019 & 2032
- Table 2: Global MEA Payments Industry Revenue Million Forecast, by Mode of Payment 2019 & 2032
- Table 3: Global MEA Payments Industry Revenue Million Forecast, by End-user Industry 2019 & 2032
- Table 4: Global MEA Payments Industry Revenue Million Forecast, by Region 2019 & 2032
- Table 5: Global MEA Payments Industry Revenue Million Forecast, by Country 2019 & 2032
- Table 6: United States MEA Payments Industry Revenue (Million) Forecast, by Application 2019 & 2032
- Table 7: Canada MEA Payments Industry Revenue (Million) Forecast, by Application 2019 & 2032
- Table 8: Global MEA Payments Industry Revenue Million Forecast, by Country 2019 & 2032
- Table 9: United Kingdom MEA Payments Industry Revenue (Million) Forecast, by Application 2019 & 2032
- Table 10: France MEA Payments Industry Revenue (Million) Forecast, by Application 2019 & 2032
- Table 11: Rest of Europe MEA Payments Industry Revenue (Million) Forecast, by Application 2019 & 2032
- Table 12: Global MEA Payments Industry Revenue Million Forecast, by Country 2019 & 2032
- Table 13: China MEA Payments Industry Revenue (Million) Forecast, by Application 2019 & 2032
- Table 14: Rest of Asia Pacific MEA Payments Industry Revenue (Million) Forecast, by Application 2019 & 2032
- Table 15: Global MEA Payments Industry Revenue Million Forecast, by Country 2019 & 2032
- Table 16: MEA Payments Industry Revenue (Million) Forecast, by Application 2019 & 2032
- Table 17: Global MEA Payments Industry Revenue Million Forecast, by Mode of Payment 2019 & 2032
- Table 18: Global MEA Payments Industry Revenue Million Forecast, by End-user Industry 2019 & 2032
- Table 19: Global MEA Payments Industry Revenue Million Forecast, by Country 2019 & 2032
- Table 20: United States MEA Payments Industry Revenue (Million) Forecast, by Application 2019 & 2032
- Table 21: Canada MEA Payments Industry Revenue (Million) Forecast, by Application 2019 & 2032
- Table 22: Mexico MEA Payments Industry Revenue (Million) Forecast, by Application 2019 & 2032
- Table 23: Global MEA Payments Industry Revenue Million Forecast, by Mode of Payment 2019 & 2032
- Table 24: Global MEA Payments Industry Revenue Million Forecast, by End-user Industry 2019 & 2032
- Table 25: Global MEA Payments Industry Revenue Million Forecast, by Country 2019 & 2032
- Table 26: Brazil MEA Payments Industry Revenue (Million) Forecast, by Application 2019 & 2032
- Table 27: Argentina MEA Payments Industry Revenue (Million) Forecast, by Application 2019 & 2032
- Table 28: Rest of South America MEA Payments Industry Revenue (Million) Forecast, by Application 2019 & 2032
- Table 29: Global MEA Payments Industry Revenue Million Forecast, by Mode of Payment 2019 & 2032
- Table 30: Global MEA Payments Industry Revenue Million Forecast, by End-user Industry 2019 & 2032
- Table 31: Global MEA Payments Industry Revenue Million Forecast, by Country 2019 & 2032
- Table 32: United Kingdom MEA Payments Industry Revenue (Million) Forecast, by Application 2019 & 2032
- Table 33: Germany MEA Payments Industry Revenue (Million) Forecast, by Application 2019 & 2032
- Table 34: France MEA Payments Industry Revenue (Million) Forecast, by Application 2019 & 2032
- Table 35: Italy MEA Payments Industry Revenue (Million) Forecast, by Application 2019 & 2032
- Table 36: Spain MEA Payments Industry Revenue (Million) Forecast, by Application 2019 & 2032
- Table 37: Russia MEA Payments Industry Revenue (Million) Forecast, by Application 2019 & 2032
- Table 38: Benelux MEA Payments Industry Revenue (Million) Forecast, by Application 2019 & 2032
- Table 39: Nordics MEA Payments Industry Revenue (Million) Forecast, by Application 2019 & 2032
- Table 40: Rest of Europe MEA Payments Industry Revenue (Million) Forecast, by Application 2019 & 2032
- Table 41: Global MEA Payments Industry Revenue Million Forecast, by Mode of Payment 2019 & 2032
- Table 42: Global MEA Payments Industry Revenue Million Forecast, by End-user Industry 2019 & 2032
- Table 43: Global MEA Payments Industry Revenue Million Forecast, by Country 2019 & 2032
- Table 44: Turkey MEA Payments Industry Revenue (Million) Forecast, by Application 2019 & 2032
- Table 45: Israel MEA Payments Industry Revenue (Million) Forecast, by Application 2019 & 2032
- Table 46: GCC MEA Payments Industry Revenue (Million) Forecast, by Application 2019 & 2032
- Table 47: North Africa MEA Payments Industry Revenue (Million) Forecast, by Application 2019 & 2032
- Table 48: South Africa MEA Payments Industry Revenue (Million) Forecast, by Application 2019 & 2032
- Table 49: Rest of Middle East & Africa MEA Payments Industry Revenue (Million) Forecast, by Application 2019 & 2032
- Table 50: Global MEA Payments Industry Revenue Million Forecast, by Mode of Payment 2019 & 2032
- Table 51: Global MEA Payments Industry Revenue Million Forecast, by End-user Industry 2019 & 2032
- Table 52: Global MEA Payments Industry Revenue Million Forecast, by Country 2019 & 2032
- Table 53: China MEA Payments Industry Revenue (Million) Forecast, by Application 2019 & 2032
- Table 54: India MEA Payments Industry Revenue (Million) Forecast, by Application 2019 & 2032
- Table 55: Japan MEA Payments Industry Revenue (Million) Forecast, by Application 2019 & 2032
- Table 56: South Korea MEA Payments Industry Revenue (Million) Forecast, by Application 2019 & 2032
- Table 57: ASEAN MEA Payments Industry Revenue (Million) Forecast, by Application 2019 & 2032
- Table 58: Oceania MEA Payments Industry Revenue (Million) Forecast, by Application 2019 & 2032
- Table 59: Rest of Asia Pacific MEA Payments Industry Revenue (Million) Forecast, by Application 2019 & 2032
Frequently Asked Questions
1. What is the projected Compound Annual Growth Rate (CAGR) of the MEA Payments Industry?
The projected CAGR is approximately 16.20%.
2. Which companies are prominent players in the MEA Payments Industry?
Key companies in the market include Safaricom Plc, Opay, Visa Inc, Jumia, Paytabs, PalmPay Technology Co Ltd, Interswitch Ltd, Amazon com Inc *List Not Exhaustive, Apple Inc, Network International Holdings Plc.
3. What are the main segments of the MEA Payments Industry?
The market segments include Mode of Payment, End-user Industry.
4. Can you provide details about the market size?
The market size is estimated to be USD XX Million as of 2022.
5. What are some drivers contributing to market growth?
Digital adoption is Accelerating the Payments Market in Middle East and Africa; Key Retailers and the Government are Promoting Market Digitization Through Activation Programs; Increase in Real-Time Payments. Particularly Buy Now Pay Later.
6. What are the notable trends driving market growth?
Digital adoption is Accelerating the Payments Market in Middle East and Africa.
7. Are there any restraints impacting market growth?
Lack of Standards in Applications and Initial Costs.
8. Can you provide examples of recent developments in the market?
June 2022 - The London Internet Exchange (LINX), one of the world's largest internet exchange points (IXPs), has announced a strategic partnership with IXAfrica, a Nairobi-based hyperscale data center provider. As part of the agreement, LINX will open a new interconnection facility in Nairobi, marking the company's first physical presence on the African continent.
9. What pricing options are available for accessing the report?
Pricing options include single-user, multi-user, and enterprise licenses priced at USD 4750, USD 4950, and USD 6800 respectively.
10. Is the market size provided in terms of value or volume?
The market size is provided in terms of value, measured in Million.
11. Are there any specific market keywords associated with the report?
Yes, the market keyword associated with the report is "MEA Payments Industry," which aids in identifying and referencing the specific market segment covered.
12. How do I determine which pricing option suits my needs best?
The pricing options vary based on user requirements and access needs. Individual users may opt for single-user licenses, while businesses requiring broader access may choose multi-user or enterprise licenses for cost-effective access to the report.
13. Are there any additional resources or data provided in the MEA Payments Industry report?
While the report offers comprehensive insights, it's advisable to review the specific contents or supplementary materials provided to ascertain if additional resources or data are available.
14. How can I stay updated on further developments or reports in the MEA Payments Industry?
To stay informed about further developments, trends, and reports in the MEA Payments Industry, consider subscribing to industry newsletters, following relevant companies and organizations, or regularly checking reputable industry news sources and publications.
Methodology
Step 1 - Identification of Relevant Samples Size from Population Database


Step 2 - Approaches for Defining Global Market Size (Value, Volume* & Price*)

Note*: In applicable scenarios
Step 3 - Data Sources
Primary Research
- Web Analytics
- Survey Reports
- Research Institute
- Latest Research Reports
- Opinion Leaders
Secondary Research
- Annual Reports
- White Paper
- Latest Press Release
- Industry Association
- Paid Database
- Investor Presentations

Step 4 - Data Triangulation
Involves using different sources of information in order to increase the validity of a study
These sources are likely to be stakeholders in a program - participants, other researchers, program staff, other community members, and so on.
Then we put all data in single framework & apply various statistical tools to find out the dynamic on the market.
During the analysis stage, feedback from the stakeholder groups would be compared to determine areas of agreement as well as areas of divergence
