

Key Insights
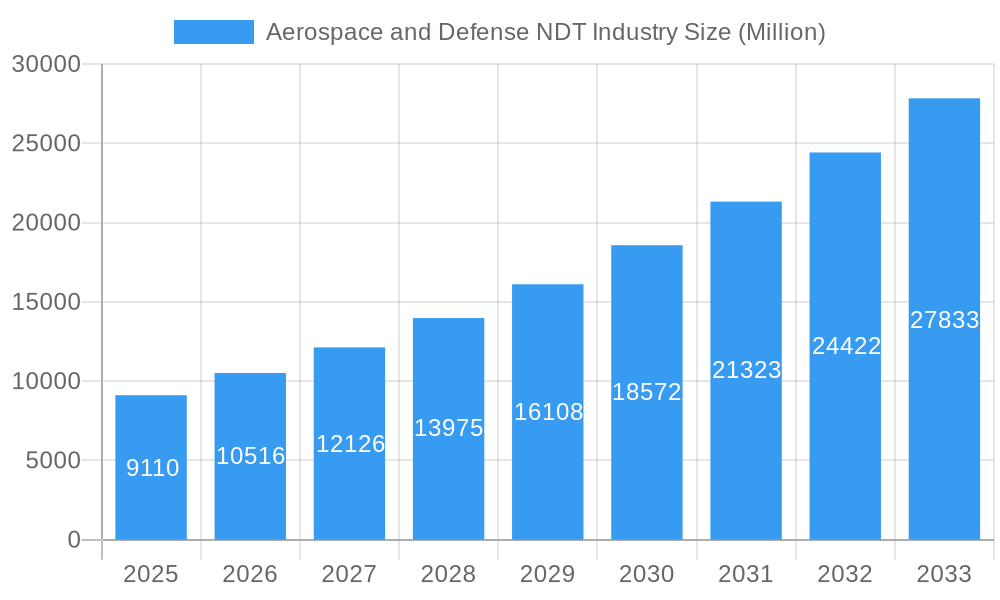
The Aerospace and Defense Non-Destructive Testing (NDT) market is experiencing robust growth, projected to reach a market size of $9.11 billion in 2025, expanding at a Compound Annual Growth Rate (CAGR) of 15.74% from 2025 to 2033. This expansion is driven by several key factors. Stringent safety regulations within the aerospace and defense sectors necessitate rigorous quality control measures, making NDT indispensable for ensuring the structural integrity of aircraft, spacecraft, and military equipment. The increasing complexity of aerospace components and the demand for lightweight yet high-strength materials further fuel the adoption of advanced NDT techniques. Technological advancements, such as the development of automated and portable NDT systems, improved imaging capabilities, and the integration of artificial intelligence for data analysis, are streamlining inspection processes and enhancing accuracy. The growing focus on predictive maintenance, aiming to prevent failures before they occur, also contributes to the market's upward trajectory. Furthermore, the rise in global defense spending and an increasing number of aircraft deliveries are bolstering the demand for NDT services and equipment.
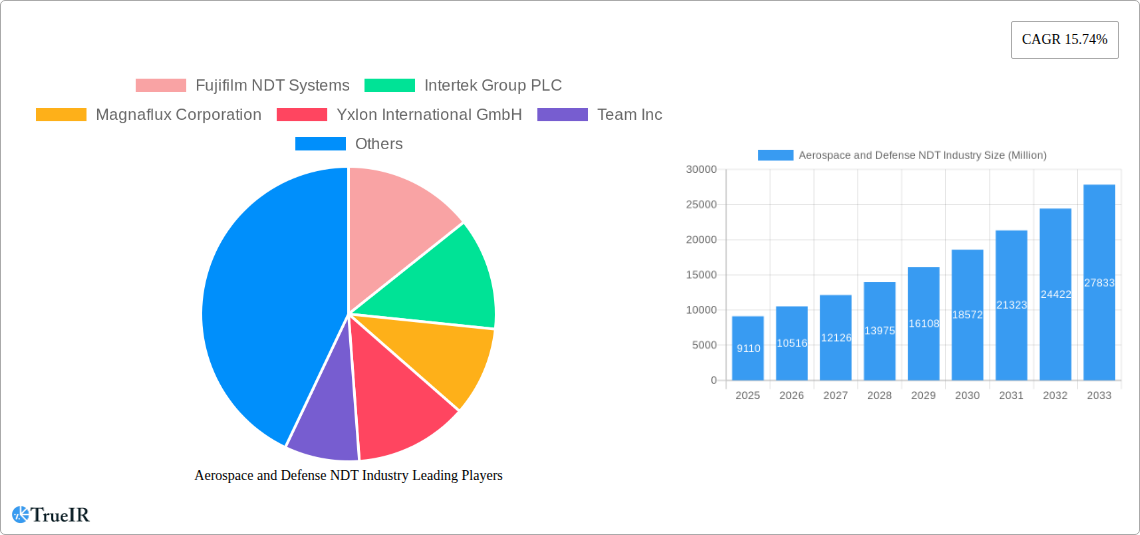
Aerospace and Defense NDT Industry Market Size (In Billion)
Despite the considerable growth, the market faces certain restraints. High initial investment costs associated with advanced NDT equipment can be a barrier for smaller companies. Skilled labor shortages in the field of NDT pose a challenge, impacting the availability of trained personnel to operate and interpret the results from sophisticated equipment. Additionally, the adoption of newer technologies may be somewhat slower due to the established use of traditional methods and the associated training and adaptation costs. However, the long-term benefits of improved safety, reduced maintenance costs, and enhanced operational efficiency are likely to outweigh these challenges, ensuring continued market expansion throughout the forecast period. The market is segmented by type (service and equipment) and technology (radiography, ultrasonic, magnetic particle, electromagnetic, liquid penetrant, visual inspection, and eddy current testing), providing diverse opportunities across different niches. North America is expected to maintain a significant market share due to the concentration of major aerospace and defense manufacturers and robust regulatory frameworks. However, Asia-Pacific is anticipated to demonstrate the highest growth rate due to rapid industrialization and increasing defense spending in the region.
Aerospace and Defense NDT Industry Company Market Share
Aerospace and Defense NDT Industry Market Report: 2019-2033
This comprehensive report provides an in-depth analysis of the Aerospace and Defense Non-Destructive Testing (NDT) industry, offering invaluable insights for stakeholders seeking to navigate this dynamic market. The study period covers 2019-2033, with a base year of 2025 and a forecast period of 2025-2033. The report leverages extensive market research to deliver a detailed understanding of market size, segmentation, competitive landscape, and future growth potential, valued at over $XX Million.
Aerospace and Defense NDT Industry Market Structure & Competitive Landscape
The Aerospace and Defense NDT market exhibits a moderately concentrated structure, with a few major players commanding significant market share. The Herfindahl-Hirschman Index (HHI) is estimated at xx, indicating a moderately consolidated market. Key players such as Fujifilm NDT Systems, Intertek Group PLC, Magnaflux Corporation, and Olympus Corporation drive innovation through continuous product development and technological advancements. However, the presence of numerous smaller, specialized companies fosters competition and innovation.
The market is influenced by stringent regulatory frameworks, such as those from the FAA and EASA, demanding high-quality inspection procedures. This regulatory environment encourages the adoption of advanced NDT technologies. Product substitutes, although limited, include visual inspection methods, but these offer lower precision and are generally insufficient for complex aerospace and defense applications.
Market segmentation is primarily driven by the types of services and equipment offered, including radiography, ultrasonic, magnetic particle, liquid penetrant, visual, and eddy current testing. End-user segmentation includes aircraft manufacturers, defense contractors, and maintenance, repair, and overhaul (MRO) facilities. The last five years have witnessed xx million dollars in M&A activity within the industry, consolidating market share and accelerating innovation.
- Market Concentration: Moderately consolidated, HHI estimated at xx.
- Innovation Drivers: Stringent regulatory requirements, technological advancements, and increased demand for improved inspection techniques.
- Regulatory Impacts: Strict adherence to standards from organizations like FAA and EASA is mandatory.
- Product Substitutes: Limited; visual inspection provides lower precision.
- End-User Segmentation: Aircraft manufacturers, defense contractors, MRO facilities.
- M&A Trends: Significant consolidation in recent years, with approximately xx million dollars in deals over the last five years.
Aerospace and Defense NDT Industry Market Trends & Opportunities
The Aerospace and Defense NDT market is projected to experience a robust Compound Annual Growth Rate (CAGR) of xx% during the forecast period (2025-2033), reaching a value of over $XX million by 2033. This growth is driven by several key factors. Increasing aircraft production and a growing global defense budget contribute significantly to market expansion. Furthermore, the rising demand for improved aircraft safety and maintenance efficiency fuels the adoption of sophisticated NDT technologies. Technological advancements, such as advanced imaging techniques, automated systems, and AI-powered data analysis, are transforming the industry, increasing efficiency and accuracy. These advancements are driving market penetration rates, which are estimated to reach xx% by 2033. Competitive dynamics include an intensifying focus on providing integrated solutions and improved customer service, which will shape the market landscape in the coming years.
Dominant Markets & Segments in Aerospace and Defense NDT Industry
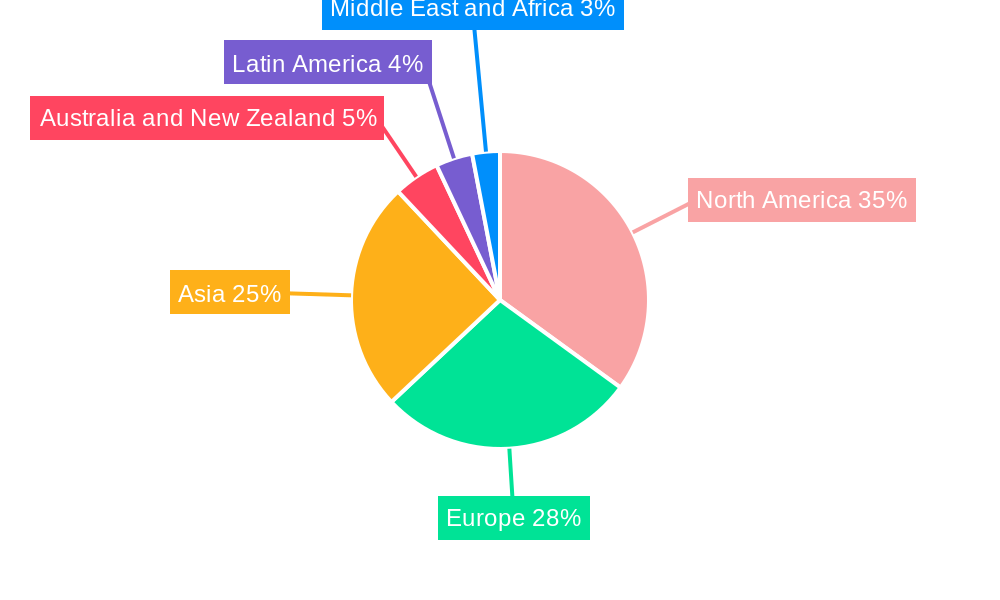
The North American region currently holds the largest market share in the Aerospace and Defense NDT industry, propelled by a highly developed aerospace manufacturing ecosystem and substantial defense investments. Within North America, the United States remains the dominant contributor to this market share. Concurrently, the Asia Pacific region is exhibiting robust growth potential. This surge is attributed to rapid economic expansion, significant investments in aerospace infrastructure, and the burgeoning aerospace sector in key economies such as China and India.
- By Type: While the equipment segment presently commands a larger market share, the service segment is projected to experience a more accelerated growth trajectory. This is largely due to the increasing trend of outsourcing Non-Destructive Testing (NDT) services by aerospace and defense organizations to specialized providers.
- By Technology: Ultrasonic testing (UT) and Radiography testing (RT) continue to lead the market, owing to their proven versatility, reliability, and widespread applicability across diverse aerospace and defense components and systems. However, technologies such as Eddy Current Testing (ECT) are rapidly gaining prominence, driven by their superior efficiency, speed, and capability to precisely detect minute surface and near-surface defects without direct contact. Advanced techniques like Phased Array Ultrasonic Testing (PAUT) and Digital Radiography (DR) are also contributing to market evolution.
Key Growth Drivers:
- An escalating demand for high-fidelity, comprehensive inspections to rigorously ensure aircraft safety, airworthiness, and long-term maintainability.
- Sustained and increasing global defense expenditures, particularly within leading aerospace and defense nations, fueling the need for advanced inspection technologies.
- Continuous technological advancements in NDT equipment, software, and automation, leading to enhanced inspection efficiency, improved defect detection accuracy, and reduced testing times.
- The growing trend of lightweighting in aircraft design, which necessitates more sophisticated NDT methods to assess the integrity of advanced composite materials.
Aerospace and Defense NDT Industry Product Analysis
Recent advancements in NDT technologies have focused on improving the accuracy, speed, and efficiency of inspection processes. This has led to the development of portable, automated systems, and advanced data analysis tools that significantly reduce inspection time and costs. For example, the introduction of phased array ultrasonic testing (PAUT) and advanced radiographic imaging techniques enables more comprehensive and detailed inspections, resulting in enhanced defect detection capabilities. These new products effectively address the industry's growing demand for faster and more reliable NDT solutions.
Key Drivers, Barriers & Challenges in Aerospace and Defense NDT Industry
Key Drivers: Stringent safety regulations mandating rigorous inspections and certifications are a primary market propellant. Technological innovation, including the integration of Artificial Intelligence (AI) and machine learning into NDT systems for automated defect recognition and data analysis, is revolutionizing the field. The increasing volume of aircraft production and the ongoing need for comprehensive maintenance, repair, and overhaul (MRO) activities also significantly drive demand. Furthermore, growing government investment in defense modernization programs globally is a crucial factor bolstering market expansion.
Challenges: The significant upfront cost associated with acquiring state-of-the-art NDT equipment and sophisticated software can be a considerable barrier for some organizations. The persistent need for highly skilled and certified NDT personnel, capable of operating advanced equipment and interpreting complex data, remains a critical challenge. Navigating the intricate landscape of diverse and evolving regulatory compliance requirements across different regions and defense sectors adds another layer of complexity. Supply chain disruptions, exacerbated by global geopolitical events and material shortages (such as the ongoing semiconductor challenges), can further constrain the availability of critical components and impact production timelines, potentially leading to an estimated loss of several million dollars in revenue over the next five years for the industry.
Growth Drivers in the Aerospace and Defense NDT Industry Market
The Aerospace and Defense NDT industry is experiencing significant growth, primarily fueled by a confluence of factors. Paramount among these are the increasingly stringent safety regulations that mandate thorough and reliable inspections throughout the lifecycle of aerospace and defense assets. This regulatory push, coupled with the industry's inherent demand for enhanced efficiency and unwavering reliability in NDT methodologies, acts as a crucial catalyst. Technological innovation continues to be a major contributor, with the adoption of cutting-edge technologies such as artificial intelligence for automated analysis, advanced imaging techniques for greater precision, and robotics for remote inspections, all contributing to improved inspection accuracy and accelerated testing cycles. Moreover, the escalating global defense budgets and the continuous expansion of the commercial aerospace sector, including the development of new aircraft platforms and the MRO of existing fleets, collectively fuel further market expansion.
Challenges Impacting Aerospace and Defense NDT Industry Growth
Regulatory hurdles and the stringent certification processes associated with NDT equipment and personnel pose considerable challenges. The relatively high cost of advanced NDT systems can hinder adoption, particularly for smaller companies. Supply chain vulnerabilities and skilled labor shortages further impact market expansion.
Key Players Shaping the Aerospace and Defense NDT Industry Market
Significant Aerospace and Defense NDT Industry Milestones
- March 2024: Eddyfi Technologies launches TubePro 6, advanced pre-inspection and reporting software, enhancing efficiency in heat exchanger inspections.
- February 2024: Rad Source NDT introduces the NDT 1000 X-ray Inspection System, improving speed and precision in material inspection.
Future Outlook for Aerospace and Defense NDT Industry Market
The Aerospace and Defense NDT market is on a trajectory of sustained and robust growth. This expansion is underpinned by ongoing technological advancements, heightened regulatory scrutiny focused on safety and performance, and a persistent increase in global defense spending. Significant strategic opportunities are emerging in the development and widespread deployment of AI-powered inspection systems capable of predictive maintenance and enhanced defect characterization. Furthermore, expanding NDT service offerings into rapidly developing emerging markets and providing comprehensive, integrated NDT solutions that encompass the entire asset lifecycle present considerable avenues for growth. The market's inherent potential for continuous innovation and strategic expansion remains exceptionally strong, promising a dynamic future for NDT technologies and services in the aerospace and defense sectors.
Aerospace and Defense NDT Industry Segmentation
-
1. Type
- 1.1. Service
- 1.2. Equipment
-
2. Technology
- 2.1. Radiography Testing
- 2.2. Ultrasonic Testing
- 2.3. Magnetic
- 2.4. Liquid Penetrant Testing
- 2.5. Visual Inspection
- 2.6. Eddy Current
Aerospace and Defense NDT Industry Segmentation By Geography
- 1. North America
- 2. Europe
- 3. Asia
- 4. Australia and New Zealand
- 5. Latin America
- 6. Middle East and Africa
Aerospace and Defense NDT Industry Regional Market Share
Geographic Coverage of Aerospace and Defense NDT Industry
Aerospace and Defense NDT Industry REPORT HIGHLIGHTS
| Aspects | Details |
|---|---|
| Study Period | 2020-2034 |
| Base Year | 2025 |
| Estimated Year | 2026 |
| Forecast Period | 2026-2034 |
| Historical Period | 2020-2025 |
| Growth Rate | CAGR of 15.74% from 2020-2034 |
| Segmentation |
|
Table of Contents
- 1. Introduction
- 1.1. Research Scope
- 1.2. Market Segmentation
- 1.3. Research Objective
- 1.4. Definitions and Assumptions
- 2. Executive Summary
- 2.1. Market Snapshot
- 3. Market Dynamics
- 3.1. Market Drivers
- 3.2. Market Restrains
- 3.3. Market Trends
- 3.4. Market Opportunities
- 4. Market Factor Analysis
- 4.1. Porters Five Forces
- 4.1.1. Bargaining Power of Suppliers
- 4.1.2. Bargaining Power of Buyers
- 4.1.3. Threat of New Entrants
- 4.1.4. Threat of Substitutes
- 4.1.5. Competitive Rivalry
- 4.2. PESTEL analysis
- 4.3. BCG Analysis
- 4.3.1. Stars (High Growth, High Market Share)
- 4.3.2. Cash Cows (Low Growth, High Market Share)
- 4.3.3. Question Mark (High Growth, Low Market Share)
- 4.3.4. Dogs (Low Growth, Low Market Share)
- 4.4. Ansoff Matrix Analysis
- 4.5. Supply Chain Analysis
- 4.6. Regulatory Landscape
- 4.7. Current Market Potential and Opportunity Assessment (TAM–SAM–SOM Framework)
- 4.8. TIR Analyst Note
- 4.1. Porters Five Forces
- 5. Market Analysis, Insights and Forecast 2021-2033
- 5.1. Market Analysis, Insights and Forecast - by Type
- 5.1.1. Service
- 5.1.2. Equipment
- 5.2. Market Analysis, Insights and Forecast - by Technology
- 5.2.1. Radiography Testing
- 5.2.2. Ultrasonic Testing
- 5.2.3. Magnetic
- 5.2.4. Liquid Penetrant Testing
- 5.2.5. Visual Inspection
- 5.2.6. Eddy Current
- 5.3. Market Analysis, Insights and Forecast - by Region
- 5.3.1. North America
- 5.3.2. Europe
- 5.3.3. Asia
- 5.3.4. Australia and New Zealand
- 5.3.5. Latin America
- 5.3.6. Middle East and Africa
- 5.1. Market Analysis, Insights and Forecast - by Type
- 6. Global Aerospace and Defense NDT Industry Analysis, Insights and Forecast, 2021-2033
- 6.1. Market Analysis, Insights and Forecast - by Type
- 6.1.1. Service
- 6.1.2. Equipment
- 6.2. Market Analysis, Insights and Forecast - by Technology
- 6.2.1. Radiography Testing
- 6.2.2. Ultrasonic Testing
- 6.2.3. Magnetic
- 6.2.4. Liquid Penetrant Testing
- 6.2.5. Visual Inspection
- 6.2.6. Eddy Current
- 6.1. Market Analysis, Insights and Forecast - by Type
- 7. North America Aerospace and Defense NDT Industry Analysis, Insights and Forecast, 2020-2032
- 7.1. Market Analysis, Insights and Forecast - by Type
- 7.1.1. Service
- 7.1.2. Equipment
- 7.2. Market Analysis, Insights and Forecast - by Technology
- 7.2.1. Radiography Testing
- 7.2.2. Ultrasonic Testing
- 7.2.3. Magnetic
- 7.2.4. Liquid Penetrant Testing
- 7.2.5. Visual Inspection
- 7.2.6. Eddy Current
- 7.1. Market Analysis, Insights and Forecast - by Type
- 8. Europe Aerospace and Defense NDT Industry Analysis, Insights and Forecast, 2020-2032
- 8.1. Market Analysis, Insights and Forecast - by Type
- 8.1.1. Service
- 8.1.2. Equipment
- 8.2. Market Analysis, Insights and Forecast - by Technology
- 8.2.1. Radiography Testing
- 8.2.2. Ultrasonic Testing
- 8.2.3. Magnetic
- 8.2.4. Liquid Penetrant Testing
- 8.2.5. Visual Inspection
- 8.2.6. Eddy Current
- 8.1. Market Analysis, Insights and Forecast - by Type
- 9. Asia Aerospace and Defense NDT Industry Analysis, Insights and Forecast, 2020-2032
- 9.1. Market Analysis, Insights and Forecast - by Type
- 9.1.1. Service
- 9.1.2. Equipment
- 9.2. Market Analysis, Insights and Forecast - by Technology
- 9.2.1. Radiography Testing
- 9.2.2. Ultrasonic Testing
- 9.2.3. Magnetic
- 9.2.4. Liquid Penetrant Testing
- 9.2.5. Visual Inspection
- 9.2.6. Eddy Current
- 9.1. Market Analysis, Insights and Forecast - by Type
- 10. Australia and New Zealand Aerospace and Defense NDT Industry Analysis, Insights and Forecast, 2020-2032
- 10.1. Market Analysis, Insights and Forecast - by Type
- 10.1.1. Service
- 10.1.2. Equipment
- 10.2. Market Analysis, Insights and Forecast - by Technology
- 10.2.1. Radiography Testing
- 10.2.2. Ultrasonic Testing
- 10.2.3. Magnetic
- 10.2.4. Liquid Penetrant Testing
- 10.2.5. Visual Inspection
- 10.2.6. Eddy Current
- 10.1. Market Analysis, Insights and Forecast - by Type
- 11. Latin America Aerospace and Defense NDT Industry Analysis, Insights and Forecast, 2020-2032
- 11.1. Market Analysis, Insights and Forecast - by Type
- 11.1.1. Service
- 11.1.2. Equipment
- 11.2. Market Analysis, Insights and Forecast - by Technology
- 11.2.1. Radiography Testing
- 11.2.2. Ultrasonic Testing
- 11.2.3. Magnetic
- 11.2.4. Liquid Penetrant Testing
- 11.2.5. Visual Inspection
- 11.2.6. Eddy Current
- 11.1. Market Analysis, Insights and Forecast - by Type
- 12. Middle East and Africa Aerospace and Defense NDT Industry Analysis, Insights and Forecast, 2020-2032
- 12.1. Market Analysis, Insights and Forecast - by Type
- 12.1.1. Service
- 12.1.2. Equipment
- 12.2. Market Analysis, Insights and Forecast - by Technology
- 12.2.1. Radiography Testing
- 12.2.2. Ultrasonic Testing
- 12.2.3. Magnetic
- 12.2.4. Liquid Penetrant Testing
- 12.2.5. Visual Inspection
- 12.2.6. Eddy Current
- 12.1. Market Analysis, Insights and Forecast - by Type
- 13. Competitive Analysis
- 13.1. Company Profiles
- 13.1.1 Fujifilm NDT Systems
- 13.1.1.1. Company Overview
- 13.1.1.2. Products
- 13.1.1.3. Company Financials
- 13.1.1.4. SWOT Analysis
- 13.1.2 Intertek Group PLC
- 13.1.2.1. Company Overview
- 13.1.2.2. Products
- 13.1.2.3. Company Financials
- 13.1.2.4. SWOT Analysis
- 13.1.3 Magnaflux Corporation
- 13.1.3.1. Company Overview
- 13.1.3.2. Products
- 13.1.3.3. Company Financials
- 13.1.3.4. SWOT Analysis
- 13.1.4 Yxlon International GmbH
- 13.1.4.1. Company Overview
- 13.1.4.2. Products
- 13.1.4.3. Company Financials
- 13.1.4.4. SWOT Analysis
- 13.1.5 Team Inc
- 13.1.5.1. Company Overview
- 13.1.5.2. Products
- 13.1.5.3. Company Financials
- 13.1.5.4. SWOT Analysis
- 13.1.6 SGS Group
- 13.1.6.1. Company Overview
- 13.1.6.2. Products
- 13.1.6.3. Company Financials
- 13.1.6.4. SWOT Analysis
- 13.1.7 TUV Rheinland Ag
- 13.1.7.1. Company Overview
- 13.1.7.2. Products
- 13.1.7.3. Company Financials
- 13.1.7.4. SWOT Analysis
- 13.1.8 NikonMetrology Inc
- 13.1.8.1. Company Overview
- 13.1.8.2. Products
- 13.1.8.3. Company Financials
- 13.1.8.4. SWOT Analysis
- 13.1.9 Mistras Group
- 13.1.9.1. Company Overview
- 13.1.9.2. Products
- 13.1.9.3. Company Financials
- 13.1.9.4. SWOT Analysis
- 13.1.10 Olympus Corporation
- 13.1.10.1. Company Overview
- 13.1.10.2. Products
- 13.1.10.3. Company Financials
- 13.1.10.4. SWOT Analysis
- 13.1.11 GE Measurement and Control
- 13.1.11.1. Company Overview
- 13.1.11.2. Products
- 13.1.11.3. Company Financials
- 13.1.11.4. SWOT Analysis
- 13.1.12 Applus Services S A
- 13.1.12.1. Company Overview
- 13.1.12.2. Products
- 13.1.12.3. Company Financials
- 13.1.12.4. SWOT Analysis
- 13.1.13 FLIR Systems Inc *List Not Exhaustive
- 13.1.13.1. Company Overview
- 13.1.13.2. Products
- 13.1.13.3. Company Financials
- 13.1.13.4. SWOT Analysis
- 13.1.14 Gould-Bass Co
- 13.1.14.1. Company Overview
- 13.1.14.2. Products
- 13.1.14.3. Company Financials
- 13.1.14.4. SWOT Analysis
- 13.1.1 Fujifilm NDT Systems
- 13.2. Market Entropy
- 13.2.1 Company's Key Areas Served
- 13.2.2 Recent Developments
- 13.3. Company Market Share Analysis 2025
- 13.3.1 Top 5 Companies Market Share Analysis
- 13.3.2 Top 3 Companies Market Share Analysis
- 13.4. List of Potential Customers
- 14. Research Methodology
List of Figures
- Figure 1: Global Aerospace and Defense NDT Industry Revenue Breakdown (Million, %) by Region 2025 & 2033
- Figure 2: North America Aerospace and Defense NDT Industry Revenue (Million), by Type 2025 & 2033
- Figure 3: North America Aerospace and Defense NDT Industry Revenue Share (%), by Type 2025 & 2033
- Figure 4: North America Aerospace and Defense NDT Industry Revenue (Million), by Technology 2025 & 2033
- Figure 5: North America Aerospace and Defense NDT Industry Revenue Share (%), by Technology 2025 & 2033
- Figure 6: North America Aerospace and Defense NDT Industry Revenue (Million), by Country 2025 & 2033
- Figure 7: North America Aerospace and Defense NDT Industry Revenue Share (%), by Country 2025 & 2033
- Figure 8: Europe Aerospace and Defense NDT Industry Revenue (Million), by Type 2025 & 2033
- Figure 9: Europe Aerospace and Defense NDT Industry Revenue Share (%), by Type 2025 & 2033
- Figure 10: Europe Aerospace and Defense NDT Industry Revenue (Million), by Technology 2025 & 2033
- Figure 11: Europe Aerospace and Defense NDT Industry Revenue Share (%), by Technology 2025 & 2033
- Figure 12: Europe Aerospace and Defense NDT Industry Revenue (Million), by Country 2025 & 2033
- Figure 13: Europe Aerospace and Defense NDT Industry Revenue Share (%), by Country 2025 & 2033
- Figure 14: Asia Aerospace and Defense NDT Industry Revenue (Million), by Type 2025 & 2033
- Figure 15: Asia Aerospace and Defense NDT Industry Revenue Share (%), by Type 2025 & 2033
- Figure 16: Asia Aerospace and Defense NDT Industry Revenue (Million), by Technology 2025 & 2033
- Figure 17: Asia Aerospace and Defense NDT Industry Revenue Share (%), by Technology 2025 & 2033
- Figure 18: Asia Aerospace and Defense NDT Industry Revenue (Million), by Country 2025 & 2033
- Figure 19: Asia Aerospace and Defense NDT Industry Revenue Share (%), by Country 2025 & 2033
- Figure 20: Australia and New Zealand Aerospace and Defense NDT Industry Revenue (Million), by Type 2025 & 2033
- Figure 21: Australia and New Zealand Aerospace and Defense NDT Industry Revenue Share (%), by Type 2025 & 2033
- Figure 22: Australia and New Zealand Aerospace and Defense NDT Industry Revenue (Million), by Technology 2025 & 2033
- Figure 23: Australia and New Zealand Aerospace and Defense NDT Industry Revenue Share (%), by Technology 2025 & 2033
- Figure 24: Australia and New Zealand Aerospace and Defense NDT Industry Revenue (Million), by Country 2025 & 2033
- Figure 25: Australia and New Zealand Aerospace and Defense NDT Industry Revenue Share (%), by Country 2025 & 2033
- Figure 26: Latin America Aerospace and Defense NDT Industry Revenue (Million), by Type 2025 & 2033
- Figure 27: Latin America Aerospace and Defense NDT Industry Revenue Share (%), by Type 2025 & 2033
- Figure 28: Latin America Aerospace and Defense NDT Industry Revenue (Million), by Technology 2025 & 2033
- Figure 29: Latin America Aerospace and Defense NDT Industry Revenue Share (%), by Technology 2025 & 2033
- Figure 30: Latin America Aerospace and Defense NDT Industry Revenue (Million), by Country 2025 & 2033
- Figure 31: Latin America Aerospace and Defense NDT Industry Revenue Share (%), by Country 2025 & 2033
- Figure 32: Middle East and Africa Aerospace and Defense NDT Industry Revenue (Million), by Type 2025 & 2033
- Figure 33: Middle East and Africa Aerospace and Defense NDT Industry Revenue Share (%), by Type 2025 & 2033
- Figure 34: Middle East and Africa Aerospace and Defense NDT Industry Revenue (Million), by Technology 2025 & 2033
- Figure 35: Middle East and Africa Aerospace and Defense NDT Industry Revenue Share (%), by Technology 2025 & 2033
- Figure 36: Middle East and Africa Aerospace and Defense NDT Industry Revenue (Million), by Country 2025 & 2033
- Figure 37: Middle East and Africa Aerospace and Defense NDT Industry Revenue Share (%), by Country 2025 & 2033
List of Tables
- Table 1: Global Aerospace and Defense NDT Industry Revenue Million Forecast, by Type 2020 & 2033
- Table 2: Global Aerospace and Defense NDT Industry Revenue Million Forecast, by Technology 2020 & 2033
- Table 3: Global Aerospace and Defense NDT Industry Revenue Million Forecast, by Region 2020 & 2033
- Table 4: Global Aerospace and Defense NDT Industry Revenue Million Forecast, by Type 2020 & 2033
- Table 5: Global Aerospace and Defense NDT Industry Revenue Million Forecast, by Technology 2020 & 2033
- Table 6: Global Aerospace and Defense NDT Industry Revenue Million Forecast, by Country 2020 & 2033
- Table 7: Global Aerospace and Defense NDT Industry Revenue Million Forecast, by Type 2020 & 2033
- Table 8: Global Aerospace and Defense NDT Industry Revenue Million Forecast, by Technology 2020 & 2033
- Table 9: Global Aerospace and Defense NDT Industry Revenue Million Forecast, by Country 2020 & 2033
- Table 10: Global Aerospace and Defense NDT Industry Revenue Million Forecast, by Type 2020 & 2033
- Table 11: Global Aerospace and Defense NDT Industry Revenue Million Forecast, by Technology 2020 & 2033
- Table 12: Global Aerospace and Defense NDT Industry Revenue Million Forecast, by Country 2020 & 2033
- Table 13: Global Aerospace and Defense NDT Industry Revenue Million Forecast, by Type 2020 & 2033
- Table 14: Global Aerospace and Defense NDT Industry Revenue Million Forecast, by Technology 2020 & 2033
- Table 15: Global Aerospace and Defense NDT Industry Revenue Million Forecast, by Country 2020 & 2033
- Table 16: Global Aerospace and Defense NDT Industry Revenue Million Forecast, by Type 2020 & 2033
- Table 17: Global Aerospace and Defense NDT Industry Revenue Million Forecast, by Technology 2020 & 2033
- Table 18: Global Aerospace and Defense NDT Industry Revenue Million Forecast, by Country 2020 & 2033
- Table 19: Global Aerospace and Defense NDT Industry Revenue Million Forecast, by Type 2020 & 2033
- Table 20: Global Aerospace and Defense NDT Industry Revenue Million Forecast, by Technology 2020 & 2033
- Table 21: Global Aerospace and Defense NDT Industry Revenue Million Forecast, by Country 2020 & 2033
Frequently Asked Questions
1. What is the projected Compound Annual Growth Rate (CAGR) of the Aerospace and Defense NDT Industry?
The projected CAGR is approximately 15.74%.
2. Which companies are prominent players in the Aerospace and Defense NDT Industry?
Key companies in the market include Fujifilm NDT Systems, Intertek Group PLC, Magnaflux Corporation, Yxlon International GmbH, Team Inc, SGS Group, TUV Rheinland Ag, NikonMetrology Inc, Mistras Group, Olympus Corporation, GE Measurement and Control, Applus Services S A, FLIR Systems Inc *List Not Exhaustive, Gould-Bass Co.
3. What are the main segments of the Aerospace and Defense NDT Industry?
The market segments include Type, Technology.
4. Can you provide details about the market size?
The market size is estimated to be USD 9.11 Million as of 2022.
5. What are some drivers contributing to market growth?
Increasing Investments in Aerospace & Defense; Increasing Complexity of Machine and Infrastructure.
6. What are the notable trends driving market growth?
Radiography Testing Technology to Account for the Largest Share.
7. Are there any restraints impacting market growth?
Lack Of Technical Workforce; Relative Lack of Awareness.
8. Can you provide examples of recent developments in the market?
March 2024 – Eddyfi Technologies, a player in the global non-destructive testing (NDT) solutions market, unveils TubePro 6, its advanced pre-inspection and reporting software. TubePro 6 is equipping organizations with advanced tools. These features promise unmatched insights and operational efficiency, particularly in heat exchanger inspections.
9. What pricing options are available for accessing the report?
Pricing options include single-user, multi-user, and enterprise licenses priced at USD 4750, USD 5250, and USD 8750 respectively.
10. Is the market size provided in terms of value or volume?
The market size is provided in terms of value, measured in Million.
11. Are there any specific market keywords associated with the report?
Yes, the market keyword associated with the report is "Aerospace and Defense NDT Industry," which aids in identifying and referencing the specific market segment covered.
12. How do I determine which pricing option suits my needs best?
The pricing options vary based on user requirements and access needs. Individual users may opt for single-user licenses, while businesses requiring broader access may choose multi-user or enterprise licenses for cost-effective access to the report.
13. Are there any additional resources or data provided in the Aerospace and Defense NDT Industry report?
While the report offers comprehensive insights, it's advisable to review the specific contents or supplementary materials provided to ascertain if additional resources or data are available.
14. How can I stay updated on further developments or reports in the Aerospace and Defense NDT Industry?
To stay informed about further developments, trends, and reports in the Aerospace and Defense NDT Industry, consider subscribing to industry newsletters, following relevant companies and organizations, or regularly checking reputable industry news sources and publications.
Methodology
Step 1 - Identification of Relevant Samples Size from Population Database


Step 2 - Approaches for Defining Global Market Size (Value, Volume* & Price*)

Note*: In applicable scenarios
Step 3 - Data Sources
Primary Research
- Web Analytics
- Survey Reports
- Research Institute
- Latest Research Reports
- Opinion Leaders
Secondary Research
- Annual Reports
- White Paper
- Latest Press Release
- Industry Association
- Paid Database
- Investor Presentations

Step 4 - Data Triangulation
Involves using different sources of information in order to increase the validity of a study
These sources are likely to be stakeholders in a program - participants, other researchers, program staff, other community members, and so on.
Then we put all data in single framework & apply various statistical tools to find out the dynamic on the market.
During the analysis stage, feedback from the stakeholder groups would be compared to determine areas of agreement as well as areas of divergence