

Key Insights
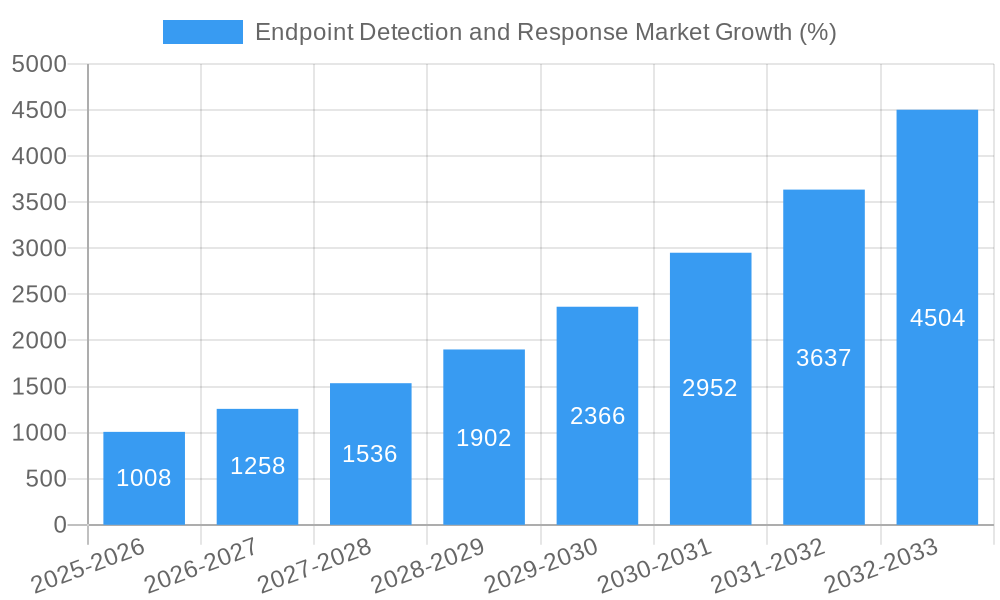
The Endpoint Detection and Response (EDR) market is experiencing robust growth, projected to reach $4.09 billion in 2025 and exhibiting a Compound Annual Growth Rate (CAGR) of 24.80% from 2025 to 2033. This expansion is driven by the escalating sophistication of cyber threats, increasing adoption of cloud-based solutions, and the growing need for enhanced security across various industries. The rise in remote work and the expanding attack surface have further fueled the demand for effective endpoint security solutions. Key market segments include cloud-based deployments, which are witnessing faster adoption rates than on-premise solutions due to scalability and cost-effectiveness. Among solution types, workstations and servers are significant contributors to market revenue, reflecting the critical nature of protecting these assets. Large enterprises currently dominate the market share due to their higher cybersecurity budgets and more complex IT infrastructure. However, the Small and Medium Enterprises (SMEs) segment is poised for substantial growth as awareness of cybersecurity risks increases and affordable EDR solutions become more accessible. The BFSI, IT and Telecom, and Healthcare sectors are major end-user industries driving market demand, given their sensitivity to data breaches and regulatory compliance requirements.
The competitive landscape is marked by a mix of established players and emerging innovative companies. Major vendors such as Trellix, Fortinet, Cybereason, Cisco, and CrowdStrike are leveraging their existing security portfolios and technological advancements to maintain a strong market position. The market is also witnessing increasing consolidation and partnerships as vendors strive to provide comprehensive endpoint security solutions and cater to the evolving needs of diverse customers. Future market growth will be significantly influenced by the ongoing development of advanced threat detection techniques, including artificial intelligence (AI) and machine learning (ML), and integration with other security solutions to enhance overall security posture. Geographical expansion, particularly in emerging markets, will also contribute to the continued expansion of the EDR market.

Endpoint Detection and Response (EDR) Market Report: 2019-2033
This comprehensive report provides an in-depth analysis of the Endpoint Detection and Response (EDR) market, offering invaluable insights for stakeholders across the cybersecurity landscape. With a focus on market structure, trends, opportunities, and key players, this report covers the period from 2019 to 2033, with a base year of 2025 and a forecast period spanning 2025-2033. The report leverages extensive data analysis to project a market size of xx Million by 2033, showcasing significant growth potential and lucrative investment opportunities. This detailed analysis incorporates high-impact keywords like "Endpoint Detection and Response," "EDR Market," "Cybersecurity," "Cloud-based EDR," and "Threat Detection," to ensure optimal search engine visibility and attract relevant audiences.
Endpoint Detection and Response Market Market Structure & Competitive Landscape
The Endpoint Detection and Response (EDR) market is characterized by a moderately concentrated competitive landscape. Key players such as Musarubra US LLC (Trellix), Fortinet Inc, Cybereason Inc, Cisco Systems Inc, Broadcom Inc, Sophos Ltd, Open Text Corporation, CrowdStrike Inc, Fortra LLC, Palo Alto Networks Inc, and Deep Instinct Ltd, hold significant market share, driving innovation and shaping market trends. The market concentration ratio (CR4) is estimated at xx%, indicating a level of competition balanced between a few major players and a sizable number of smaller, specialized firms.
Several factors influence market structure:
- Innovation: Continuous advancements in AI, machine learning, and threat intelligence are driving product innovation, creating a dynamic competitive environment.
- Regulatory Impacts: Stricter data privacy regulations (e.g., GDPR, CCPA) and cybersecurity mandates are pushing organizations to adopt robust EDR solutions, fostering market growth.
- Product Substitutes: While EDR solutions are becoming increasingly specialized, traditional antivirus software still partially competes in the lower-end market segment.
- End-User Segmentation: The market is segmented by organization size (SMEs and large enterprises) and industry (BFSI, IT and Telecom, Manufacturing, Healthcare, Retail, and others), creating distinct needs and pricing strategies.
- M&A Activity: The EDR market has witnessed a significant number of mergers and acquisitions (M&A) in recent years, with an estimated xx number of deals completed between 2019 and 2024, resulting in increased market consolidation and integration of technologies. This is expected to continue in the forecast period.
Endpoint Detection and Response Market Market Trends & Opportunities
The EDR market is experiencing robust growth, driven by several factors. The market size is projected to reach xx Million in 2025, growing at a Compound Annual Growth Rate (CAGR) of xx% from 2025 to 2033. This growth is fueled by the increasing sophistication of cyber threats, the rising adoption of cloud-based solutions, and the growing awareness of the need for proactive threat detection and response capabilities amongst organizations of all sizes. The market penetration rate for EDR solutions is steadily increasing, particularly among large enterprises. Technological shifts towards AI-powered threat detection, automation of incident response, and integrated security platforms are reshaping the competitive landscape, favouring vendors with advanced capabilities. Changing consumer preferences towards easy-to-use, highly effective, and integrated solutions are influencing vendors’ product development and marketing strategies. Strong competitive dynamics are leading to ongoing product innovation, pricing adjustments, and strategic alliances.
Dominant Markets & Segments in Endpoint Detection and Response Market
The North American region currently holds the largest market share in the EDR market, driven by high technological adoption, stringent regulatory frameworks, and a substantial concentration of large enterprises. However, Asia-Pacific is projected to show the fastest growth rate over the forecast period.
Key Growth Drivers by Segment:
- By Component: The Solutions segment (EDR software and hardware) dominates the market, while the Services segment (managed security services, professional services) is experiencing rapid growth.
- By Deployment Type: Cloud-based EDR solutions are experiencing significantly faster growth than on-premise deployments due to scalability, cost-effectiveness, and ease of management.
- By Solution Type: Workstations and servers currently dominate the solution type segment. However, mobile devices and Point of Sale Terminals (POS) are expected to show rapid growth, driven by increasing mobile workforce adoption and the surge in digital payment transactions.
- By Organization Size: Large enterprises currently account for the largest market share due to their higher IT budgets and sophisticated security requirements. However, SMEs are increasingly adopting EDR solutions, representing a significant growth opportunity.
- By End-user Industry: The BFSI and IT & Telecom sectors are leading adopters of EDR solutions due to the high value of their data and critical infrastructure. However, growth across all other sectors (Manufacturing, Healthcare, Retail) is anticipated to remain strong due to increasing cyber threats and heightened regulatory scrutiny.
Endpoint Detection and Response Market Product Analysis
EDR product innovations are largely focused on AI-driven threat detection, automated incident response, and seamless integration with existing security ecosystems. Advanced features like behavioral analysis, threat hunting capabilities, and proactive remediation are key competitive advantages. The market is witnessing a shift towards cloud-native solutions and extended detection and response (XDR) platforms that integrate endpoint data with other security data sources for comprehensive threat visibility and response. This integration and enhanced threat detection capabilities are key factors driving market adoption.
Key Drivers, Barriers & Challenges in Endpoint Detection and Response Market
Key Drivers: The increasing sophistication and frequency of cyberattacks, stringent regulatory requirements for data protection, the rising adoption of cloud computing and mobile devices, and the need for proactive threat hunting are key drivers. The growing awareness of the financial and reputational damage caused by data breaches is also contributing to market expansion.
Challenges & Restraints: High initial investment costs can be a barrier for SMEs, while integration complexities with existing IT infrastructures can pose challenges. The shortage of skilled cybersecurity professionals capable of managing and interpreting EDR data is another significant restraint. Furthermore, the constantly evolving threat landscape requires continuous upgrades and adaptation of EDR solutions, imposing ongoing operational expenses. Competition is fierce, requiring providers to constantly innovate and offer competitive pricing models to stay ahead.
Growth Drivers in the Endpoint Detection and Response Market Market
The market's continued growth is primarily driven by the rising frequency and severity of cyberattacks targeting businesses and organizations globally. Technological advancements in AI and machine learning are enhancing the accuracy and effectiveness of EDR solutions. Stringent regulations regarding data privacy and security are further accelerating adoption. The increasing reliance on cloud-based solutions and mobile devices expands the attack surface, highlighting the urgent need for effective endpoint security solutions.
Challenges Impacting Endpoint Detection and Response Market Growth
Challenges include the high cost of implementing and maintaining EDR systems, especially for small and medium-sized enterprises (SMEs). The complexity of integrating EDR solutions with existing security infrastructure can also hinder adoption. Furthermore, a shortage of skilled professionals to manage and interpret EDR data presents a significant obstacle. Finally, the ever-evolving nature of cyber threats necessitates constant updates and improvements to EDR technologies, increasing operational costs.
Key Players Shaping the Endpoint Detection and Response Market Market
- Musarubra US LLC (Trellix)
- Fortinet Inc
- Cybereason Inc
- Cisco Systems Inc
- Broadcom Inc
- Sophos Ltd
- Open Text Corporation
- CrowdStrike Inc
- Fortra LLC
- Palo Alto Networks Inc
- Deep Instinct Ltd
Significant Endpoint Detection and Response Market Industry Milestones
- October 2023: HarfangLab secures EUR 25 Million in Series A funding to expand its EDR solutions across Europe, potentially stimulating market growth.
- August 2023: Fortinet wins Google Cloud Technology Partner of the Year Award for Security for its FortiEDR solution, reinforcing its market position and highlighting the effectiveness of its technology.
Future Outlook for Endpoint Detection and Response Market Market
The EDR market is poised for continued strong growth, driven by increasing cyber threats, technological advancements in AI and machine learning, and the growing awareness of the need for robust endpoint security. Strategic partnerships and acquisitions will play a crucial role in shaping the market landscape. The emergence of XDR platforms integrating data from multiple security sources will further enhance the capabilities and value proposition of EDR solutions, creating significant opportunities for vendors and driving broader market expansion. The market is expected to see strong growth throughout the forecast period, with a projected market size of xx Million by 2033.
Endpoint Detection and Response Market Segmentation
-
1. Component
- 1.1. Solutions
- 1.2. Services
-
2. Deployment Type
- 2.1. Cloud-based
- 2.2. On-premise
-
3. Solution Type
- 3.1. Workstations
- 3.2. Mobile Devices
- 3.3. Servers
- 3.4. Point of Sale Terminals
-
4. Organization Size
- 4.1. Small And Medium Enterprises (SMES)
- 4.2. Large Enterprises
-
5. End-user Industry
- 5.1. BFSI
- 5.2. IT and Telecom
- 5.3. Manufacturing
- 5.4. Healthcare
- 5.5. Retail
- 5.6. Other End-user Industries
Endpoint Detection and Response Market Segmentation By Geography
-
1. North America
- 1.1. United States
- 1.2. Canada
-
2. Europe
- 2.1. Germany
- 2.2. United Kingdom
- 2.3. France
-
3. Asia
- 3.1. China
- 3.2. Japan
- 3.3. India
- 4. Australia and New Zealand
- 5. Middle East and Africa
- 6. Latin America

Endpoint Detection and Response Market REPORT HIGHLIGHTS
| Aspects | Details |
|---|---|
| Study Period | 2019-2033 |
| Base Year | 2024 |
| Estimated Year | 2025 |
| Forecast Period | 2025-2033 |
| Historical Period | 2019-2024 |
| Growth Rate | CAGR of 24.80% from 2019-2033 |
| Segmentation |
|
Table of Contents
- 1. Introduction
- 1.1. Research Scope
- 1.2. Market Segmentation
- 1.3. Research Methodology
- 1.4. Definitions and Assumptions
- 2. Executive Summary
- 2.1. Introduction
- 3. Market Dynamics
- 3.1. Introduction
- 3.2. Market Drivers
- 3.2.1. Increasing Expansion of Enterprise Mobility; Bring your Own Device (BYOD) Adoption and Increased Remote Working
- 3.3. Market Restrains
- 3.3.1. Limited Development in the Field of Low-Voltage Fuses and Unorganized Aftermarket in the Fuse Market
- 3.4. Market Trends
- 3.4.1. Small and Medium Enterprises (SMEs) to Witness Major Growth
- 4. Market Factor Analysis
- 4.1. Porters Five Forces
- 4.2. Supply/Value Chain
- 4.3. PESTEL analysis
- 4.4. Market Entropy
- 4.5. Patent/Trademark Analysis
- 5. Global Endpoint Detection and Response Market Analysis, Insights and Forecast, 2019-2031
- 5.1. Market Analysis, Insights and Forecast - by Component
- 5.1.1. Solutions
- 5.1.2. Services
- 5.2. Market Analysis, Insights and Forecast - by Deployment Type
- 5.2.1. Cloud-based
- 5.2.2. On-premise
- 5.3. Market Analysis, Insights and Forecast - by Solution Type
- 5.3.1. Workstations
- 5.3.2. Mobile Devices
- 5.3.3. Servers
- 5.3.4. Point of Sale Terminals
- 5.4. Market Analysis, Insights and Forecast - by Organization Size
- 5.4.1. Small And Medium Enterprises (SMES)
- 5.4.2. Large Enterprises
- 5.5. Market Analysis, Insights and Forecast - by End-user Industry
- 5.5.1. BFSI
- 5.5.2. IT and Telecom
- 5.5.3. Manufacturing
- 5.5.4. Healthcare
- 5.5.5. Retail
- 5.5.6. Other End-user Industries
- 5.6. Market Analysis, Insights and Forecast - by Region
- 5.6.1. North America
- 5.6.2. Europe
- 5.6.3. Asia
- 5.6.4. Australia and New Zealand
- 5.6.5. Middle East and Africa
- 5.6.6. Latin America
- 5.1. Market Analysis, Insights and Forecast - by Component
- 6. North America Endpoint Detection and Response Market Analysis, Insights and Forecast, 2019-2031
- 6.1. Market Analysis, Insights and Forecast - by Component
- 6.1.1. Solutions
- 6.1.2. Services
- 6.2. Market Analysis, Insights and Forecast - by Deployment Type
- 6.2.1. Cloud-based
- 6.2.2. On-premise
- 6.3. Market Analysis, Insights and Forecast - by Solution Type
- 6.3.1. Workstations
- 6.3.2. Mobile Devices
- 6.3.3. Servers
- 6.3.4. Point of Sale Terminals
- 6.4. Market Analysis, Insights and Forecast - by Organization Size
- 6.4.1. Small And Medium Enterprises (SMES)
- 6.4.2. Large Enterprises
- 6.5. Market Analysis, Insights and Forecast - by End-user Industry
- 6.5.1. BFSI
- 6.5.2. IT and Telecom
- 6.5.3. Manufacturing
- 6.5.4. Healthcare
- 6.5.5. Retail
- 6.5.6. Other End-user Industries
- 6.1. Market Analysis, Insights and Forecast - by Component
- 7. Europe Endpoint Detection and Response Market Analysis, Insights and Forecast, 2019-2031
- 7.1. Market Analysis, Insights and Forecast - by Component
- 7.1.1. Solutions
- 7.1.2. Services
- 7.2. Market Analysis, Insights and Forecast - by Deployment Type
- 7.2.1. Cloud-based
- 7.2.2. On-premise
- 7.3. Market Analysis, Insights and Forecast - by Solution Type
- 7.3.1. Workstations
- 7.3.2. Mobile Devices
- 7.3.3. Servers
- 7.3.4. Point of Sale Terminals
- 7.4. Market Analysis, Insights and Forecast - by Organization Size
- 7.4.1. Small And Medium Enterprises (SMES)
- 7.4.2. Large Enterprises
- 7.5. Market Analysis, Insights and Forecast - by End-user Industry
- 7.5.1. BFSI
- 7.5.2. IT and Telecom
- 7.5.3. Manufacturing
- 7.5.4. Healthcare
- 7.5.5. Retail
- 7.5.6. Other End-user Industries
- 7.1. Market Analysis, Insights and Forecast - by Component
- 8. Asia Endpoint Detection and Response Market Analysis, Insights and Forecast, 2019-2031
- 8.1. Market Analysis, Insights and Forecast - by Component
- 8.1.1. Solutions
- 8.1.2. Services
- 8.2. Market Analysis, Insights and Forecast - by Deployment Type
- 8.2.1. Cloud-based
- 8.2.2. On-premise
- 8.3. Market Analysis, Insights and Forecast - by Solution Type
- 8.3.1. Workstations
- 8.3.2. Mobile Devices
- 8.3.3. Servers
- 8.3.4. Point of Sale Terminals
- 8.4. Market Analysis, Insights and Forecast - by Organization Size
- 8.4.1. Small And Medium Enterprises (SMES)
- 8.4.2. Large Enterprises
- 8.5. Market Analysis, Insights and Forecast - by End-user Industry
- 8.5.1. BFSI
- 8.5.2. IT and Telecom
- 8.5.3. Manufacturing
- 8.5.4. Healthcare
- 8.5.5. Retail
- 8.5.6. Other End-user Industries
- 8.1. Market Analysis, Insights and Forecast - by Component
- 9. Australia and New Zealand Endpoint Detection and Response Market Analysis, Insights and Forecast, 2019-2031
- 9.1. Market Analysis, Insights and Forecast - by Component
- 9.1.1. Solutions
- 9.1.2. Services
- 9.2. Market Analysis, Insights and Forecast - by Deployment Type
- 9.2.1. Cloud-based
- 9.2.2. On-premise
- 9.3. Market Analysis, Insights and Forecast - by Solution Type
- 9.3.1. Workstations
- 9.3.2. Mobile Devices
- 9.3.3. Servers
- 9.3.4. Point of Sale Terminals
- 9.4. Market Analysis, Insights and Forecast - by Organization Size
- 9.4.1. Small And Medium Enterprises (SMES)
- 9.4.2. Large Enterprises
- 9.5. Market Analysis, Insights and Forecast - by End-user Industry
- 9.5.1. BFSI
- 9.5.2. IT and Telecom
- 9.5.3. Manufacturing
- 9.5.4. Healthcare
- 9.5.5. Retail
- 9.5.6. Other End-user Industries
- 9.1. Market Analysis, Insights and Forecast - by Component
- 10. Middle East and Africa Endpoint Detection and Response Market Analysis, Insights and Forecast, 2019-2031
- 10.1. Market Analysis, Insights and Forecast - by Component
- 10.1.1. Solutions
- 10.1.2. Services
- 10.2. Market Analysis, Insights and Forecast - by Deployment Type
- 10.2.1. Cloud-based
- 10.2.2. On-premise
- 10.3. Market Analysis, Insights and Forecast - by Solution Type
- 10.3.1. Workstations
- 10.3.2. Mobile Devices
- 10.3.3. Servers
- 10.3.4. Point of Sale Terminals
- 10.4. Market Analysis, Insights and Forecast - by Organization Size
- 10.4.1. Small And Medium Enterprises (SMES)
- 10.4.2. Large Enterprises
- 10.5. Market Analysis, Insights and Forecast - by End-user Industry
- 10.5.1. BFSI
- 10.5.2. IT and Telecom
- 10.5.3. Manufacturing
- 10.5.4. Healthcare
- 10.5.5. Retail
- 10.5.6. Other End-user Industries
- 10.1. Market Analysis, Insights and Forecast - by Component
- 11. Latin America Endpoint Detection and Response Market Analysis, Insights and Forecast, 2019-2031
- 11.1. Market Analysis, Insights and Forecast - by Component
- 11.1.1. Solutions
- 11.1.2. Services
- 11.2. Market Analysis, Insights and Forecast - by Deployment Type
- 11.2.1. Cloud-based
- 11.2.2. On-premise
- 11.3. Market Analysis, Insights and Forecast - by Solution Type
- 11.3.1. Workstations
- 11.3.2. Mobile Devices
- 11.3.3. Servers
- 11.3.4. Point of Sale Terminals
- 11.4. Market Analysis, Insights and Forecast - by Organization Size
- 11.4.1. Small And Medium Enterprises (SMES)
- 11.4.2. Large Enterprises
- 11.5. Market Analysis, Insights and Forecast - by End-user Industry
- 11.5.1. BFSI
- 11.5.2. IT and Telecom
- 11.5.3. Manufacturing
- 11.5.4. Healthcare
- 11.5.5. Retail
- 11.5.6. Other End-user Industries
- 11.1. Market Analysis, Insights and Forecast - by Component
- 12. North America Endpoint Detection and Response Market Analysis, Insights and Forecast, 2019-2031
- 12.1. Market Analysis, Insights and Forecast - By Country/Sub-region
- 12.1.1 United States
- 12.1.2 Canada
- 13. Europe Endpoint Detection and Response Market Analysis, Insights and Forecast, 2019-2031
- 13.1. Market Analysis, Insights and Forecast - By Country/Sub-region
- 13.1.1 Germany
- 13.1.2 United Kingdom
- 13.1.3 France
- 14. Asia Endpoint Detection and Response Market Analysis, Insights and Forecast, 2019-2031
- 14.1. Market Analysis, Insights and Forecast - By Country/Sub-region
- 14.1.1 China
- 14.1.2 Japan
- 14.1.3 India
- 14.1.4 Australia and New Zealand
- 15. Middle East and Africa Endpoint Detection and Response Market Analysis, Insights and Forecast, 2019-2031
- 15.1. Market Analysis, Insights and Forecast - By Country/Sub-region
- 15.1.1.
- 16. Latin America Endpoint Detection and Response Market Analysis, Insights and Forecast, 2019-2031
- 16.1. Market Analysis, Insights and Forecast - By Country/Sub-region
- 16.1.1.
- 17. Competitive Analysis
- 17.1. Global Market Share Analysis 2024
- 17.2. Company Profiles
- 17.2.1 Musarubra US LLC (Trellix)
- 17.2.1.1. Overview
- 17.2.1.2. Products
- 17.2.1.3. SWOT Analysis
- 17.2.1.4. Recent Developments
- 17.2.1.5. Financials (Based on Availability)
- 17.2.2 Fortinet Inc
- 17.2.2.1. Overview
- 17.2.2.2. Products
- 17.2.2.3. SWOT Analysis
- 17.2.2.4. Recent Developments
- 17.2.2.5. Financials (Based on Availability)
- 17.2.3 Cybereason Inc
- 17.2.3.1. Overview
- 17.2.3.2. Products
- 17.2.3.3. SWOT Analysis
- 17.2.3.4. Recent Developments
- 17.2.3.5. Financials (Based on Availability)
- 17.2.4 Cisco Systems Inc
- 17.2.4.1. Overview
- 17.2.4.2. Products
- 17.2.4.3. SWOT Analysis
- 17.2.4.4. Recent Developments
- 17.2.4.5. Financials (Based on Availability)
- 17.2.5 Broadcom Inc
- 17.2.5.1. Overview
- 17.2.5.2. Products
- 17.2.5.3. SWOT Analysis
- 17.2.5.4. Recent Developments
- 17.2.5.5. Financials (Based on Availability)
- 17.2.6 Sophos Ltd
- 17.2.6.1. Overview
- 17.2.6.2. Products
- 17.2.6.3. SWOT Analysis
- 17.2.6.4. Recent Developments
- 17.2.6.5. Financials (Based on Availability)
- 17.2.7 Open Text Corporation
- 17.2.7.1. Overview
- 17.2.7.2. Products
- 17.2.7.3. SWOT Analysis
- 17.2.7.4. Recent Developments
- 17.2.7.5. Financials (Based on Availability)
- 17.2.8 CrowdStrike Inc
- 17.2.8.1. Overview
- 17.2.8.2. Products
- 17.2.8.3. SWOT Analysis
- 17.2.8.4. Recent Developments
- 17.2.8.5. Financials (Based on Availability)
- 17.2.9 Fortra LLC
- 17.2.9.1. Overview
- 17.2.9.2. Products
- 17.2.9.3. SWOT Analysis
- 17.2.9.4. Recent Developments
- 17.2.9.5. Financials (Based on Availability)
- 17.2.10 Palo Alto Networks Inc
- 17.2.10.1. Overview
- 17.2.10.2. Products
- 17.2.10.3. SWOT Analysis
- 17.2.10.4. Recent Developments
- 17.2.10.5. Financials (Based on Availability)
- 17.2.11 Deep Instinct Ltd
- 17.2.11.1. Overview
- 17.2.11.2. Products
- 17.2.11.3. SWOT Analysis
- 17.2.11.4. Recent Developments
- 17.2.11.5. Financials (Based on Availability)
- 17.2.1 Musarubra US LLC (Trellix)
List of Figures
- Figure 1: Global Endpoint Detection and Response Market Revenue Breakdown (Million, %) by Region 2024 & 2032
- Figure 2: North America Endpoint Detection and Response Market Revenue (Million), by Country 2024 & 2032
- Figure 3: North America Endpoint Detection and Response Market Revenue Share (%), by Country 2024 & 2032
- Figure 4: Europe Endpoint Detection and Response Market Revenue (Million), by Country 2024 & 2032
- Figure 5: Europe Endpoint Detection and Response Market Revenue Share (%), by Country 2024 & 2032
- Figure 6: Asia Endpoint Detection and Response Market Revenue (Million), by Country 2024 & 2032
- Figure 7: Asia Endpoint Detection and Response Market Revenue Share (%), by Country 2024 & 2032
- Figure 8: Middle East and Africa Endpoint Detection and Response Market Revenue (Million), by Country 2024 & 2032
- Figure 9: Middle East and Africa Endpoint Detection and Response Market Revenue Share (%), by Country 2024 & 2032
- Figure 10: Latin America Endpoint Detection and Response Market Revenue (Million), by Country 2024 & 2032
- Figure 11: Latin America Endpoint Detection and Response Market Revenue Share (%), by Country 2024 & 2032
- Figure 12: North America Endpoint Detection and Response Market Revenue (Million), by Component 2024 & 2032
- Figure 13: North America Endpoint Detection and Response Market Revenue Share (%), by Component 2024 & 2032
- Figure 14: North America Endpoint Detection and Response Market Revenue (Million), by Deployment Type 2024 & 2032
- Figure 15: North America Endpoint Detection and Response Market Revenue Share (%), by Deployment Type 2024 & 2032
- Figure 16: North America Endpoint Detection and Response Market Revenue (Million), by Solution Type 2024 & 2032
- Figure 17: North America Endpoint Detection and Response Market Revenue Share (%), by Solution Type 2024 & 2032
- Figure 18: North America Endpoint Detection and Response Market Revenue (Million), by Organization Size 2024 & 2032
- Figure 19: North America Endpoint Detection and Response Market Revenue Share (%), by Organization Size 2024 & 2032
- Figure 20: North America Endpoint Detection and Response Market Revenue (Million), by End-user Industry 2024 & 2032
- Figure 21: North America Endpoint Detection and Response Market Revenue Share (%), by End-user Industry 2024 & 2032
- Figure 22: North America Endpoint Detection and Response Market Revenue (Million), by Country 2024 & 2032
- Figure 23: North America Endpoint Detection and Response Market Revenue Share (%), by Country 2024 & 2032
- Figure 24: Europe Endpoint Detection and Response Market Revenue (Million), by Component 2024 & 2032
- Figure 25: Europe Endpoint Detection and Response Market Revenue Share (%), by Component 2024 & 2032
- Figure 26: Europe Endpoint Detection and Response Market Revenue (Million), by Deployment Type 2024 & 2032
- Figure 27: Europe Endpoint Detection and Response Market Revenue Share (%), by Deployment Type 2024 & 2032
- Figure 28: Europe Endpoint Detection and Response Market Revenue (Million), by Solution Type 2024 & 2032
- Figure 29: Europe Endpoint Detection and Response Market Revenue Share (%), by Solution Type 2024 & 2032
- Figure 30: Europe Endpoint Detection and Response Market Revenue (Million), by Organization Size 2024 & 2032
- Figure 31: Europe Endpoint Detection and Response Market Revenue Share (%), by Organization Size 2024 & 2032
- Figure 32: Europe Endpoint Detection and Response Market Revenue (Million), by End-user Industry 2024 & 2032
- Figure 33: Europe Endpoint Detection and Response Market Revenue Share (%), by End-user Industry 2024 & 2032
- Figure 34: Europe Endpoint Detection and Response Market Revenue (Million), by Country 2024 & 2032
- Figure 35: Europe Endpoint Detection and Response Market Revenue Share (%), by Country 2024 & 2032
- Figure 36: Asia Endpoint Detection and Response Market Revenue (Million), by Component 2024 & 2032
- Figure 37: Asia Endpoint Detection and Response Market Revenue Share (%), by Component 2024 & 2032
- Figure 38: Asia Endpoint Detection and Response Market Revenue (Million), by Deployment Type 2024 & 2032
- Figure 39: Asia Endpoint Detection and Response Market Revenue Share (%), by Deployment Type 2024 & 2032
- Figure 40: Asia Endpoint Detection and Response Market Revenue (Million), by Solution Type 2024 & 2032
- Figure 41: Asia Endpoint Detection and Response Market Revenue Share (%), by Solution Type 2024 & 2032
- Figure 42: Asia Endpoint Detection and Response Market Revenue (Million), by Organization Size 2024 & 2032
- Figure 43: Asia Endpoint Detection and Response Market Revenue Share (%), by Organization Size 2024 & 2032
- Figure 44: Asia Endpoint Detection and Response Market Revenue (Million), by End-user Industry 2024 & 2032
- Figure 45: Asia Endpoint Detection and Response Market Revenue Share (%), by End-user Industry 2024 & 2032
- Figure 46: Asia Endpoint Detection and Response Market Revenue (Million), by Country 2024 & 2032
- Figure 47: Asia Endpoint Detection and Response Market Revenue Share (%), by Country 2024 & 2032
- Figure 48: Australia and New Zealand Endpoint Detection and Response Market Revenue (Million), by Component 2024 & 2032
- Figure 49: Australia and New Zealand Endpoint Detection and Response Market Revenue Share (%), by Component 2024 & 2032
- Figure 50: Australia and New Zealand Endpoint Detection and Response Market Revenue (Million), by Deployment Type 2024 & 2032
- Figure 51: Australia and New Zealand Endpoint Detection and Response Market Revenue Share (%), by Deployment Type 2024 & 2032
- Figure 52: Australia and New Zealand Endpoint Detection and Response Market Revenue (Million), by Solution Type 2024 & 2032
- Figure 53: Australia and New Zealand Endpoint Detection and Response Market Revenue Share (%), by Solution Type 2024 & 2032
- Figure 54: Australia and New Zealand Endpoint Detection and Response Market Revenue (Million), by Organization Size 2024 & 2032
- Figure 55: Australia and New Zealand Endpoint Detection and Response Market Revenue Share (%), by Organization Size 2024 & 2032
- Figure 56: Australia and New Zealand Endpoint Detection and Response Market Revenue (Million), by End-user Industry 2024 & 2032
- Figure 57: Australia and New Zealand Endpoint Detection and Response Market Revenue Share (%), by End-user Industry 2024 & 2032
- Figure 58: Australia and New Zealand Endpoint Detection and Response Market Revenue (Million), by Country 2024 & 2032
- Figure 59: Australia and New Zealand Endpoint Detection and Response Market Revenue Share (%), by Country 2024 & 2032
- Figure 60: Middle East and Africa Endpoint Detection and Response Market Revenue (Million), by Component 2024 & 2032
- Figure 61: Middle East and Africa Endpoint Detection and Response Market Revenue Share (%), by Component 2024 & 2032
- Figure 62: Middle East and Africa Endpoint Detection and Response Market Revenue (Million), by Deployment Type 2024 & 2032
- Figure 63: Middle East and Africa Endpoint Detection and Response Market Revenue Share (%), by Deployment Type 2024 & 2032
- Figure 64: Middle East and Africa Endpoint Detection and Response Market Revenue (Million), by Solution Type 2024 & 2032
- Figure 65: Middle East and Africa Endpoint Detection and Response Market Revenue Share (%), by Solution Type 2024 & 2032
- Figure 66: Middle East and Africa Endpoint Detection and Response Market Revenue (Million), by Organization Size 2024 & 2032
- Figure 67: Middle East and Africa Endpoint Detection and Response Market Revenue Share (%), by Organization Size 2024 & 2032
- Figure 68: Middle East and Africa Endpoint Detection and Response Market Revenue (Million), by End-user Industry 2024 & 2032
- Figure 69: Middle East and Africa Endpoint Detection and Response Market Revenue Share (%), by End-user Industry 2024 & 2032
- Figure 70: Middle East and Africa Endpoint Detection and Response Market Revenue (Million), by Country 2024 & 2032
- Figure 71: Middle East and Africa Endpoint Detection and Response Market Revenue Share (%), by Country 2024 & 2032
- Figure 72: Latin America Endpoint Detection and Response Market Revenue (Million), by Component 2024 & 2032
- Figure 73: Latin America Endpoint Detection and Response Market Revenue Share (%), by Component 2024 & 2032
- Figure 74: Latin America Endpoint Detection and Response Market Revenue (Million), by Deployment Type 2024 & 2032
- Figure 75: Latin America Endpoint Detection and Response Market Revenue Share (%), by Deployment Type 2024 & 2032
- Figure 76: Latin America Endpoint Detection and Response Market Revenue (Million), by Solution Type 2024 & 2032
- Figure 77: Latin America Endpoint Detection and Response Market Revenue Share (%), by Solution Type 2024 & 2032
- Figure 78: Latin America Endpoint Detection and Response Market Revenue (Million), by Organization Size 2024 & 2032
- Figure 79: Latin America Endpoint Detection and Response Market Revenue Share (%), by Organization Size 2024 & 2032
- Figure 80: Latin America Endpoint Detection and Response Market Revenue (Million), by End-user Industry 2024 & 2032
- Figure 81: Latin America Endpoint Detection and Response Market Revenue Share (%), by End-user Industry 2024 & 2032
- Figure 82: Latin America Endpoint Detection and Response Market Revenue (Million), by Country 2024 & 2032
- Figure 83: Latin America Endpoint Detection and Response Market Revenue Share (%), by Country 2024 & 2032
List of Tables
- Table 1: Global Endpoint Detection and Response Market Revenue Million Forecast, by Region 2019 & 2032
- Table 2: Global Endpoint Detection and Response Market Revenue Million Forecast, by Component 2019 & 2032
- Table 3: Global Endpoint Detection and Response Market Revenue Million Forecast, by Deployment Type 2019 & 2032
- Table 4: Global Endpoint Detection and Response Market Revenue Million Forecast, by Solution Type 2019 & 2032
- Table 5: Global Endpoint Detection and Response Market Revenue Million Forecast, by Organization Size 2019 & 2032
- Table 6: Global Endpoint Detection and Response Market Revenue Million Forecast, by End-user Industry 2019 & 2032
- Table 7: Global Endpoint Detection and Response Market Revenue Million Forecast, by Region 2019 & 2032
- Table 8: Global Endpoint Detection and Response Market Revenue Million Forecast, by Country 2019 & 2032
- Table 9: United States Endpoint Detection and Response Market Revenue (Million) Forecast, by Application 2019 & 2032
- Table 10: Canada Endpoint Detection and Response Market Revenue (Million) Forecast, by Application 2019 & 2032
- Table 11: Global Endpoint Detection and Response Market Revenue Million Forecast, by Country 2019 & 2032
- Table 12: Germany Endpoint Detection and Response Market Revenue (Million) Forecast, by Application 2019 & 2032
- Table 13: United Kingdom Endpoint Detection and Response Market Revenue (Million) Forecast, by Application 2019 & 2032
- Table 14: France Endpoint Detection and Response Market Revenue (Million) Forecast, by Application 2019 & 2032
- Table 15: Global Endpoint Detection and Response Market Revenue Million Forecast, by Country 2019 & 2032
- Table 16: China Endpoint Detection and Response Market Revenue (Million) Forecast, by Application 2019 & 2032
- Table 17: Japan Endpoint Detection and Response Market Revenue (Million) Forecast, by Application 2019 & 2032
- Table 18: India Endpoint Detection and Response Market Revenue (Million) Forecast, by Application 2019 & 2032
- Table 19: Australia and New Zealand Endpoint Detection and Response Market Revenue (Million) Forecast, by Application 2019 & 2032
- Table 20: Global Endpoint Detection and Response Market Revenue Million Forecast, by Country 2019 & 2032
- Table 21: Endpoint Detection and Response Market Revenue (Million) Forecast, by Application 2019 & 2032
- Table 22: Global Endpoint Detection and Response Market Revenue Million Forecast, by Country 2019 & 2032
- Table 23: Endpoint Detection and Response Market Revenue (Million) Forecast, by Application 2019 & 2032
- Table 24: Global Endpoint Detection and Response Market Revenue Million Forecast, by Component 2019 & 2032
- Table 25: Global Endpoint Detection and Response Market Revenue Million Forecast, by Deployment Type 2019 & 2032
- Table 26: Global Endpoint Detection and Response Market Revenue Million Forecast, by Solution Type 2019 & 2032
- Table 27: Global Endpoint Detection and Response Market Revenue Million Forecast, by Organization Size 2019 & 2032
- Table 28: Global Endpoint Detection and Response Market Revenue Million Forecast, by End-user Industry 2019 & 2032
- Table 29: Global Endpoint Detection and Response Market Revenue Million Forecast, by Country 2019 & 2032
- Table 30: United States Endpoint Detection and Response Market Revenue (Million) Forecast, by Application 2019 & 2032
- Table 31: Canada Endpoint Detection and Response Market Revenue (Million) Forecast, by Application 2019 & 2032
- Table 32: Global Endpoint Detection and Response Market Revenue Million Forecast, by Component 2019 & 2032
- Table 33: Global Endpoint Detection and Response Market Revenue Million Forecast, by Deployment Type 2019 & 2032
- Table 34: Global Endpoint Detection and Response Market Revenue Million Forecast, by Solution Type 2019 & 2032
- Table 35: Global Endpoint Detection and Response Market Revenue Million Forecast, by Organization Size 2019 & 2032
- Table 36: Global Endpoint Detection and Response Market Revenue Million Forecast, by End-user Industry 2019 & 2032
- Table 37: Global Endpoint Detection and Response Market Revenue Million Forecast, by Country 2019 & 2032
- Table 38: Germany Endpoint Detection and Response Market Revenue (Million) Forecast, by Application 2019 & 2032
- Table 39: United Kingdom Endpoint Detection and Response Market Revenue (Million) Forecast, by Application 2019 & 2032
- Table 40: France Endpoint Detection and Response Market Revenue (Million) Forecast, by Application 2019 & 2032
- Table 41: Global Endpoint Detection and Response Market Revenue Million Forecast, by Component 2019 & 2032
- Table 42: Global Endpoint Detection and Response Market Revenue Million Forecast, by Deployment Type 2019 & 2032
- Table 43: Global Endpoint Detection and Response Market Revenue Million Forecast, by Solution Type 2019 & 2032
- Table 44: Global Endpoint Detection and Response Market Revenue Million Forecast, by Organization Size 2019 & 2032
- Table 45: Global Endpoint Detection and Response Market Revenue Million Forecast, by End-user Industry 2019 & 2032
- Table 46: Global Endpoint Detection and Response Market Revenue Million Forecast, by Country 2019 & 2032
- Table 47: China Endpoint Detection and Response Market Revenue (Million) Forecast, by Application 2019 & 2032
- Table 48: Japan Endpoint Detection and Response Market Revenue (Million) Forecast, by Application 2019 & 2032
- Table 49: India Endpoint Detection and Response Market Revenue (Million) Forecast, by Application 2019 & 2032
- Table 50: Global Endpoint Detection and Response Market Revenue Million Forecast, by Component 2019 & 2032
- Table 51: Global Endpoint Detection and Response Market Revenue Million Forecast, by Deployment Type 2019 & 2032
- Table 52: Global Endpoint Detection and Response Market Revenue Million Forecast, by Solution Type 2019 & 2032
- Table 53: Global Endpoint Detection and Response Market Revenue Million Forecast, by Organization Size 2019 & 2032
- Table 54: Global Endpoint Detection and Response Market Revenue Million Forecast, by End-user Industry 2019 & 2032
- Table 55: Global Endpoint Detection and Response Market Revenue Million Forecast, by Country 2019 & 2032
- Table 56: Global Endpoint Detection and Response Market Revenue Million Forecast, by Component 2019 & 2032
- Table 57: Global Endpoint Detection and Response Market Revenue Million Forecast, by Deployment Type 2019 & 2032
- Table 58: Global Endpoint Detection and Response Market Revenue Million Forecast, by Solution Type 2019 & 2032
- Table 59: Global Endpoint Detection and Response Market Revenue Million Forecast, by Organization Size 2019 & 2032
- Table 60: Global Endpoint Detection and Response Market Revenue Million Forecast, by End-user Industry 2019 & 2032
- Table 61: Global Endpoint Detection and Response Market Revenue Million Forecast, by Country 2019 & 2032
- Table 62: Global Endpoint Detection and Response Market Revenue Million Forecast, by Component 2019 & 2032
- Table 63: Global Endpoint Detection and Response Market Revenue Million Forecast, by Deployment Type 2019 & 2032
- Table 64: Global Endpoint Detection and Response Market Revenue Million Forecast, by Solution Type 2019 & 2032
- Table 65: Global Endpoint Detection and Response Market Revenue Million Forecast, by Organization Size 2019 & 2032
- Table 66: Global Endpoint Detection and Response Market Revenue Million Forecast, by End-user Industry 2019 & 2032
- Table 67: Global Endpoint Detection and Response Market Revenue Million Forecast, by Country 2019 & 2032
Frequently Asked Questions
1. What is the projected Compound Annual Growth Rate (CAGR) of the Endpoint Detection and Response Market?
The projected CAGR is approximately 24.80%.
2. Which companies are prominent players in the Endpoint Detection and Response Market?
Key companies in the market include Musarubra US LLC (Trellix), Fortinet Inc, Cybereason Inc, Cisco Systems Inc, Broadcom Inc, Sophos Ltd, Open Text Corporation, CrowdStrike Inc, Fortra LLC, Palo Alto Networks Inc, Deep Instinct Ltd.
3. What are the main segments of the Endpoint Detection and Response Market?
The market segments include Component, Deployment Type, Solution Type, Organization Size, End-user Industry.
4. Can you provide details about the market size?
The market size is estimated to be USD 4.09 Million as of 2022.
5. What are some drivers contributing to market growth?
Increasing Expansion of Enterprise Mobility; Bring your Own Device (BYOD) Adoption and Increased Remote Working.
6. What are the notable trends driving market growth?
Small and Medium Enterprises (SMEs) to Witness Major Growth.
7. Are there any restraints impacting market growth?
Limited Development in the Field of Low-Voltage Fuses and Unorganized Aftermarket in the Fuse Market.
8. Can you provide examples of recent developments in the market?
October 2023: HarfangLab, a French cybersecurity company offering endpoint detection and response (EDR) solutions to enhance the identification and neutralization of cyberattacks against companies, has closed a EUR 25 million Series A funding round, which would be used to accelerate HarfangLab's business expansion in Europe, and can support the market growth.
9. What pricing options are available for accessing the report?
Pricing options include single-user, multi-user, and enterprise licenses priced at USD 4750, USD 5250, and USD 8750 respectively.
10. Is the market size provided in terms of value or volume?
The market size is provided in terms of value, measured in Million.
11. Are there any specific market keywords associated with the report?
Yes, the market keyword associated with the report is "Endpoint Detection and Response Market," which aids in identifying and referencing the specific market segment covered.
12. How do I determine which pricing option suits my needs best?
The pricing options vary based on user requirements and access needs. Individual users may opt for single-user licenses, while businesses requiring broader access may choose multi-user or enterprise licenses for cost-effective access to the report.
13. Are there any additional resources or data provided in the Endpoint Detection and Response Market report?
While the report offers comprehensive insights, it's advisable to review the specific contents or supplementary materials provided to ascertain if additional resources or data are available.
14. How can I stay updated on further developments or reports in the Endpoint Detection and Response Market?
To stay informed about further developments, trends, and reports in the Endpoint Detection and Response Market, consider subscribing to industry newsletters, following relevant companies and organizations, or regularly checking reputable industry news sources and publications.
Methodology
Step 1 - Identification of Relevant Samples Size from Population Database


Step 2 - Approaches for Defining Global Market Size (Value, Volume* & Price*)

Note*: In applicable scenarios
Step 3 - Data Sources
Primary Research
- Web Analytics
- Survey Reports
- Research Institute
- Latest Research Reports
- Opinion Leaders
Secondary Research
- Annual Reports
- White Paper
- Latest Press Release
- Industry Association
- Paid Database
- Investor Presentations

Step 4 - Data Triangulation
Involves using different sources of information in order to increase the validity of a study
These sources are likely to be stakeholders in a program - participants, other researchers, program staff, other community members, and so on.
Then we put all data in single framework & apply various statistical tools to find out the dynamic on the market.
During the analysis stage, feedback from the stakeholder groups would be compared to determine areas of agreement as well as areas of divergence
