

Key Insights
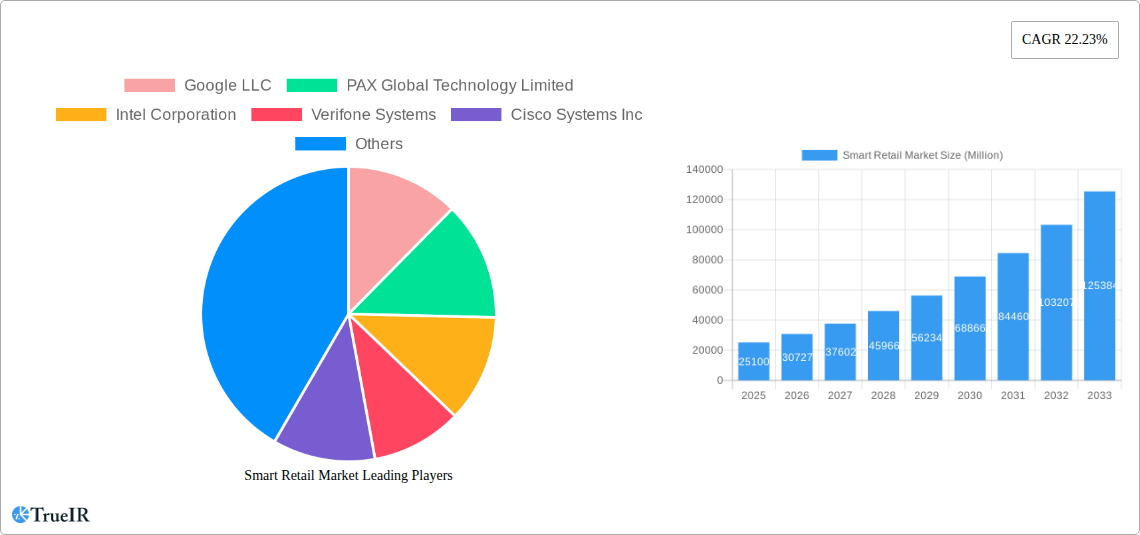
The smart retail market, valued at $25.10 billion in 2025, is experiencing robust growth, projected to expand at a compound annual growth rate (CAGR) of 22.23% from 2025 to 2033. This surge is driven by the increasing adoption of technologies like artificial intelligence (AI), the Internet of Things (IoT), and big data analytics to enhance customer experience, optimize operations, and improve supply chain efficiency. Retailers are leveraging AI-powered solutions for personalized recommendations, inventory management, and fraud detection, while IoT devices enable real-time tracking of goods and enhanced in-store experiences. The integration of these technologies leads to improved operational efficiency, reduced costs, and increased sales conversions. Furthermore, the rising consumer demand for seamless and personalized shopping experiences fuels the adoption of smart retail solutions. The competitive landscape is dominated by technology giants like Google, Intel, and Microsoft, alongside specialized players like Verifone and PAX Global Technology. These companies are continuously innovating to provide advanced solutions, fueling market competition and driving further growth.
The market segmentation, while not explicitly detailed, likely includes solutions categorized by technology (AI, IoT, cloud computing), application (inventory management, customer engagement, security), and deployment type (cloud, on-premises). Geographic expansion is expected across regions, with North America and Europe potentially leading the market initially due to higher technological adoption rates. However, Asia-Pacific is anticipated to show significant growth, fueled by increasing smartphone penetration and a growing e-commerce sector. Challenges such as high initial investment costs for implementing smart retail solutions and concerns regarding data security and privacy could potentially restrain market growth. However, the overall market outlook remains positive, driven by continuous technological advancements and the increasing need for retailers to adapt to evolving customer expectations and competitive pressures.
This comprehensive report provides an in-depth analysis of the global Smart Retail Market, offering invaluable insights into market trends, competitive dynamics, and future growth prospects. With a study period spanning 2019-2033, a base year of 2025, and an estimated year of 2025, this report is an essential resource for businesses, investors, and industry stakeholders seeking to navigate this rapidly evolving landscape. The market is projected to reach xx Million by 2033, exhibiting a robust CAGR of xx% during the forecast period (2025-2033).
Smart Retail Market Structure & Competitive Landscape
The Smart Retail Market is characterized by a moderately concentrated landscape, with several key players holding significant market share. The market structure is influenced by factors such as technological innovation, regulatory changes, the availability of substitute products, and the ongoing trend of mergers and acquisitions (M&A). The concentration ratio (CR4) is estimated to be approximately xx%, indicating a moderate level of concentration. M&A activity in the sector has been steadily increasing in recent years, with a total transaction volume of approximately xx Million in 2024, driven by companies seeking to expand their product portfolios and geographic reach. End-user segmentation includes large retailers, small and medium-sized enterprises (SMEs), and e-commerce platforms, each with varying adoption rates and needs.
- Market Concentration: CR4 estimated at xx%.
- Innovation Drivers: AI, IoT, Cloud Computing, Big Data Analytics.
- Regulatory Impacts: Data privacy regulations, cybersecurity standards.
- Product Substitutes: Traditional retail models, alternative payment systems.
- End-User Segmentation: Large retailers, SMEs, e-commerce platforms.
- M&A Trends: Increasing activity, driven by expansion and portfolio diversification. Total transaction value in 2024 estimated at xx Million.
Smart Retail Market Market Trends & Opportunities
The Smart Retail Market is experiencing significant growth, driven by several key factors. The market size is projected to reach xx Million by 2025, representing a substantial increase from xx Million in 2019. This growth is fueled by the increasing adoption of advanced technologies such as artificial intelligence (AI), the Internet of Things (IoT), and cloud computing, which are transforming the retail experience and enhancing operational efficiency. Consumer preferences are shifting towards personalized shopping experiences and seamless omnichannel integration, further driving demand for smart retail solutions. The market penetration rate for smart retail technologies is expected to reach xx% by 2033, indicating significant growth potential. Competitive dynamics are marked by intense innovation and strategic partnerships, with companies vying to develop and deploy cutting-edge solutions. The CAGR for the market is estimated to be xx% during the forecast period.

Dominant Markets & Segments in Smart Retail Market
The North American market currently holds a dominant position in the global Smart Retail Market, accounting for approximately xx% of the total market share in 2024. This dominance is primarily attributable to factors such as robust technological infrastructure, high consumer adoption rates, and favorable regulatory environments. Key growth drivers in North America include:
- Advanced Technological Infrastructure: High broadband penetration and widespread adoption of mobile technologies.
- Supportive Regulatory Framework: Government initiatives promoting technological innovation and digital transformation.
- High Consumer Spending Power: Increased disposable income and willingness to adopt new technologies.
Other regions, such as Europe and Asia-Pacific, are also exhibiting strong growth potential, driven by increasing investments in smart retail technologies and rising consumer demand for advanced shopping experiences.
Smart Retail Market Product Analysis
Smart retail solutions encompass a wide range of products, including smart shelves, self-checkout kiosks, AI-powered cameras, and RFID-enabled inventory management systems. These technologies enhance the customer experience, optimize inventory management, improve operational efficiency, and provide valuable data-driven insights. The competitive advantage lies in developing innovative solutions that offer superior functionality, seamless integration, and cost-effectiveness. Technological advancements in areas such as AI, computer vision, and big data analytics are constantly pushing the boundaries of what's possible, leading to a dynamic and evolving product landscape.
Key Drivers, Barriers & Challenges in Smart Retail Market
Key Drivers:
- Technological advancements: AI, IoT, big data analytics are driving innovation and efficiency.
- Evolving consumer preferences: Demand for personalized, convenient shopping experiences.
- Government initiatives: Policies promoting digital transformation and smart city development.
Challenges:
- High initial investment costs: Implementing smart retail solutions can be expensive.
- Data security and privacy concerns: Protecting sensitive customer data is crucial.
- Integration complexities: Seamless integration with existing systems can be challenging. Estimated impact on market growth: xx% reduction in growth rate due to integration difficulties.
Growth Drivers in the Smart Retail Market Market
The key drivers propelling the Smart Retail Market’s growth are technological advancements like AI and IoT, changing consumer preferences towards personalized experiences, government initiatives supporting digital transformation, and the increasing need for operational efficiency within retail environments. These factors collectively contribute to substantial market expansion.
Challenges Impacting Smart Retail Market Growth
High initial investment costs, data security concerns, complex integration with existing systems, and resistance to adopting new technologies among some retailers are key barriers to market growth. These challenges, if not addressed, could significantly hinder the widespread adoption of smart retail solutions.
Key Players Shaping the Smart Retail Market Market
- Google LLC
- PAX Global Technology Limited
- Intel Corporation
- Verifone Systems
- Cisco Systems Inc
- Huawei Technologies Co Ltd
- IBM Corporation
- Fiserv Inc
- Microsoft
- Honeywell International Inc
- NVIDIA Corporation
- Samsung Electronics
- Amazon com Inc
- NXP Semiconductors
- Caper Inc
- Ingenico Group
- Focal Systems Inc
- LG Display Co Ltd
- NCR Corporation
- *List Not Exhaustive
Significant Smart Retail Market Industry Milestones
- June 2024: Instacart launches AI-powered Caper Carts in Missouri, enhancing the shopping experience and streamlining checkout.
- February 2024: Huawei unveils its Smart Retail Solution, focusing on smart environments, intelligent warehousing, and digital marketing for improved efficiency and customer experience.
Future Outlook for Smart Retail Market Market
The Smart Retail Market is poised for continued growth, driven by ongoing technological innovations and increasing consumer demand for seamless and personalized shopping experiences. Strategic partnerships and investments in AI and IoT will further fuel market expansion, creating significant opportunities for businesses to capitalize on the evolving retail landscape. The market is expected to experience substantial growth in the coming years, with significant potential for innovation and market penetration.
Smart Retail Market Segmentation
-
1. Component
- 1.1. Hardware
- 1.2. Software
- 1.3. Services
-
2. Application
- 2.1. Inventory Management
- 2.2. Brand Protection
- 2.3. Foot-Traffic Monitoring
- 2.4. Loyalty Management and Payment
- 2.5. Predictive Equipment Maintenance
- 2.6. Others
Smart Retail Market Segmentation By Geography
- 1. North America
- 2. Europe
- 3. Asia
- 4. Australia and New Zealand
- 5. Latin America
- 6. Middle East and Africa

Smart Retail Market REPORT HIGHLIGHTS
| Aspects | Details |
|---|---|
| Study Period | 2019-2033 |
| Base Year | 2024 |
| Estimated Year | 2025 |
| Forecast Period | 2025-2033 |
| Historical Period | 2019-2024 |
| Growth Rate | CAGR of 22.23% from 2019-2033 |
| Segmentation |
|
Table of Contents
- 1. Introduction
- 1.1. Research Scope
- 1.2. Market Segmentation
- 1.3. Research Methodology
- 1.4. Definitions and Assumptions
- 2. Executive Summary
- 2.1. Introduction
- 3. Market Dynamics
- 3.1. Introduction
- 3.2. Market Drivers
- 3.2.1. Growing Investments in Retail Chains and Retail Supermarkets; Rising Adoption of Advances in Technology Across Retail Chain
- 3.3. Market Restrains
- 3.3.1. Growing Investments in Retail Chains and Retail Supermarkets; Rising Adoption of Advances in Technology Across Retail Chain
- 3.4. Market Trends
- 3.4.1. Inventory Managment Segment is Expected to Hold Significant Market Share
- 4. Market Factor Analysis
- 4.1. Porters Five Forces
- 4.2. Supply/Value Chain
- 4.3. PESTEL analysis
- 4.4. Market Entropy
- 4.5. Patent/Trademark Analysis
- 5. Global Smart Retail Market Analysis, Insights and Forecast, 2019-2031
- 5.1. Market Analysis, Insights and Forecast - by Component
- 5.1.1. Hardware
- 5.1.2. Software
- 5.1.3. Services
- 5.2. Market Analysis, Insights and Forecast - by Application
- 5.2.1. Inventory Management
- 5.2.2. Brand Protection
- 5.2.3. Foot-Traffic Monitoring
- 5.2.4. Loyalty Management and Payment
- 5.2.5. Predictive Equipment Maintenance
- 5.2.6. Others
- 5.3. Market Analysis, Insights and Forecast - by Region
- 5.3.1. North America
- 5.3.2. Europe
- 5.3.3. Asia
- 5.3.4. Australia and New Zealand
- 5.3.5. Latin America
- 5.3.6. Middle East and Africa
- 5.1. Market Analysis, Insights and Forecast - by Component
- 6. North America Smart Retail Market Analysis, Insights and Forecast, 2019-2031
- 6.1. Market Analysis, Insights and Forecast - by Component
- 6.1.1. Hardware
- 6.1.2. Software
- 6.1.3. Services
- 6.2. Market Analysis, Insights and Forecast - by Application
- 6.2.1. Inventory Management
- 6.2.2. Brand Protection
- 6.2.3. Foot-Traffic Monitoring
- 6.2.4. Loyalty Management and Payment
- 6.2.5. Predictive Equipment Maintenance
- 6.2.6. Others
- 6.1. Market Analysis, Insights and Forecast - by Component
- 7. Europe Smart Retail Market Analysis, Insights and Forecast, 2019-2031
- 7.1. Market Analysis, Insights and Forecast - by Component
- 7.1.1. Hardware
- 7.1.2. Software
- 7.1.3. Services
- 7.2. Market Analysis, Insights and Forecast - by Application
- 7.2.1. Inventory Management
- 7.2.2. Brand Protection
- 7.2.3. Foot-Traffic Monitoring
- 7.2.4. Loyalty Management and Payment
- 7.2.5. Predictive Equipment Maintenance
- 7.2.6. Others
- 7.1. Market Analysis, Insights and Forecast - by Component
- 8. Asia Smart Retail Market Analysis, Insights and Forecast, 2019-2031
- 8.1. Market Analysis, Insights and Forecast - by Component
- 8.1.1. Hardware
- 8.1.2. Software
- 8.1.3. Services
- 8.2. Market Analysis, Insights and Forecast - by Application
- 8.2.1. Inventory Management
- 8.2.2. Brand Protection
- 8.2.3. Foot-Traffic Monitoring
- 8.2.4. Loyalty Management and Payment
- 8.2.5. Predictive Equipment Maintenance
- 8.2.6. Others
- 8.1. Market Analysis, Insights and Forecast - by Component
- 9. Australia and New Zealand Smart Retail Market Analysis, Insights and Forecast, 2019-2031
- 9.1. Market Analysis, Insights and Forecast - by Component
- 9.1.1. Hardware
- 9.1.2. Software
- 9.1.3. Services
- 9.2. Market Analysis, Insights and Forecast - by Application
- 9.2.1. Inventory Management
- 9.2.2. Brand Protection
- 9.2.3. Foot-Traffic Monitoring
- 9.2.4. Loyalty Management and Payment
- 9.2.5. Predictive Equipment Maintenance
- 9.2.6. Others
- 9.1. Market Analysis, Insights and Forecast - by Component
- 10. Latin America Smart Retail Market Analysis, Insights and Forecast, 2019-2031
- 10.1. Market Analysis, Insights and Forecast - by Component
- 10.1.1. Hardware
- 10.1.2. Software
- 10.1.3. Services
- 10.2. Market Analysis, Insights and Forecast - by Application
- 10.2.1. Inventory Management
- 10.2.2. Brand Protection
- 10.2.3. Foot-Traffic Monitoring
- 10.2.4. Loyalty Management and Payment
- 10.2.5. Predictive Equipment Maintenance
- 10.2.6. Others
- 10.1. Market Analysis, Insights and Forecast - by Component
- 11. Middle East and Africa Smart Retail Market Analysis, Insights and Forecast, 2019-2031
- 11.1. Market Analysis, Insights and Forecast - by Component
- 11.1.1. Hardware
- 11.1.2. Software
- 11.1.3. Services
- 11.2. Market Analysis, Insights and Forecast - by Application
- 11.2.1. Inventory Management
- 11.2.2. Brand Protection
- 11.2.3. Foot-Traffic Monitoring
- 11.2.4. Loyalty Management and Payment
- 11.2.5. Predictive Equipment Maintenance
- 11.2.6. Others
- 11.1. Market Analysis, Insights and Forecast - by Component
- 12. Competitive Analysis
- 12.1. Global Market Share Analysis 2024
- 12.2. Company Profiles
- 12.2.1 Google LLC
- 12.2.1.1. Overview
- 12.2.1.2. Products
- 12.2.1.3. SWOT Analysis
- 12.2.1.4. Recent Developments
- 12.2.1.5. Financials (Based on Availability)
- 12.2.2 PAX Global Technology Limited
- 12.2.2.1. Overview
- 12.2.2.2. Products
- 12.2.2.3. SWOT Analysis
- 12.2.2.4. Recent Developments
- 12.2.2.5. Financials (Based on Availability)
- 12.2.3 Intel Corporation
- 12.2.3.1. Overview
- 12.2.3.2. Products
- 12.2.3.3. SWOT Analysis
- 12.2.3.4. Recent Developments
- 12.2.3.5. Financials (Based on Availability)
- 12.2.4 Verifone Systems
- 12.2.4.1. Overview
- 12.2.4.2. Products
- 12.2.4.3. SWOT Analysis
- 12.2.4.4. Recent Developments
- 12.2.4.5. Financials (Based on Availability)
- 12.2.5 Cisco Systems Inc
- 12.2.5.1. Overview
- 12.2.5.2. Products
- 12.2.5.3. SWOT Analysis
- 12.2.5.4. Recent Developments
- 12.2.5.5. Financials (Based on Availability)
- 12.2.6 Huawei Technologies Co Ltd
- 12.2.6.1. Overview
- 12.2.6.2. Products
- 12.2.6.3. SWOT Analysis
- 12.2.6.4. Recent Developments
- 12.2.6.5. Financials (Based on Availability)
- 12.2.7 IBM Corporation
- 12.2.7.1. Overview
- 12.2.7.2. Products
- 12.2.7.3. SWOT Analysis
- 12.2.7.4. Recent Developments
- 12.2.7.5. Financials (Based on Availability)
- 12.2.8 Fiserv Inc
- 12.2.8.1. Overview
- 12.2.8.2. Products
- 12.2.8.3. SWOT Analysis
- 12.2.8.4. Recent Developments
- 12.2.8.5. Financials (Based on Availability)
- 12.2.9 Microsoft
- 12.2.9.1. Overview
- 12.2.9.2. Products
- 12.2.9.3. SWOT Analysis
- 12.2.9.4. Recent Developments
- 12.2.9.5. Financials (Based on Availability)
- 12.2.10 Honeywell International Inc
- 12.2.10.1. Overview
- 12.2.10.2. Products
- 12.2.10.3. SWOT Analysis
- 12.2.10.4. Recent Developments
- 12.2.10.5. Financials (Based on Availability)
- 12.2.11 NVIDIA Corporation
- 12.2.11.1. Overview
- 12.2.11.2. Products
- 12.2.11.3. SWOT Analysis
- 12.2.11.4. Recent Developments
- 12.2.11.5. Financials (Based on Availability)
- 12.2.12 Samsung Electronics
- 12.2.12.1. Overview
- 12.2.12.2. Products
- 12.2.12.3. SWOT Analysis
- 12.2.12.4. Recent Developments
- 12.2.12.5. Financials (Based on Availability)
- 12.2.13 Amazon com Inc
- 12.2.13.1. Overview
- 12.2.13.2. Products
- 12.2.13.3. SWOT Analysis
- 12.2.13.4. Recent Developments
- 12.2.13.5. Financials (Based on Availability)
- 12.2.14 NXP Semiconductors
- 12.2.14.1. Overview
- 12.2.14.2. Products
- 12.2.14.3. SWOT Analysis
- 12.2.14.4. Recent Developments
- 12.2.14.5. Financials (Based on Availability)
- 12.2.15 Caper Inc
- 12.2.15.1. Overview
- 12.2.15.2. Products
- 12.2.15.3. SWOT Analysis
- 12.2.15.4. Recent Developments
- 12.2.15.5. Financials (Based on Availability)
- 12.2.16 Ingenico Group
- 12.2.16.1. Overview
- 12.2.16.2. Products
- 12.2.16.3. SWOT Analysis
- 12.2.16.4. Recent Developments
- 12.2.16.5. Financials (Based on Availability)
- 12.2.17 Focal Systems Inc
- 12.2.17.1. Overview
- 12.2.17.2. Products
- 12.2.17.3. SWOT Analysis
- 12.2.17.4. Recent Developments
- 12.2.17.5. Financials (Based on Availability)
- 12.2.18 LG Display Co Ltd
- 12.2.18.1. Overview
- 12.2.18.2. Products
- 12.2.18.3. SWOT Analysis
- 12.2.18.4. Recent Developments
- 12.2.18.5. Financials (Based on Availability)
- 12.2.19 NCR Corporation*List Not Exhaustive
- 12.2.19.1. Overview
- 12.2.19.2. Products
- 12.2.19.3. SWOT Analysis
- 12.2.19.4. Recent Developments
- 12.2.19.5. Financials (Based on Availability)
- 12.2.1 Google LLC
List of Figures
- Figure 1: Global Smart Retail Market Revenue Breakdown (Million, %) by Region 2024 & 2032
- Figure 2: Global Smart Retail Market Volume Breakdown (Billion, %) by Region 2024 & 2032
- Figure 3: North America Smart Retail Market Revenue (Million), by Component 2024 & 2032
- Figure 4: North America Smart Retail Market Volume (Billion), by Component 2024 & 2032
- Figure 5: North America Smart Retail Market Revenue Share (%), by Component 2024 & 2032
- Figure 6: North America Smart Retail Market Volume Share (%), by Component 2024 & 2032
- Figure 7: North America Smart Retail Market Revenue (Million), by Application 2024 & 2032
- Figure 8: North America Smart Retail Market Volume (Billion), by Application 2024 & 2032
- Figure 9: North America Smart Retail Market Revenue Share (%), by Application 2024 & 2032
- Figure 10: North America Smart Retail Market Volume Share (%), by Application 2024 & 2032
- Figure 11: North America Smart Retail Market Revenue (Million), by Country 2024 & 2032
- Figure 12: North America Smart Retail Market Volume (Billion), by Country 2024 & 2032
- Figure 13: North America Smart Retail Market Revenue Share (%), by Country 2024 & 2032
- Figure 14: North America Smart Retail Market Volume Share (%), by Country 2024 & 2032
- Figure 15: Europe Smart Retail Market Revenue (Million), by Component 2024 & 2032
- Figure 16: Europe Smart Retail Market Volume (Billion), by Component 2024 & 2032
- Figure 17: Europe Smart Retail Market Revenue Share (%), by Component 2024 & 2032
- Figure 18: Europe Smart Retail Market Volume Share (%), by Component 2024 & 2032
- Figure 19: Europe Smart Retail Market Revenue (Million), by Application 2024 & 2032
- Figure 20: Europe Smart Retail Market Volume (Billion), by Application 2024 & 2032
- Figure 21: Europe Smart Retail Market Revenue Share (%), by Application 2024 & 2032
- Figure 22: Europe Smart Retail Market Volume Share (%), by Application 2024 & 2032
- Figure 23: Europe Smart Retail Market Revenue (Million), by Country 2024 & 2032
- Figure 24: Europe Smart Retail Market Volume (Billion), by Country 2024 & 2032
- Figure 25: Europe Smart Retail Market Revenue Share (%), by Country 2024 & 2032
- Figure 26: Europe Smart Retail Market Volume Share (%), by Country 2024 & 2032
- Figure 27: Asia Smart Retail Market Revenue (Million), by Component 2024 & 2032
- Figure 28: Asia Smart Retail Market Volume (Billion), by Component 2024 & 2032
- Figure 29: Asia Smart Retail Market Revenue Share (%), by Component 2024 & 2032
- Figure 30: Asia Smart Retail Market Volume Share (%), by Component 2024 & 2032
- Figure 31: Asia Smart Retail Market Revenue (Million), by Application 2024 & 2032
- Figure 32: Asia Smart Retail Market Volume (Billion), by Application 2024 & 2032
- Figure 33: Asia Smart Retail Market Revenue Share (%), by Application 2024 & 2032
- Figure 34: Asia Smart Retail Market Volume Share (%), by Application 2024 & 2032
- Figure 35: Asia Smart Retail Market Revenue (Million), by Country 2024 & 2032
- Figure 36: Asia Smart Retail Market Volume (Billion), by Country 2024 & 2032
- Figure 37: Asia Smart Retail Market Revenue Share (%), by Country 2024 & 2032
- Figure 38: Asia Smart Retail Market Volume Share (%), by Country 2024 & 2032
- Figure 39: Australia and New Zealand Smart Retail Market Revenue (Million), by Component 2024 & 2032
- Figure 40: Australia and New Zealand Smart Retail Market Volume (Billion), by Component 2024 & 2032
- Figure 41: Australia and New Zealand Smart Retail Market Revenue Share (%), by Component 2024 & 2032
- Figure 42: Australia and New Zealand Smart Retail Market Volume Share (%), by Component 2024 & 2032
- Figure 43: Australia and New Zealand Smart Retail Market Revenue (Million), by Application 2024 & 2032
- Figure 44: Australia and New Zealand Smart Retail Market Volume (Billion), by Application 2024 & 2032
- Figure 45: Australia and New Zealand Smart Retail Market Revenue Share (%), by Application 2024 & 2032
- Figure 46: Australia and New Zealand Smart Retail Market Volume Share (%), by Application 2024 & 2032
- Figure 47: Australia and New Zealand Smart Retail Market Revenue (Million), by Country 2024 & 2032
- Figure 48: Australia and New Zealand Smart Retail Market Volume (Billion), by Country 2024 & 2032
- Figure 49: Australia and New Zealand Smart Retail Market Revenue Share (%), by Country 2024 & 2032
- Figure 50: Australia and New Zealand Smart Retail Market Volume Share (%), by Country 2024 & 2032
- Figure 51: Latin America Smart Retail Market Revenue (Million), by Component 2024 & 2032
- Figure 52: Latin America Smart Retail Market Volume (Billion), by Component 2024 & 2032
- Figure 53: Latin America Smart Retail Market Revenue Share (%), by Component 2024 & 2032
- Figure 54: Latin America Smart Retail Market Volume Share (%), by Component 2024 & 2032
- Figure 55: Latin America Smart Retail Market Revenue (Million), by Application 2024 & 2032
- Figure 56: Latin America Smart Retail Market Volume (Billion), by Application 2024 & 2032
- Figure 57: Latin America Smart Retail Market Revenue Share (%), by Application 2024 & 2032
- Figure 58: Latin America Smart Retail Market Volume Share (%), by Application 2024 & 2032
- Figure 59: Latin America Smart Retail Market Revenue (Million), by Country 2024 & 2032
- Figure 60: Latin America Smart Retail Market Volume (Billion), by Country 2024 & 2032
- Figure 61: Latin America Smart Retail Market Revenue Share (%), by Country 2024 & 2032
- Figure 62: Latin America Smart Retail Market Volume Share (%), by Country 2024 & 2032
- Figure 63: Middle East and Africa Smart Retail Market Revenue (Million), by Component 2024 & 2032
- Figure 64: Middle East and Africa Smart Retail Market Volume (Billion), by Component 2024 & 2032
- Figure 65: Middle East and Africa Smart Retail Market Revenue Share (%), by Component 2024 & 2032
- Figure 66: Middle East and Africa Smart Retail Market Volume Share (%), by Component 2024 & 2032
- Figure 67: Middle East and Africa Smart Retail Market Revenue (Million), by Application 2024 & 2032
- Figure 68: Middle East and Africa Smart Retail Market Volume (Billion), by Application 2024 & 2032
- Figure 69: Middle East and Africa Smart Retail Market Revenue Share (%), by Application 2024 & 2032
- Figure 70: Middle East and Africa Smart Retail Market Volume Share (%), by Application 2024 & 2032
- Figure 71: Middle East and Africa Smart Retail Market Revenue (Million), by Country 2024 & 2032
- Figure 72: Middle East and Africa Smart Retail Market Volume (Billion), by Country 2024 & 2032
- Figure 73: Middle East and Africa Smart Retail Market Revenue Share (%), by Country 2024 & 2032
- Figure 74: Middle East and Africa Smart Retail Market Volume Share (%), by Country 2024 & 2032
List of Tables
- Table 1: Global Smart Retail Market Revenue Million Forecast, by Region 2019 & 2032
- Table 2: Global Smart Retail Market Volume Billion Forecast, by Region 2019 & 2032
- Table 3: Global Smart Retail Market Revenue Million Forecast, by Component 2019 & 2032
- Table 4: Global Smart Retail Market Volume Billion Forecast, by Component 2019 & 2032
- Table 5: Global Smart Retail Market Revenue Million Forecast, by Application 2019 & 2032
- Table 6: Global Smart Retail Market Volume Billion Forecast, by Application 2019 & 2032
- Table 7: Global Smart Retail Market Revenue Million Forecast, by Region 2019 & 2032
- Table 8: Global Smart Retail Market Volume Billion Forecast, by Region 2019 & 2032
- Table 9: Global Smart Retail Market Revenue Million Forecast, by Component 2019 & 2032
- Table 10: Global Smart Retail Market Volume Billion Forecast, by Component 2019 & 2032
- Table 11: Global Smart Retail Market Revenue Million Forecast, by Application 2019 & 2032
- Table 12: Global Smart Retail Market Volume Billion Forecast, by Application 2019 & 2032
- Table 13: Global Smart Retail Market Revenue Million Forecast, by Country 2019 & 2032
- Table 14: Global Smart Retail Market Volume Billion Forecast, by Country 2019 & 2032
- Table 15: Global Smart Retail Market Revenue Million Forecast, by Component 2019 & 2032
- Table 16: Global Smart Retail Market Volume Billion Forecast, by Component 2019 & 2032
- Table 17: Global Smart Retail Market Revenue Million Forecast, by Application 2019 & 2032
- Table 18: Global Smart Retail Market Volume Billion Forecast, by Application 2019 & 2032
- Table 19: Global Smart Retail Market Revenue Million Forecast, by Country 2019 & 2032
- Table 20: Global Smart Retail Market Volume Billion Forecast, by Country 2019 & 2032
- Table 21: Global Smart Retail Market Revenue Million Forecast, by Component 2019 & 2032
- Table 22: Global Smart Retail Market Volume Billion Forecast, by Component 2019 & 2032
- Table 23: Global Smart Retail Market Revenue Million Forecast, by Application 2019 & 2032
- Table 24: Global Smart Retail Market Volume Billion Forecast, by Application 2019 & 2032
- Table 25: Global Smart Retail Market Revenue Million Forecast, by Country 2019 & 2032
- Table 26: Global Smart Retail Market Volume Billion Forecast, by Country 2019 & 2032
- Table 27: Global Smart Retail Market Revenue Million Forecast, by Component 2019 & 2032
- Table 28: Global Smart Retail Market Volume Billion Forecast, by Component 2019 & 2032
- Table 29: Global Smart Retail Market Revenue Million Forecast, by Application 2019 & 2032
- Table 30: Global Smart Retail Market Volume Billion Forecast, by Application 2019 & 2032
- Table 31: Global Smart Retail Market Revenue Million Forecast, by Country 2019 & 2032
- Table 32: Global Smart Retail Market Volume Billion Forecast, by Country 2019 & 2032
- Table 33: Global Smart Retail Market Revenue Million Forecast, by Component 2019 & 2032
- Table 34: Global Smart Retail Market Volume Billion Forecast, by Component 2019 & 2032
- Table 35: Global Smart Retail Market Revenue Million Forecast, by Application 2019 & 2032
- Table 36: Global Smart Retail Market Volume Billion Forecast, by Application 2019 & 2032
- Table 37: Global Smart Retail Market Revenue Million Forecast, by Country 2019 & 2032
- Table 38: Global Smart Retail Market Volume Billion Forecast, by Country 2019 & 2032
- Table 39: Global Smart Retail Market Revenue Million Forecast, by Component 2019 & 2032
- Table 40: Global Smart Retail Market Volume Billion Forecast, by Component 2019 & 2032
- Table 41: Global Smart Retail Market Revenue Million Forecast, by Application 2019 & 2032
- Table 42: Global Smart Retail Market Volume Billion Forecast, by Application 2019 & 2032
- Table 43: Global Smart Retail Market Revenue Million Forecast, by Country 2019 & 2032
- Table 44: Global Smart Retail Market Volume Billion Forecast, by Country 2019 & 2032
Frequently Asked Questions
1. What is the projected Compound Annual Growth Rate (CAGR) of the Smart Retail Market?
The projected CAGR is approximately 22.23%.
2. Which companies are prominent players in the Smart Retail Market?
Key companies in the market include Google LLC, PAX Global Technology Limited, Intel Corporation, Verifone Systems, Cisco Systems Inc, Huawei Technologies Co Ltd, IBM Corporation, Fiserv Inc, Microsoft, Honeywell International Inc, NVIDIA Corporation, Samsung Electronics, Amazon com Inc, NXP Semiconductors, Caper Inc, Ingenico Group, Focal Systems Inc, LG Display Co Ltd, NCR Corporation*List Not Exhaustive.
3. What are the main segments of the Smart Retail Market?
The market segments include Component, Application.
4. Can you provide details about the market size?
The market size is estimated to be USD 25.10 Million as of 2022.
5. What are some drivers contributing to market growth?
Growing Investments in Retail Chains and Retail Supermarkets; Rising Adoption of Advances in Technology Across Retail Chain.
6. What are the notable trends driving market growth?
Inventory Managment Segment is Expected to Hold Significant Market Share.
7. Are there any restraints impacting market growth?
Growing Investments in Retail Chains and Retail Supermarkets; Rising Adoption of Advances in Technology Across Retail Chain.
8. Can you provide examples of recent developments in the market?
June 2024: Instacart, in collaboration with Price Chopper and McKeever's Market & Eatery, announced the introduction of Caper Carts, which are powered by artificial intelligence, at select locations in Missouri. These innovative smart carts enhance the shopping experience by enabling customers to scan items while they shop easily, monitor their grocery budget in real time, and bypass the checkout line altogether.
9. What pricing options are available for accessing the report?
Pricing options include single-user, multi-user, and enterprise licenses priced at USD 4750, USD 5250, and USD 8750 respectively.
10. Is the market size provided in terms of value or volume?
The market size is provided in terms of value, measured in Million and volume, measured in Billion.
11. Are there any specific market keywords associated with the report?
Yes, the market keyword associated with the report is "Smart Retail Market," which aids in identifying and referencing the specific market segment covered.
12. How do I determine which pricing option suits my needs best?
The pricing options vary based on user requirements and access needs. Individual users may opt for single-user licenses, while businesses requiring broader access may choose multi-user or enterprise licenses for cost-effective access to the report.
13. Are there any additional resources or data provided in the Smart Retail Market report?
While the report offers comprehensive insights, it's advisable to review the specific contents or supplementary materials provided to ascertain if additional resources or data are available.
14. How can I stay updated on further developments or reports in the Smart Retail Market?
To stay informed about further developments, trends, and reports in the Smart Retail Market, consider subscribing to industry newsletters, following relevant companies and organizations, or regularly checking reputable industry news sources and publications.
Methodology
Step 1 - Identification of Relevant Samples Size from Population Database


Step 2 - Approaches for Defining Global Market Size (Value, Volume* & Price*)

Note*: In applicable scenarios
Step 3 - Data Sources
Primary Research
- Web Analytics
- Survey Reports
- Research Institute
- Latest Research Reports
- Opinion Leaders
Secondary Research
- Annual Reports
- White Paper
- Latest Press Release
- Industry Association
- Paid Database
- Investor Presentations

Step 4 - Data Triangulation
Involves using different sources of information in order to increase the validity of a study
These sources are likely to be stakeholders in a program - participants, other researchers, program staff, other community members, and so on.
Then we put all data in single framework & apply various statistical tools to find out the dynamic on the market.
During the analysis stage, feedback from the stakeholder groups would be compared to determine areas of agreement as well as areas of divergence
