

Key Insights
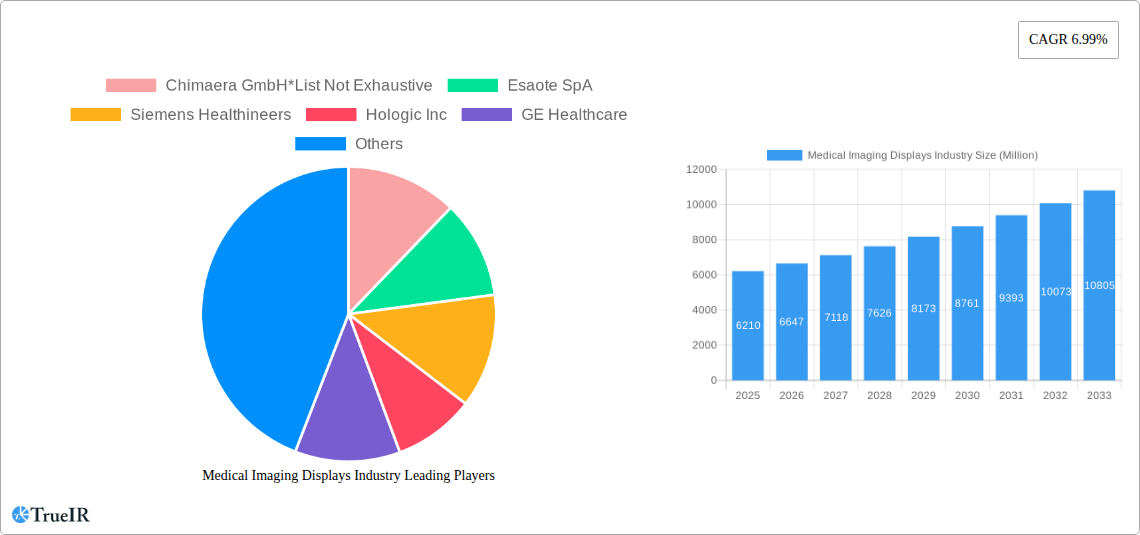
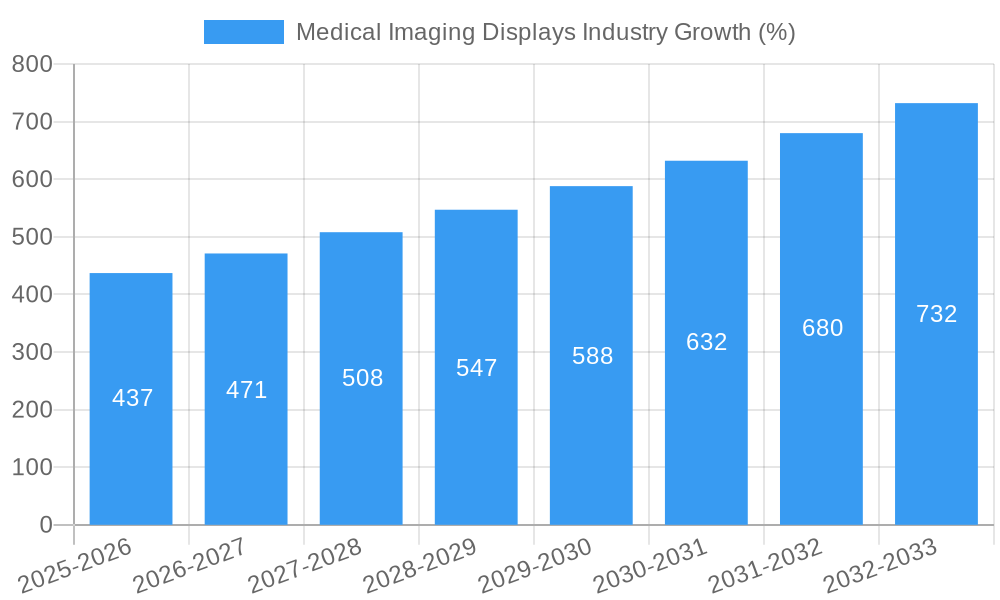
The medical imaging displays market, valued at $6.21 billion in 2025, is projected to experience robust growth, driven by several key factors. Technological advancements in display technology, such as higher resolutions, improved color accuracy, and increased brightness, are enhancing diagnostic capabilities and improving workflow efficiency for medical professionals. The increasing prevalence of chronic diseases, coupled with a rising geriatric population globally, fuels the demand for advanced medical imaging procedures, consequently boosting the market for high-quality displays. Furthermore, the growing adoption of minimally invasive procedures and the rising preference for image-guided surgery are contributing significantly to market expansion. The shift towards digitalization in healthcare, including the increasing use of PACS (Picture Archiving and Communication Systems) and RIS (Radiology Information Systems), further underpins this growth trajectory. Competition among key players like Siemens Healthineers, GE Healthcare, and Philips is fostering innovation and driving down costs, making advanced display technologies more accessible. Segment-wise, Computed Tomography (CT) and Magnetic Resonance Imaging (MRI) are anticipated to dominate due to their widespread use and higher image resolution requirements compared to other modalities. Thick client workstations currently hold a larger market share, but thin client solutions are gaining traction owing to their improved scalability and cost-effectiveness.
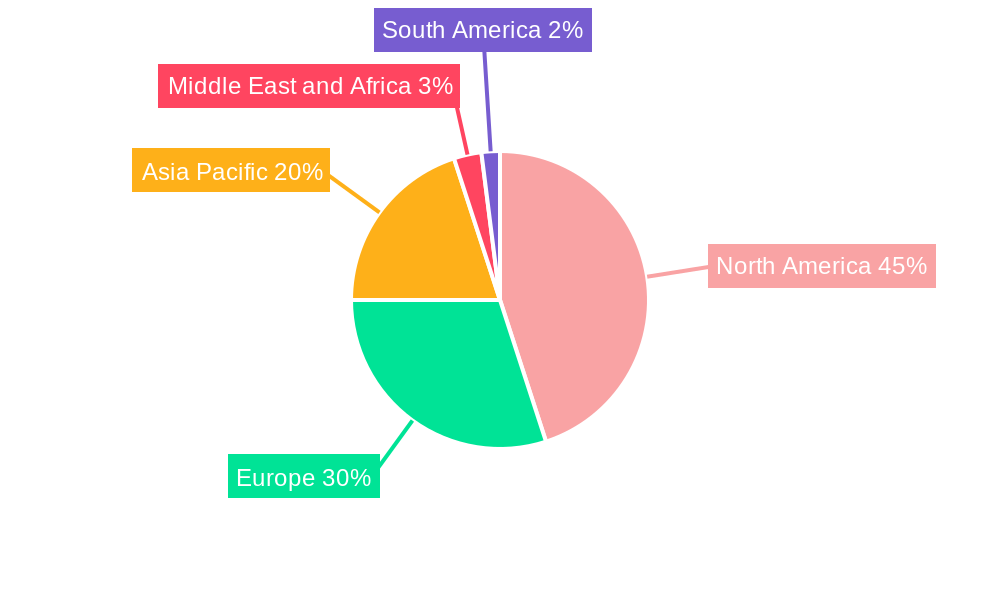
Geographical analysis reveals North America as the largest market, followed by Europe and Asia Pacific. However, rapidly developing economies in Asia-Pacific are poised to witness substantial growth in the coming years due to increasing healthcare infrastructure investment and rising disposable incomes. The market faces certain restraints, primarily the high initial investment cost associated with advanced display systems and the need for continuous technical upgrades to keep up with technological advancements. Regulatory hurdles in some regions also present challenges. However, the long-term outlook for the medical imaging displays market remains highly positive, driven by sustained demand for better diagnostic tools and technological advancements that address the aforementioned constraints. The market is expected to witness continuous expansion driven by ongoing technological progress, increasing healthcare expenditure, and a growing need for efficient and precise diagnostic tools.
Medical Imaging Displays Market Report: 2019-2033 Forecast
This comprehensive report provides an in-depth analysis of the Medical Imaging Displays industry, projecting a market value exceeding $XX Million by 2033. The study covers the period 2019-2033, with a base year of 2025 and a forecast period of 2025-2033. Key market segments, competitive dynamics, and future growth prospects are thoroughly examined, offering valuable insights for industry stakeholders. This report leverages high-impact keywords such as "medical imaging displays," "visualization software," "CT," "MRI," "ultrasound," and "market forecast" to optimize search engine visibility.
Medical Imaging Displays Industry Market Structure & Competitive Landscape
The Medical Imaging Displays market exhibits a moderately consolidated structure, with a few key players holding significant market share. The Herfindahl-Hirschman Index (HHI) for 2025 is estimated at xx, indicating a moderately competitive landscape. Innovation is a crucial driver, with companies continuously developing advanced visualization software, high-resolution display units, and integrated solutions. Regulatory compliance (e.g., FDA approvals for medical devices) significantly impacts market entry and product development. Substitute products, such as conventional film-based imaging, are largely obsolete due to technological advancements and cost-effectiveness of digital medical displays. The end-user segment primarily consists of hospitals, diagnostic centers, and research institutions. M&A activity in the past five years has been moderate, with an estimated xx Million in transaction value. Key acquisitions focused on expanding technological capabilities and geographic reach. Examples include strategic partnerships formed by companies like GE Healthcare and Siemens Healthineers to integrate software solutions and hardware, increasing overall market efficiency.
- Market Concentration: Moderately Consolidated (HHI: xx)
- Innovation Drivers: Advanced Visualization Software, High-Resolution Displays
- Regulatory Impacts: FDA approvals, compliance standards
- Product Substitutes: Minimal, largely replaced by digital technologies
- End-User Segmentation: Hospitals, diagnostic centers, research institutions
- M&A Activity (2019-2024): Estimated xx Million
Medical Imaging Displays Industry Market Trends & Opportunities
The Medical Imaging Displays market is experiencing robust growth, driven by technological advancements, increasing prevalence of chronic diseases, and rising demand for advanced diagnostic procedures. The market size is projected to reach $XX Million in 2025 and grow at a CAGR of xx% during the forecast period (2025-2033). Technological shifts toward AI-powered image analysis, 4K/8K resolution displays, and cloud-based image management systems are creating significant opportunities. Consumer preferences are shifting towards user-friendly interfaces, enhanced image quality, and integrated workflow solutions. Competitive dynamics are shaped by innovation, pricing strategies, and strategic partnerships. The market penetration rate of advanced visualization software is increasing rapidly, especially in developed countries, whereas emerging markets are showcasing a great adoption of base-level imaging technologies.
Dominant Markets & Segments in Medical Imaging Displays Industry
North America currently dominates the Medical Imaging Displays market, followed by Europe and Asia-Pacific. Within the segments:
- By Component: Display Units currently hold the largest market share, driven by high demand for high-resolution monitors and specialized display systems. Visualization Software is exhibiting the fastest growth rate.
- By Modality: Computed Tomography (CT) and Magnetic Resonance Imaging (MRI) account for a significant portion of the market due to their extensive use in various diagnostic applications. Ultrasound is a rapidly growing segment, driven by its portability and wide applicability.
- By Usage Mode: Thick client workstations are prevalent in established healthcare settings; however, the thin client workstation market is projected to grow rapidly due to enhanced network security and cost-effectiveness.
Key Growth Drivers:
- North America: High healthcare expenditure, advanced medical infrastructure, presence of major market players.
- Europe: Rising prevalence of chronic diseases, increasing adoption of advanced imaging techniques, favorable regulatory environment.
- Asia-Pacific: Growing healthcare investments, expanding medical infrastructure, increasing affordability of imaging technologies.
Medical Imaging Displays Industry Product Analysis
The Medical Imaging Displays market showcases continuous product innovation, driven by the need for improved image quality, enhanced diagnostic capabilities, and streamlined workflows. Advancements in display technologies, such as 4K and 8K resolution, offer superior image detail and clarity. The integration of AI algorithms into visualization software enables automated image analysis and improved diagnostic accuracy. These advanced products are strategically tailored to meet the specific requirements of various medical modalities and usage modes. Companies are focusing on integrated solutions that offer a seamless workflow by combining software and hardware resulting in a competitive edge.
Key Drivers, Barriers & Challenges in Medical Imaging Displays Industry
Key Drivers:
- Technological advancements (AI, 4K/8K displays)
- Rising prevalence of chronic diseases
- Increasing healthcare expenditure
- Government initiatives promoting healthcare infrastructure development.
Key Challenges:
- High initial investment costs for advanced systems
- Regulatory hurdles and compliance requirements (e.g., FDA, CE marking)
- Intense competition among established players
- Supply chain disruptions potentially leading to increased lead times and production delays. The impact of supply chain disruption is estimated to reduce market growth by approximately xx% in 2026.
Growth Drivers in the Medical Imaging Displays Industry Market
Technological advancements in display technology, increased adoption of advanced imaging modalities, and rising healthcare spending are key drivers. Government initiatives promoting healthcare infrastructure development also stimulate market expansion. The expanding geriatric population and increasing prevalence of chronic diseases further fuel demand.
Challenges Impacting Medical Imaging Displays Industry Growth
High initial costs of advanced systems, regulatory complexities, and intense competition pose challenges to market growth. Supply chain vulnerabilities and potential geopolitical instability also introduce uncertainties.
Key Players Shaping the Medical Imaging Displays Industry Market
- Chimaera GmbH
- Esaote SpA
- Siemens Healthineers
- Hologic Inc
- GE Healthcare
- Koninklijke Philips N V
- PaxeraHealth
- Carestream Health
- NGI Group
- Medicor Imaging
- Carl Zeiss AG
- Capsa Healthcare
Significant Medical Imaging Displays Industry Milestones
- 2020: FDA approval of AI-powered image analysis software by a major vendor.
- 2021: Launch of 8K resolution medical displays by several key players.
- 2022: Strategic partnership between two leading companies to develop integrated imaging solutions.
- 2023: Significant investments in R&D for advanced visualization technologies.
Future Outlook for Medical Imaging Displays Industry Market
The Medical Imaging Displays market is poised for sustained growth, driven by continued technological advancements, increasing demand for advanced imaging procedures, and expanding healthcare infrastructure globally. Strategic partnerships, product innovation, and expansion into emerging markets will further shape the industry's future trajectory. The market is expected to witness significant growth, with a projected market value exceeding $XX Million by 2033.
Medical Imaging Displays Industry Segmentation
-
1. Component
- 1.1. Visualization Software
- 1.2. Display Units
- 1.3. Others
-
2. Modality
- 2.1. Computed Tomography (CT)
- 2.2. Magnetic Resonance Imaging
- 2.3. Ultrasound
- 2.4. Mammography
- 2.5. Others
-
3. Usage Mode
- 3.1. Thick Client Workstation
- 3.2. Thin Client Workstation
Medical Imaging Displays Industry Segmentation By Geography
-
1. North America
- 1.1. United States
- 1.2. Canada
- 1.3. Mexico
-
2. Europe
- 2.1. Germany
- 2.2. United Kingdom
- 2.3. France
- 2.4. Italy
- 2.5. Spain
- 2.6. Rest of Europe
-
3. Asia Pacific
- 3.1. China
- 3.2. Japan
- 3.3. India
- 3.4. Australia
- 3.5. South Korea
- 3.6. Rest of Asia Pacific
-
4. Middle East and Africa
- 4.1. GCC
- 4.2. South Africa
- 4.3. Rest of Middle East and Africa
-
5. South America
- 5.1. Brazil
- 5.2. Argentina
- 5.3. Rest of South America
Medical Imaging Displays Industry REPORT HIGHLIGHTS
| Aspects | Details |
|---|---|
| Study Period | 2019-2033 |
| Base Year | 2024 |
| Estimated Year | 2025 |
| Forecast Period | 2025-2033 |
| Historical Period | 2019-2024 |
| Growth Rate | CAGR of 6.99% from 2019-2033 |
| Segmentation |
|
Table of Contents
- 1. Introduction
- 1.1. Research Scope
- 1.2. Market Segmentation
- 1.3. Research Methodology
- 1.4. Definitions and Assumptions
- 2. Executive Summary
- 2.1. Introduction
- 3. Market Dynamics
- 3.1. Introduction
- 3.2. Market Drivers
- 3.2.1. Technological Advancements in The Imaging Technologies and Use of Artificial Intelligence; Rising Healthcare Expenditure Coupled with Rising Disease Burden
- 3.3. Market Restrains
- 3.3.1. High Cost of Medical Imaging Equipment; Lack of Skilled Professionals
- 3.4. Market Trends
- 3.4.1. Ultrasound is Expected to Hold the Major Market Share in the Medical Imaging Workstation Market
- 4. Market Factor Analysis
- 4.1. Porters Five Forces
- 4.2. Supply/Value Chain
- 4.3. PESTEL analysis
- 4.4. Market Entropy
- 4.5. Patent/Trademark Analysis
- 5. Global Medical Imaging Displays Industry Analysis, Insights and Forecast, 2019-2031
- 5.1. Market Analysis, Insights and Forecast - by Component
- 5.1.1. Visualization Software
- 5.1.2. Display Units
- 5.1.3. Others
- 5.2. Market Analysis, Insights and Forecast - by Modality
- 5.2.1. Computed Tomography (CT)
- 5.2.2. Magnetic Resonance Imaging
- 5.2.3. Ultrasound
- 5.2.4. Mammography
- 5.2.5. Others
- 5.3. Market Analysis, Insights and Forecast - by Usage Mode
- 5.3.1. Thick Client Workstation
- 5.3.2. Thin Client Workstation
- 5.4. Market Analysis, Insights and Forecast - by Region
- 5.4.1. North America
- 5.4.2. Europe
- 5.4.3. Asia Pacific
- 5.4.4. Middle East and Africa
- 5.4.5. South America
- 5.1. Market Analysis, Insights and Forecast - by Component
- 6. North America Medical Imaging Displays Industry Analysis, Insights and Forecast, 2019-2031
- 6.1. Market Analysis, Insights and Forecast - by Component
- 6.1.1. Visualization Software
- 6.1.2. Display Units
- 6.1.3. Others
- 6.2. Market Analysis, Insights and Forecast - by Modality
- 6.2.1. Computed Tomography (CT)
- 6.2.2. Magnetic Resonance Imaging
- 6.2.3. Ultrasound
- 6.2.4. Mammography
- 6.2.5. Others
- 6.3. Market Analysis, Insights and Forecast - by Usage Mode
- 6.3.1. Thick Client Workstation
- 6.3.2. Thin Client Workstation
- 6.1. Market Analysis, Insights and Forecast - by Component
- 7. Europe Medical Imaging Displays Industry Analysis, Insights and Forecast, 2019-2031
- 7.1. Market Analysis, Insights and Forecast - by Component
- 7.1.1. Visualization Software
- 7.1.2. Display Units
- 7.1.3. Others
- 7.2. Market Analysis, Insights and Forecast - by Modality
- 7.2.1. Computed Tomography (CT)
- 7.2.2. Magnetic Resonance Imaging
- 7.2.3. Ultrasound
- 7.2.4. Mammography
- 7.2.5. Others
- 7.3. Market Analysis, Insights and Forecast - by Usage Mode
- 7.3.1. Thick Client Workstation
- 7.3.2. Thin Client Workstation
- 7.1. Market Analysis, Insights and Forecast - by Component
- 8. Asia Pacific Medical Imaging Displays Industry Analysis, Insights and Forecast, 2019-2031
- 8.1. Market Analysis, Insights and Forecast - by Component
- 8.1.1. Visualization Software
- 8.1.2. Display Units
- 8.1.3. Others
- 8.2. Market Analysis, Insights and Forecast - by Modality
- 8.2.1. Computed Tomography (CT)
- 8.2.2. Magnetic Resonance Imaging
- 8.2.3. Ultrasound
- 8.2.4. Mammography
- 8.2.5. Others
- 8.3. Market Analysis, Insights and Forecast - by Usage Mode
- 8.3.1. Thick Client Workstation
- 8.3.2. Thin Client Workstation
- 8.1. Market Analysis, Insights and Forecast - by Component
- 9. Middle East and Africa Medical Imaging Displays Industry Analysis, Insights and Forecast, 2019-2031
- 9.1. Market Analysis, Insights and Forecast - by Component
- 9.1.1. Visualization Software
- 9.1.2. Display Units
- 9.1.3. Others
- 9.2. Market Analysis, Insights and Forecast - by Modality
- 9.2.1. Computed Tomography (CT)
- 9.2.2. Magnetic Resonance Imaging
- 9.2.3. Ultrasound
- 9.2.4. Mammography
- 9.2.5. Others
- 9.3. Market Analysis, Insights and Forecast - by Usage Mode
- 9.3.1. Thick Client Workstation
- 9.3.2. Thin Client Workstation
- 9.1. Market Analysis, Insights and Forecast - by Component
- 10. South America Medical Imaging Displays Industry Analysis, Insights and Forecast, 2019-2031
- 10.1. Market Analysis, Insights and Forecast - by Component
- 10.1.1. Visualization Software
- 10.1.2. Display Units
- 10.1.3. Others
- 10.2. Market Analysis, Insights and Forecast - by Modality
- 10.2.1. Computed Tomography (CT)
- 10.2.2. Magnetic Resonance Imaging
- 10.2.3. Ultrasound
- 10.2.4. Mammography
- 10.2.5. Others
- 10.3. Market Analysis, Insights and Forecast - by Usage Mode
- 10.3.1. Thick Client Workstation
- 10.3.2. Thin Client Workstation
- 10.1. Market Analysis, Insights and Forecast - by Component
- 11. North America Medical Imaging Displays Industry Analysis, Insights and Forecast, 2019-2031
- 11.1. Market Analysis, Insights and Forecast - By Country/Sub-region
- 11.1.1 United States
- 11.1.2 Canada
- 11.1.3 Mexico
- 12. Europe Medical Imaging Displays Industry Analysis, Insights and Forecast, 2019-2031
- 12.1. Market Analysis, Insights and Forecast - By Country/Sub-region
- 12.1.1 Germany
- 12.1.2 United Kingdom
- 12.1.3 France
- 12.1.4 Italy
- 12.1.5 Spain
- 12.1.6 Rest of Europe
- 13. Asia Pacific Medical Imaging Displays Industry Analysis, Insights and Forecast, 2019-2031
- 13.1. Market Analysis, Insights and Forecast - By Country/Sub-region
- 13.1.1 China
- 13.1.2 Japan
- 13.1.3 India
- 13.1.4 Australia
- 13.1.5 South Korea
- 13.1.6 Rest of Asia Pacific
- 14. Middle East and Africa Medical Imaging Displays Industry Analysis, Insights and Forecast, 2019-2031
- 14.1. Market Analysis, Insights and Forecast - By Country/Sub-region
- 14.1.1 GCC
- 14.1.2 South Africa
- 14.1.3 Rest of Middle East and Africa
- 15. South America Medical Imaging Displays Industry Analysis, Insights and Forecast, 2019-2031
- 15.1. Market Analysis, Insights and Forecast - By Country/Sub-region
- 15.1.1 Brazil
- 15.1.2 Argentina
- 15.1.3 Rest of South America
- 16. Competitive Analysis
- 16.1. Global Market Share Analysis 2024
- 16.2. Company Profiles
- 16.2.1 Chimaera GmbH*List Not Exhaustive
- 16.2.1.1. Overview
- 16.2.1.2. Products
- 16.2.1.3. SWOT Analysis
- 16.2.1.4. Recent Developments
- 16.2.1.5. Financials (Based on Availability)
- 16.2.2 Esaote SpA
- 16.2.2.1. Overview
- 16.2.2.2. Products
- 16.2.2.3. SWOT Analysis
- 16.2.2.4. Recent Developments
- 16.2.2.5. Financials (Based on Availability)
- 16.2.3 Siemens Healthineers
- 16.2.3.1. Overview
- 16.2.3.2. Products
- 16.2.3.3. SWOT Analysis
- 16.2.3.4. Recent Developments
- 16.2.3.5. Financials (Based on Availability)
- 16.2.4 Hologic Inc
- 16.2.4.1. Overview
- 16.2.4.2. Products
- 16.2.4.3. SWOT Analysis
- 16.2.4.4. Recent Developments
- 16.2.4.5. Financials (Based on Availability)
- 16.2.5 GE Healthcare
- 16.2.5.1. Overview
- 16.2.5.2. Products
- 16.2.5.3. SWOT Analysis
- 16.2.5.4. Recent Developments
- 16.2.5.5. Financials (Based on Availability)
- 16.2.6 Koninklijke Philips N V
- 16.2.6.1. Overview
- 16.2.6.2. Products
- 16.2.6.3. SWOT Analysis
- 16.2.6.4. Recent Developments
- 16.2.6.5. Financials (Based on Availability)
- 16.2.7 PaxeraHealth
- 16.2.7.1. Overview
- 16.2.7.2. Products
- 16.2.7.3. SWOT Analysis
- 16.2.7.4. Recent Developments
- 16.2.7.5. Financials (Based on Availability)
- 16.2.8 Carestream Health
- 16.2.8.1. Overview
- 16.2.8.2. Products
- 16.2.8.3. SWOT Analysis
- 16.2.8.4. Recent Developments
- 16.2.8.5. Financials (Based on Availability)
- 16.2.9 NGI Group
- 16.2.9.1. Overview
- 16.2.9.2. Products
- 16.2.9.3. SWOT Analysis
- 16.2.9.4. Recent Developments
- 16.2.9.5. Financials (Based on Availability)
- 16.2.10 Medicor Imaging
- 16.2.10.1. Overview
- 16.2.10.2. Products
- 16.2.10.3. SWOT Analysis
- 16.2.10.4. Recent Developments
- 16.2.10.5. Financials (Based on Availability)
- 16.2.11 Carl Zeiss AG
- 16.2.11.1. Overview
- 16.2.11.2. Products
- 16.2.11.3. SWOT Analysis
- 16.2.11.4. Recent Developments
- 16.2.11.5. Financials (Based on Availability)
- 16.2.12 Capsa Healthcare
- 16.2.12.1. Overview
- 16.2.12.2. Products
- 16.2.12.3. SWOT Analysis
- 16.2.12.4. Recent Developments
- 16.2.12.5. Financials (Based on Availability)
- 16.2.1 Chimaera GmbH*List Not Exhaustive
List of Figures
- Figure 1: Global Medical Imaging Displays Industry Revenue Breakdown (Million, %) by Region 2024 & 2032
- Figure 2: North America Medical Imaging Displays Industry Revenue (Million), by Country 2024 & 2032
- Figure 3: North America Medical Imaging Displays Industry Revenue Share (%), by Country 2024 & 2032
- Figure 4: Europe Medical Imaging Displays Industry Revenue (Million), by Country 2024 & 2032
- Figure 5: Europe Medical Imaging Displays Industry Revenue Share (%), by Country 2024 & 2032
- Figure 6: Asia Pacific Medical Imaging Displays Industry Revenue (Million), by Country 2024 & 2032
- Figure 7: Asia Pacific Medical Imaging Displays Industry Revenue Share (%), by Country 2024 & 2032
- Figure 8: Middle East and Africa Medical Imaging Displays Industry Revenue (Million), by Country 2024 & 2032
- Figure 9: Middle East and Africa Medical Imaging Displays Industry Revenue Share (%), by Country 2024 & 2032
- Figure 10: South America Medical Imaging Displays Industry Revenue (Million), by Country 2024 & 2032
- Figure 11: South America Medical Imaging Displays Industry Revenue Share (%), by Country 2024 & 2032
- Figure 12: North America Medical Imaging Displays Industry Revenue (Million), by Component 2024 & 2032
- Figure 13: North America Medical Imaging Displays Industry Revenue Share (%), by Component 2024 & 2032
- Figure 14: North America Medical Imaging Displays Industry Revenue (Million), by Modality 2024 & 2032
- Figure 15: North America Medical Imaging Displays Industry Revenue Share (%), by Modality 2024 & 2032
- Figure 16: North America Medical Imaging Displays Industry Revenue (Million), by Usage Mode 2024 & 2032
- Figure 17: North America Medical Imaging Displays Industry Revenue Share (%), by Usage Mode 2024 & 2032
- Figure 18: North America Medical Imaging Displays Industry Revenue (Million), by Country 2024 & 2032
- Figure 19: North America Medical Imaging Displays Industry Revenue Share (%), by Country 2024 & 2032
- Figure 20: Europe Medical Imaging Displays Industry Revenue (Million), by Component 2024 & 2032
- Figure 21: Europe Medical Imaging Displays Industry Revenue Share (%), by Component 2024 & 2032
- Figure 22: Europe Medical Imaging Displays Industry Revenue (Million), by Modality 2024 & 2032
- Figure 23: Europe Medical Imaging Displays Industry Revenue Share (%), by Modality 2024 & 2032
- Figure 24: Europe Medical Imaging Displays Industry Revenue (Million), by Usage Mode 2024 & 2032
- Figure 25: Europe Medical Imaging Displays Industry Revenue Share (%), by Usage Mode 2024 & 2032
- Figure 26: Europe Medical Imaging Displays Industry Revenue (Million), by Country 2024 & 2032
- Figure 27: Europe Medical Imaging Displays Industry Revenue Share (%), by Country 2024 & 2032
- Figure 28: Asia Pacific Medical Imaging Displays Industry Revenue (Million), by Component 2024 & 2032
- Figure 29: Asia Pacific Medical Imaging Displays Industry Revenue Share (%), by Component 2024 & 2032
- Figure 30: Asia Pacific Medical Imaging Displays Industry Revenue (Million), by Modality 2024 & 2032
- Figure 31: Asia Pacific Medical Imaging Displays Industry Revenue Share (%), by Modality 2024 & 2032
- Figure 32: Asia Pacific Medical Imaging Displays Industry Revenue (Million), by Usage Mode 2024 & 2032
- Figure 33: Asia Pacific Medical Imaging Displays Industry Revenue Share (%), by Usage Mode 2024 & 2032
- Figure 34: Asia Pacific Medical Imaging Displays Industry Revenue (Million), by Country 2024 & 2032
- Figure 35: Asia Pacific Medical Imaging Displays Industry Revenue Share (%), by Country 2024 & 2032
- Figure 36: Middle East and Africa Medical Imaging Displays Industry Revenue (Million), by Component 2024 & 2032
- Figure 37: Middle East and Africa Medical Imaging Displays Industry Revenue Share (%), by Component 2024 & 2032
- Figure 38: Middle East and Africa Medical Imaging Displays Industry Revenue (Million), by Modality 2024 & 2032
- Figure 39: Middle East and Africa Medical Imaging Displays Industry Revenue Share (%), by Modality 2024 & 2032
- Figure 40: Middle East and Africa Medical Imaging Displays Industry Revenue (Million), by Usage Mode 2024 & 2032
- Figure 41: Middle East and Africa Medical Imaging Displays Industry Revenue Share (%), by Usage Mode 2024 & 2032
- Figure 42: Middle East and Africa Medical Imaging Displays Industry Revenue (Million), by Country 2024 & 2032
- Figure 43: Middle East and Africa Medical Imaging Displays Industry Revenue Share (%), by Country 2024 & 2032
- Figure 44: South America Medical Imaging Displays Industry Revenue (Million), by Component 2024 & 2032
- Figure 45: South America Medical Imaging Displays Industry Revenue Share (%), by Component 2024 & 2032
- Figure 46: South America Medical Imaging Displays Industry Revenue (Million), by Modality 2024 & 2032
- Figure 47: South America Medical Imaging Displays Industry Revenue Share (%), by Modality 2024 & 2032
- Figure 48: South America Medical Imaging Displays Industry Revenue (Million), by Usage Mode 2024 & 2032
- Figure 49: South America Medical Imaging Displays Industry Revenue Share (%), by Usage Mode 2024 & 2032
- Figure 50: South America Medical Imaging Displays Industry Revenue (Million), by Country 2024 & 2032
- Figure 51: South America Medical Imaging Displays Industry Revenue Share (%), by Country 2024 & 2032
List of Tables
- Table 1: Global Medical Imaging Displays Industry Revenue Million Forecast, by Region 2019 & 2032
- Table 2: Global Medical Imaging Displays Industry Revenue Million Forecast, by Component 2019 & 2032
- Table 3: Global Medical Imaging Displays Industry Revenue Million Forecast, by Modality 2019 & 2032
- Table 4: Global Medical Imaging Displays Industry Revenue Million Forecast, by Usage Mode 2019 & 2032
- Table 5: Global Medical Imaging Displays Industry Revenue Million Forecast, by Region 2019 & 2032
- Table 6: Global Medical Imaging Displays Industry Revenue Million Forecast, by Country 2019 & 2032
- Table 7: United States Medical Imaging Displays Industry Revenue (Million) Forecast, by Application 2019 & 2032
- Table 8: Canada Medical Imaging Displays Industry Revenue (Million) Forecast, by Application 2019 & 2032
- Table 9: Mexico Medical Imaging Displays Industry Revenue (Million) Forecast, by Application 2019 & 2032
- Table 10: Global Medical Imaging Displays Industry Revenue Million Forecast, by Country 2019 & 2032
- Table 11: Germany Medical Imaging Displays Industry Revenue (Million) Forecast, by Application 2019 & 2032
- Table 12: United Kingdom Medical Imaging Displays Industry Revenue (Million) Forecast, by Application 2019 & 2032
- Table 13: France Medical Imaging Displays Industry Revenue (Million) Forecast, by Application 2019 & 2032
- Table 14: Italy Medical Imaging Displays Industry Revenue (Million) Forecast, by Application 2019 & 2032
- Table 15: Spain Medical Imaging Displays Industry Revenue (Million) Forecast, by Application 2019 & 2032
- Table 16: Rest of Europe Medical Imaging Displays Industry Revenue (Million) Forecast, by Application 2019 & 2032
- Table 17: Global Medical Imaging Displays Industry Revenue Million Forecast, by Country 2019 & 2032
- Table 18: China Medical Imaging Displays Industry Revenue (Million) Forecast, by Application 2019 & 2032
- Table 19: Japan Medical Imaging Displays Industry Revenue (Million) Forecast, by Application 2019 & 2032
- Table 20: India Medical Imaging Displays Industry Revenue (Million) Forecast, by Application 2019 & 2032
- Table 21: Australia Medical Imaging Displays Industry Revenue (Million) Forecast, by Application 2019 & 2032
- Table 22: South Korea Medical Imaging Displays Industry Revenue (Million) Forecast, by Application 2019 & 2032
- Table 23: Rest of Asia Pacific Medical Imaging Displays Industry Revenue (Million) Forecast, by Application 2019 & 2032
- Table 24: Global Medical Imaging Displays Industry Revenue Million Forecast, by Country 2019 & 2032
- Table 25: GCC Medical Imaging Displays Industry Revenue (Million) Forecast, by Application 2019 & 2032
- Table 26: South Africa Medical Imaging Displays Industry Revenue (Million) Forecast, by Application 2019 & 2032
- Table 27: Rest of Middle East and Africa Medical Imaging Displays Industry Revenue (Million) Forecast, by Application 2019 & 2032
- Table 28: Global Medical Imaging Displays Industry Revenue Million Forecast, by Country 2019 & 2032
- Table 29: Brazil Medical Imaging Displays Industry Revenue (Million) Forecast, by Application 2019 & 2032
- Table 30: Argentina Medical Imaging Displays Industry Revenue (Million) Forecast, by Application 2019 & 2032
- Table 31: Rest of South America Medical Imaging Displays Industry Revenue (Million) Forecast, by Application 2019 & 2032
- Table 32: Global Medical Imaging Displays Industry Revenue Million Forecast, by Component 2019 & 2032
- Table 33: Global Medical Imaging Displays Industry Revenue Million Forecast, by Modality 2019 & 2032
- Table 34: Global Medical Imaging Displays Industry Revenue Million Forecast, by Usage Mode 2019 & 2032
- Table 35: Global Medical Imaging Displays Industry Revenue Million Forecast, by Country 2019 & 2032
- Table 36: United States Medical Imaging Displays Industry Revenue (Million) Forecast, by Application 2019 & 2032
- Table 37: Canada Medical Imaging Displays Industry Revenue (Million) Forecast, by Application 2019 & 2032
- Table 38: Mexico Medical Imaging Displays Industry Revenue (Million) Forecast, by Application 2019 & 2032
- Table 39: Global Medical Imaging Displays Industry Revenue Million Forecast, by Component 2019 & 2032
- Table 40: Global Medical Imaging Displays Industry Revenue Million Forecast, by Modality 2019 & 2032
- Table 41: Global Medical Imaging Displays Industry Revenue Million Forecast, by Usage Mode 2019 & 2032
- Table 42: Global Medical Imaging Displays Industry Revenue Million Forecast, by Country 2019 & 2032
- Table 43: Germany Medical Imaging Displays Industry Revenue (Million) Forecast, by Application 2019 & 2032
- Table 44: United Kingdom Medical Imaging Displays Industry Revenue (Million) Forecast, by Application 2019 & 2032
- Table 45: France Medical Imaging Displays Industry Revenue (Million) Forecast, by Application 2019 & 2032
- Table 46: Italy Medical Imaging Displays Industry Revenue (Million) Forecast, by Application 2019 & 2032
- Table 47: Spain Medical Imaging Displays Industry Revenue (Million) Forecast, by Application 2019 & 2032
- Table 48: Rest of Europe Medical Imaging Displays Industry Revenue (Million) Forecast, by Application 2019 & 2032
- Table 49: Global Medical Imaging Displays Industry Revenue Million Forecast, by Component 2019 & 2032
- Table 50: Global Medical Imaging Displays Industry Revenue Million Forecast, by Modality 2019 & 2032
- Table 51: Global Medical Imaging Displays Industry Revenue Million Forecast, by Usage Mode 2019 & 2032
- Table 52: Global Medical Imaging Displays Industry Revenue Million Forecast, by Country 2019 & 2032
- Table 53: China Medical Imaging Displays Industry Revenue (Million) Forecast, by Application 2019 & 2032
- Table 54: Japan Medical Imaging Displays Industry Revenue (Million) Forecast, by Application 2019 & 2032
- Table 55: India Medical Imaging Displays Industry Revenue (Million) Forecast, by Application 2019 & 2032
- Table 56: Australia Medical Imaging Displays Industry Revenue (Million) Forecast, by Application 2019 & 2032
- Table 57: South Korea Medical Imaging Displays Industry Revenue (Million) Forecast, by Application 2019 & 2032
- Table 58: Rest of Asia Pacific Medical Imaging Displays Industry Revenue (Million) Forecast, by Application 2019 & 2032
- Table 59: Global Medical Imaging Displays Industry Revenue Million Forecast, by Component 2019 & 2032
- Table 60: Global Medical Imaging Displays Industry Revenue Million Forecast, by Modality 2019 & 2032
- Table 61: Global Medical Imaging Displays Industry Revenue Million Forecast, by Usage Mode 2019 & 2032
- Table 62: Global Medical Imaging Displays Industry Revenue Million Forecast, by Country 2019 & 2032
- Table 63: GCC Medical Imaging Displays Industry Revenue (Million) Forecast, by Application 2019 & 2032
- Table 64: South Africa Medical Imaging Displays Industry Revenue (Million) Forecast, by Application 2019 & 2032
- Table 65: Rest of Middle East and Africa Medical Imaging Displays Industry Revenue (Million) Forecast, by Application 2019 & 2032
- Table 66: Global Medical Imaging Displays Industry Revenue Million Forecast, by Component 2019 & 2032
- Table 67: Global Medical Imaging Displays Industry Revenue Million Forecast, by Modality 2019 & 2032
- Table 68: Global Medical Imaging Displays Industry Revenue Million Forecast, by Usage Mode 2019 & 2032
- Table 69: Global Medical Imaging Displays Industry Revenue Million Forecast, by Country 2019 & 2032
- Table 70: Brazil Medical Imaging Displays Industry Revenue (Million) Forecast, by Application 2019 & 2032
- Table 71: Argentina Medical Imaging Displays Industry Revenue (Million) Forecast, by Application 2019 & 2032
- Table 72: Rest of South America Medical Imaging Displays Industry Revenue (Million) Forecast, by Application 2019 & 2032
Frequently Asked Questions
1. What is the projected Compound Annual Growth Rate (CAGR) of the Medical Imaging Displays Industry?
The projected CAGR is approximately 6.99%.
2. Which companies are prominent players in the Medical Imaging Displays Industry?
Key companies in the market include Chimaera GmbH*List Not Exhaustive, Esaote SpA, Siemens Healthineers, Hologic Inc, GE Healthcare, Koninklijke Philips N V, PaxeraHealth, Carestream Health, NGI Group, Medicor Imaging, Carl Zeiss AG, Capsa Healthcare.
3. What are the main segments of the Medical Imaging Displays Industry?
The market segments include Component, Modality, Usage Mode.
4. Can you provide details about the market size?
The market size is estimated to be USD 6.21 Million as of 2022.
5. What are some drivers contributing to market growth?
Technological Advancements in The Imaging Technologies and Use of Artificial Intelligence; Rising Healthcare Expenditure Coupled with Rising Disease Burden.
6. What are the notable trends driving market growth?
Ultrasound is Expected to Hold the Major Market Share in the Medical Imaging Workstation Market.
7. Are there any restraints impacting market growth?
High Cost of Medical Imaging Equipment; Lack of Skilled Professionals.
8. Can you provide examples of recent developments in the market?
N/A
9. What pricing options are available for accessing the report?
Pricing options include single-user, multi-user, and enterprise licenses priced at USD 4750, USD 5250, and USD 8750 respectively.
10. Is the market size provided in terms of value or volume?
The market size is provided in terms of value, measured in Million.
11. Are there any specific market keywords associated with the report?
Yes, the market keyword associated with the report is "Medical Imaging Displays Industry," which aids in identifying and referencing the specific market segment covered.
12. How do I determine which pricing option suits my needs best?
The pricing options vary based on user requirements and access needs. Individual users may opt for single-user licenses, while businesses requiring broader access may choose multi-user or enterprise licenses for cost-effective access to the report.
13. Are there any additional resources or data provided in the Medical Imaging Displays Industry report?
While the report offers comprehensive insights, it's advisable to review the specific contents or supplementary materials provided to ascertain if additional resources or data are available.
14. How can I stay updated on further developments or reports in the Medical Imaging Displays Industry?
To stay informed about further developments, trends, and reports in the Medical Imaging Displays Industry, consider subscribing to industry newsletters, following relevant companies and organizations, or regularly checking reputable industry news sources and publications.
Methodology
Step 1 - Identification of Relevant Samples Size from Population Database


Step 2 - Approaches for Defining Global Market Size (Value, Volume* & Price*)

Note*: In applicable scenarios
Step 3 - Data Sources
Primary Research
- Web Analytics
- Survey Reports
- Research Institute
- Latest Research Reports
- Opinion Leaders
Secondary Research
- Annual Reports
- White Paper
- Latest Press Release
- Industry Association
- Paid Database
- Investor Presentations

Step 4 - Data Triangulation
Involves using different sources of information in order to increase the validity of a study
These sources are likely to be stakeholders in a program - participants, other researchers, program staff, other community members, and so on.
Then we put all data in single framework & apply various statistical tools to find out the dynamic on the market.
During the analysis stage, feedback from the stakeholder groups would be compared to determine areas of agreement as well as areas of divergence
