

Key Insights
The microRNA (miRNA) sequencing and assay market is experiencing robust growth, driven by the increasing understanding of miRNA's role in various diseases and its potential as a diagnostic and therapeutic target. The market's expansion is fueled by advancements in sequencing technologies, such as next-generation sequencing (NGS), which offer higher throughput and lower costs, making miRNA profiling more accessible. The rising adoption of personalized medicine further boosts demand, as miRNA expression profiles can help tailor treatment strategies for individual patients. Key market segments include sequencing consumables, library preparation kits, and services. Technological advancements, particularly in nanopore sequencing, are enabling faster and more cost-effective miRNA analysis. The clinical laboratory segment is a major driver, with applications in cancer diagnostics, cardiovascular disease research, and infectious disease monitoring. While the market faces challenges such as the complexity of miRNA analysis and the need for standardized protocols, the overall growth trajectory remains positive, driven by continuous innovation and increasing research funding in the field.
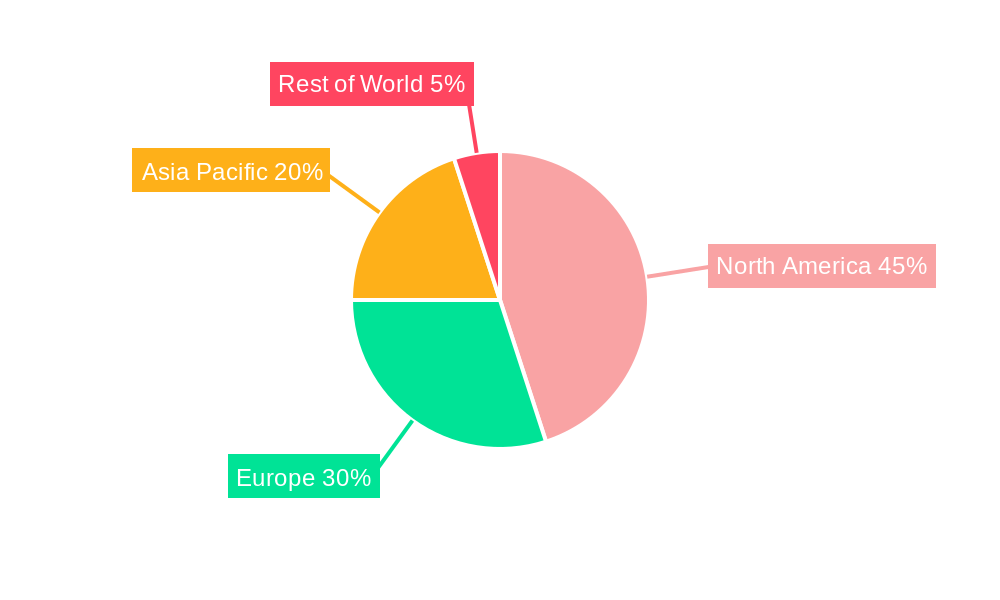
The market is segmented by product (sequencing consumables and library preparation kits), technology (Sequencing by Synthesis, Ion Semiconductor, SOLiD, Nanopore Sequencing), and end-user (clinical laboratories, life science organizations, and others). North America currently holds a significant market share due to the presence of major players and advanced healthcare infrastructure. However, the Asia-Pacific region is projected to experience the fastest growth rate, fueled by increasing investments in research and development and rising healthcare expenditure. The competitive landscape is characterized by the presence of both established players like Illumina, Thermo Fisher Scientific, and Qiagen, and smaller specialized companies focusing on specific technologies or applications. This competitive environment fosters innovation and drives down costs, further accelerating market growth. The forecast period (2025-2033) anticipates continued expansion driven by the aforementioned factors, with a projected CAGR consistent with the overall genomics market trends.
MiRNA Sequencing and Assay Industry: A Comprehensive Market Report (2019-2033)
This dynamic report provides a comprehensive analysis of the MiRNA Sequencing and Assay industry, projecting robust growth and significant market transformation from 2025 to 2033. The study period covers 2019-2033, with 2025 serving as the base and estimated year. The report leverages extensive market research, incorporating both quantitative and qualitative data to offer actionable insights for industry stakeholders. The global market is projected to reach xx Million by 2033, exhibiting a robust CAGR of xx% during the forecast period (2025-2033).
MiRNA Sequencing and Assay Industry Market Structure & Competitive Landscape
The MiRNA Sequencing and Assay market is characterized by a moderately concentrated landscape with several key players holding significant market share. The Herfindahl-Hirschman Index (HHI) is estimated at xx, indicating a moderately concentrated market. Innovation is a primary driver, fueled by advancements in sequencing technologies and a growing understanding of miRNA's role in various diseases. Regulatory approvals and stringent quality control measures influence market dynamics. Product substitutes, including other molecular diagnostics techniques, pose a level of competitive pressure. The market is segmented by product (Sequencing Consumables, Library Preparation Kits), technology (Sequencing by Synthesis, Ion Semiconductor, SOLiD, Nanopore Sequencing), and end-user (Clinical Laboratory, Life Science Organization, Other End-Users). M&A activity in the sector has been moderate in recent years, with xx major mergers and acquisitions recorded between 2019 and 2024, representing a total value of approximately xx Million. This activity is expected to increase as companies look to expand their product portfolios and market reach.
- Market Concentration: Moderately Concentrated (HHI: xx)
- Innovation Drivers: Technological Advancements, Growing Understanding of miRNA's Role in Disease
- Regulatory Impacts: Stringent Quality Control Measures, Approval Processes
- Product Substitutes: Other Molecular Diagnostics Techniques
- End-User Segmentation: Clinical Laboratories, Life Science Organizations, Other End-Users
- M&A Trends: Moderate Activity (xx transactions, xx Million in value between 2019-2024)
MiRNA Sequencing and Assay Industry Market Trends & Opportunities
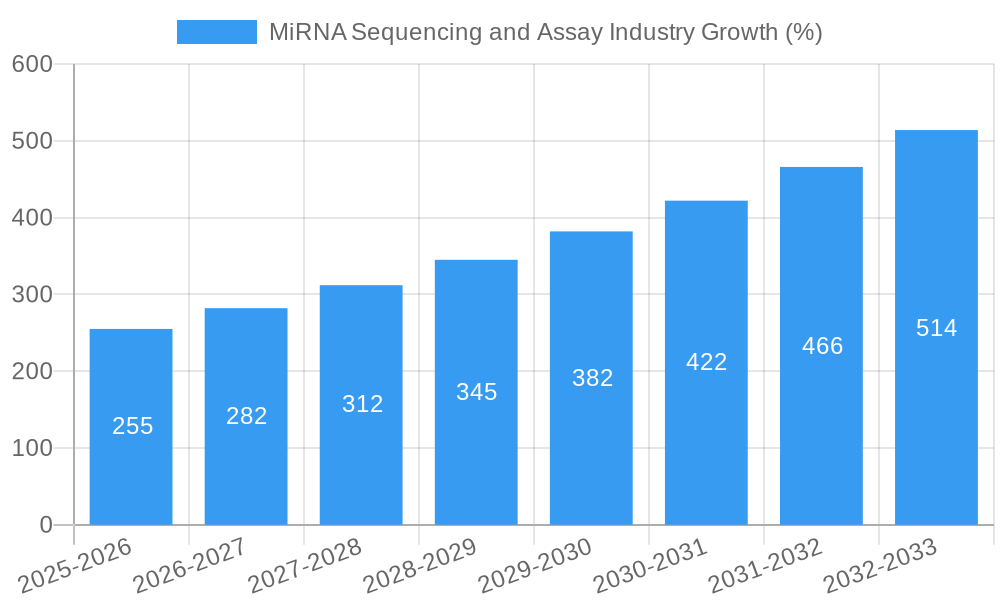
The MiRNA Sequencing and Assay market is experiencing significant growth, driven by several factors. The market size has grown from xx Million in 2019 to xx Million in 2024, and is projected to reach xx Million by 2033. This expansion is fueled by technological advancements such as next-generation sequencing (NGS) platforms that offer increased throughput, higher accuracy, and reduced costs. The increasing adoption of personalized medicine and the growing demand for early disease diagnosis are further bolstering market growth. The market is seeing increased penetration of NGS technologies, coupled with a rising preference for cost-effective, high-throughput miRNA analysis solutions in clinical settings. Furthermore, strategic collaborations and partnerships amongst key players are influencing competitive dynamics. The overall market shows a significant potential for growth due to the rising prevalence of chronic diseases, expanding research activities in miRNA-based therapeutics, and increasing demand for accurate and rapid diagnostics.
Dominant Markets & Segments in MiRNA Sequencing and Assay Industry
North America currently dominates the MiRNA Sequencing and Assay market, driven by factors such as robust healthcare infrastructure, high adoption rates of advanced diagnostic technologies, and strong government support for research and development. Within this market, the clinical laboratory end-user segment represents a significant share, with high demand for miRNA assays in cancer diagnosis, cardiovascular disease diagnostics, and other therapeutic areas. Within the product category, library preparation kits demonstrate higher demand due to their crucial role in efficient and accurate miRNA sequencing.
- Leading Region: North America
- Key Growth Drivers (North America):
- Robust Healthcare Infrastructure
- High Adoption of Advanced Technologies
- Strong Government Support for R&D
- High Prevalence of Chronic Diseases
- Dominant Segment (Product): Library Preparation Kits
- Dominant Segment (End-User): Clinical Laboratories
MiRNA Sequencing and Assay Industry Product Analysis
Significant advancements in sequencing technologies are driving innovation in the MiRNA Sequencing and Assay market. New products emphasize higher sensitivity, specificity, and throughput to enhance diagnostic accuracy and efficiency. The integration of advanced data analysis tools enables more sophisticated biomarker discovery and clinical applications. The competitive landscape is defined by the ability of companies to offer comprehensive solutions, including sample preparation, sequencing, and data analysis. This trend drives the increasing demand for integrated library preparation kits and user-friendly data analysis software, offering a significant competitive edge.
Key Drivers, Barriers & Challenges in MiRNA Sequencing and Assay Industry
Key Drivers: Technological advancements like NGS, increasing research in miRNA-based therapeutics, growing demand for early diagnosis, and supportive government policies and funding propel market growth. The rising prevalence of chronic diseases and cancer further fuels this market expansion.
Key Challenges: High initial investment costs for NGS platforms, complex regulatory hurdles for assay approvals, and supply chain disruptions caused by manufacturing constraints impact the market growth. Intense competition among established players also creates market challenges.
Growth Drivers in the MiRNA Sequencing and Assay Industry Market
Technological advancements in next-generation sequencing (NGS) technology, coupled with the increasing understanding of miRNA's role in various diseases, are driving market growth. Government support for research and development in genomics and personalized medicine also contributes significantly. The growing demand for rapid and accurate diagnostics in clinical settings, along with the rising prevalence of chronic diseases, further fuels market expansion.
Challenges Impacting MiRNA Sequencing and Assay Industry Growth
Regulatory complexities surrounding the approval of new assays and high initial investment costs associated with NGS platforms pose significant challenges. Supply chain disruptions in the production of reagents and consumables can also limit market growth. Furthermore, intense competition among established players, and the emergence of new technologies, create pressure on profit margins.
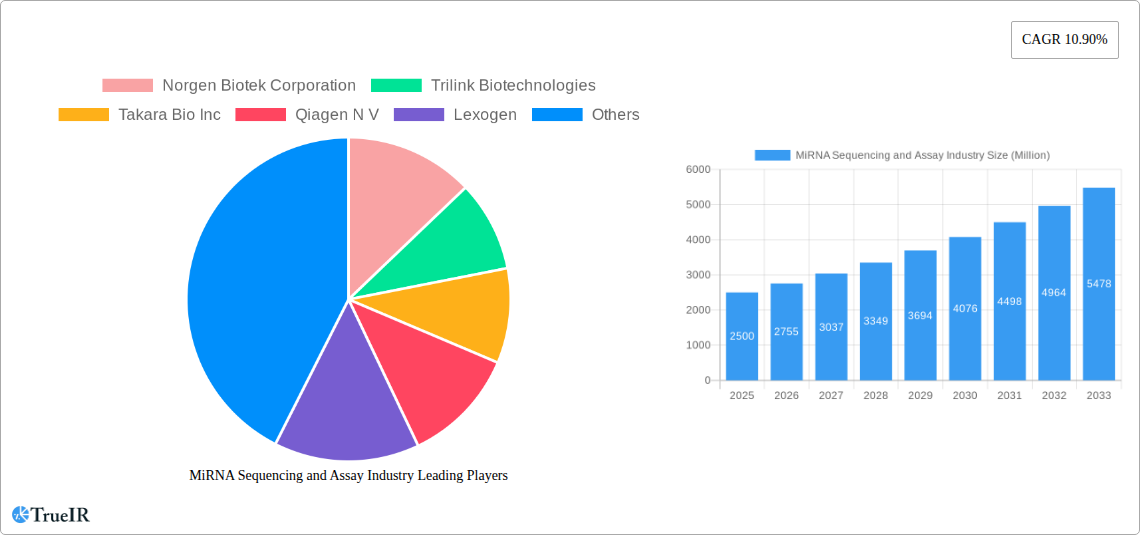
Key Players Shaping the MiRNA Sequencing and Assay Industry Market
- Norgen Biotek Corporation
- Trilink Biotechnologies
- Takara Bio Inc
- Qiagen N V
- Lexogen
- Oxford Nanopore Technologies
- New England Biolabs Inc
- PerkinElmer Inc
- Illumina Inc
- Thermo Fisher Scientific
Significant MiRNA Sequencing and Assay Industry Milestones
April 2022: HTC Molecular Diagnostics Inc. unveiled new features of its proprietary HTG EdgeSeq technology, improving miRNA and mRNA profiling. This innovation streamlines sample preparation, enhancing workflow efficiency and reducing costs.
January 2022: Allogene Therapeutics' collaboration with Antion Biosciences utilizing miRNA technology (miCAR) for next-generation allogeneic CAR T therapies showcases the growing role of miRNA in advanced therapies. This strategic partnership signals the expanding applications and market potential for miRNA-based solutions.
Future Outlook for MiRNA Sequencing and Assay Industry Market
The MiRNA Sequencing and Assay market is poised for continued growth, driven by ongoing technological advancements, increasing demand for personalized medicine, and the expansion of research activities in miRNA-based therapeutics. Strategic partnerships and collaborations will further accelerate market expansion. The development of more affordable and user-friendly platforms will significantly broaden market accessibility, opening up significant opportunities for growth across various healthcare and research sectors.
MiRNA Sequencing and Assay Industry Segmentation
-
1. Product
- 1.1. Sequencing Consumables
- 1.2. Library Preparation Kits
-
2. Technology
- 2.1. Sequencing by Synthesis
- 2.2. Ion Semiconductor
- 2.3. SOLiD
- 2.4. Nanopore Sequencing
-
3. End User
- 3.1. Clinical Laboratory
- 3.2. Life Science Organization
- 3.3. Other End Users
MiRNA Sequencing and Assay Industry Segmentation By Geography
-
1. North America
- 1.1. United States
- 1.2. Canada
- 1.3. Mexico
-
2. Europe
- 2.1. Germany
- 2.2. United Kingdom
- 2.3. France
- 2.4. Italy
- 2.5. Spain
- 2.6. Rest of Europe
-
3. Asia Pacific
- 3.1. China
- 3.2. Japan
- 3.3. India
- 3.4. Australia
- 3.5. South Korea
- 3.6. Rest of Asia Pacific
-
4. Middle East and Africa
- 4.1. GCC
- 4.2. South Africa
- 4.3. Rest of Middle East and Africa
-
5. South America
- 5.1. Brazil
- 5.2. Argentina
- 5.3. Rest of South America
MiRNA Sequencing and Assay Industry REPORT HIGHLIGHTS
| Aspects | Details |
|---|---|
| Study Period | 2019-2033 |
| Base Year | 2024 |
| Estimated Year | 2025 |
| Forecast Period | 2025-2033 |
| Historical Period | 2019-2024 |
| Growth Rate | CAGR of 10.90% from 2019-2033 |
| Segmentation |
|
Table of Contents
- 1. Introduction
- 1.1. Research Scope
- 1.2. Market Segmentation
- 1.3. Research Methodology
- 1.4. Definitions and Assumptions
- 2. Executive Summary
- 2.1. Introduction
- 3. Market Dynamics
- 3.1. Introduction
- 3.2. Market Drivers
- 3.2.1. MiRNA Sequencing and Assay Sequencing Supremacy Over Other Methods; Increased Research in the Field of Genomics; Reduced Sequencing Costs
- 3.3. Market Restrains
- 3.3.1. Paucity of Expert and Need for Computing Infrastructure
- 3.4. Market Trends
- 3.4.1. Library Preparation Kits are Expected to Hold the Largest Market Share in the miRNA Sequencing and Assay Market
- 4. Market Factor Analysis
- 4.1. Porters Five Forces
- 4.2. Supply/Value Chain
- 4.3. PESTEL analysis
- 4.4. Market Entropy
- 4.5. Patent/Trademark Analysis
- 5. Global MiRNA Sequencing and Assay Industry Analysis, Insights and Forecast, 2019-2031
- 5.1. Market Analysis, Insights and Forecast - by Product
- 5.1.1. Sequencing Consumables
- 5.1.2. Library Preparation Kits
- 5.2. Market Analysis, Insights and Forecast - by Technology
- 5.2.1. Sequencing by Synthesis
- 5.2.2. Ion Semiconductor
- 5.2.3. SOLiD
- 5.2.4. Nanopore Sequencing
- 5.3. Market Analysis, Insights and Forecast - by End User
- 5.3.1. Clinical Laboratory
- 5.3.2. Life Science Organization
- 5.3.3. Other End Users
- 5.4. Market Analysis, Insights and Forecast - by Region
- 5.4.1. North America
- 5.4.2. Europe
- 5.4.3. Asia Pacific
- 5.4.4. Middle East and Africa
- 5.4.5. South America
- 5.1. Market Analysis, Insights and Forecast - by Product
- 6. North America MiRNA Sequencing and Assay Industry Analysis, Insights and Forecast, 2019-2031
- 6.1. Market Analysis, Insights and Forecast - by Product
- 6.1.1. Sequencing Consumables
- 6.1.2. Library Preparation Kits
- 6.2. Market Analysis, Insights and Forecast - by Technology
- 6.2.1. Sequencing by Synthesis
- 6.2.2. Ion Semiconductor
- 6.2.3. SOLiD
- 6.2.4. Nanopore Sequencing
- 6.3. Market Analysis, Insights and Forecast - by End User
- 6.3.1. Clinical Laboratory
- 6.3.2. Life Science Organization
- 6.3.3. Other End Users
- 6.1. Market Analysis, Insights and Forecast - by Product
- 7. Europe MiRNA Sequencing and Assay Industry Analysis, Insights and Forecast, 2019-2031
- 7.1. Market Analysis, Insights and Forecast - by Product
- 7.1.1. Sequencing Consumables
- 7.1.2. Library Preparation Kits
- 7.2. Market Analysis, Insights and Forecast - by Technology
- 7.2.1. Sequencing by Synthesis
- 7.2.2. Ion Semiconductor
- 7.2.3. SOLiD
- 7.2.4. Nanopore Sequencing
- 7.3. Market Analysis, Insights and Forecast - by End User
- 7.3.1. Clinical Laboratory
- 7.3.2. Life Science Organization
- 7.3.3. Other End Users
- 7.1. Market Analysis, Insights and Forecast - by Product
- 8. Asia Pacific MiRNA Sequencing and Assay Industry Analysis, Insights and Forecast, 2019-2031
- 8.1. Market Analysis, Insights and Forecast - by Product
- 8.1.1. Sequencing Consumables
- 8.1.2. Library Preparation Kits
- 8.2. Market Analysis, Insights and Forecast - by Technology
- 8.2.1. Sequencing by Synthesis
- 8.2.2. Ion Semiconductor
- 8.2.3. SOLiD
- 8.2.4. Nanopore Sequencing
- 8.3. Market Analysis, Insights and Forecast - by End User
- 8.3.1. Clinical Laboratory
- 8.3.2. Life Science Organization
- 8.3.3. Other End Users
- 8.1. Market Analysis, Insights and Forecast - by Product
- 9. Middle East and Africa MiRNA Sequencing and Assay Industry Analysis, Insights and Forecast, 2019-2031
- 9.1. Market Analysis, Insights and Forecast - by Product
- 9.1.1. Sequencing Consumables
- 9.1.2. Library Preparation Kits
- 9.2. Market Analysis, Insights and Forecast - by Technology
- 9.2.1. Sequencing by Synthesis
- 9.2.2. Ion Semiconductor
- 9.2.3. SOLiD
- 9.2.4. Nanopore Sequencing
- 9.3. Market Analysis, Insights and Forecast - by End User
- 9.3.1. Clinical Laboratory
- 9.3.2. Life Science Organization
- 9.3.3. Other End Users
- 9.1. Market Analysis, Insights and Forecast - by Product
- 10. South America MiRNA Sequencing and Assay Industry Analysis, Insights and Forecast, 2019-2031
- 10.1. Market Analysis, Insights and Forecast - by Product
- 10.1.1. Sequencing Consumables
- 10.1.2. Library Preparation Kits
- 10.2. Market Analysis, Insights and Forecast - by Technology
- 10.2.1. Sequencing by Synthesis
- 10.2.2. Ion Semiconductor
- 10.2.3. SOLiD
- 10.2.4. Nanopore Sequencing
- 10.3. Market Analysis, Insights and Forecast - by End User
- 10.3.1. Clinical Laboratory
- 10.3.2. Life Science Organization
- 10.3.3. Other End Users
- 10.1. Market Analysis, Insights and Forecast - by Product
- 11. North America MiRNA Sequencing and Assay Industry Analysis, Insights and Forecast, 2019-2031
- 11.1. Market Analysis, Insights and Forecast - By Country/Sub-region
- 11.1.1 United States
- 11.1.2 Canada
- 11.1.3 Mexico
- 12. Europe MiRNA Sequencing and Assay Industry Analysis, Insights and Forecast, 2019-2031
- 12.1. Market Analysis, Insights and Forecast - By Country/Sub-region
- 12.1.1 Germany
- 12.1.2 United Kingdom
- 12.1.3 France
- 12.1.4 Italy
- 12.1.5 Spain
- 12.1.6 Rest of Europe
- 13. Asia Pacific MiRNA Sequencing and Assay Industry Analysis, Insights and Forecast, 2019-2031
- 13.1. Market Analysis, Insights and Forecast - By Country/Sub-region
- 13.1.1 China
- 13.1.2 Japan
- 13.1.3 India
- 13.1.4 Australia
- 13.1.5 South Korea
- 13.1.6 Rest of Asia Pacific
- 14. Middle East and Africa MiRNA Sequencing and Assay Industry Analysis, Insights and Forecast, 2019-2031
- 14.1. Market Analysis, Insights and Forecast - By Country/Sub-region
- 14.1.1 GCC
- 14.1.2 South Africa
- 14.1.3 Rest of Middle East and Africa
- 15. South America MiRNA Sequencing and Assay Industry Analysis, Insights and Forecast, 2019-2031
- 15.1. Market Analysis, Insights and Forecast - By Country/Sub-region
- 15.1.1 Brazil
- 15.1.2 Argentina
- 15.1.3 Rest of South America
- 16. Competitive Analysis
- 16.1. Global Market Share Analysis 2024
- 16.2. Company Profiles
- 16.2.1 Norgen Biotek Corporation
- 16.2.1.1. Overview
- 16.2.1.2. Products
- 16.2.1.3. SWOT Analysis
- 16.2.1.4. Recent Developments
- 16.2.1.5. Financials (Based on Availability)
- 16.2.2 Trilink Biotechnologies
- 16.2.2.1. Overview
- 16.2.2.2. Products
- 16.2.2.3. SWOT Analysis
- 16.2.2.4. Recent Developments
- 16.2.2.5. Financials (Based on Availability)
- 16.2.3 Takara Bio Inc
- 16.2.3.1. Overview
- 16.2.3.2. Products
- 16.2.3.3. SWOT Analysis
- 16.2.3.4. Recent Developments
- 16.2.3.5. Financials (Based on Availability)
- 16.2.4 Qiagen N V
- 16.2.4.1. Overview
- 16.2.4.2. Products
- 16.2.4.3. SWOT Analysis
- 16.2.4.4. Recent Developments
- 16.2.4.5. Financials (Based on Availability)
- 16.2.5 Lexogen
- 16.2.5.1. Overview
- 16.2.5.2. Products
- 16.2.5.3. SWOT Analysis
- 16.2.5.4. Recent Developments
- 16.2.5.5. Financials (Based on Availability)
- 16.2.6 Oxford Nanopore Technologies*List Not Exhaustive
- 16.2.6.1. Overview
- 16.2.6.2. Products
- 16.2.6.3. SWOT Analysis
- 16.2.6.4. Recent Developments
- 16.2.6.5. Financials (Based on Availability)
- 16.2.7 New England Biolabs Inc
- 16.2.7.1. Overview
- 16.2.7.2. Products
- 16.2.7.3. SWOT Analysis
- 16.2.7.4. Recent Developments
- 16.2.7.5. Financials (Based on Availability)
- 16.2.8 PerkinElmer Inc
- 16.2.8.1. Overview
- 16.2.8.2. Products
- 16.2.8.3. SWOT Analysis
- 16.2.8.4. Recent Developments
- 16.2.8.5. Financials (Based on Availability)
- 16.2.9 Illumina Inc
- 16.2.9.1. Overview
- 16.2.9.2. Products
- 16.2.9.3. SWOT Analysis
- 16.2.9.4. Recent Developments
- 16.2.9.5. Financials (Based on Availability)
- 16.2.10 Thermo Fisher Scientific
- 16.2.10.1. Overview
- 16.2.10.2. Products
- 16.2.10.3. SWOT Analysis
- 16.2.10.4. Recent Developments
- 16.2.10.5. Financials (Based on Availability)
- 16.2.1 Norgen Biotek Corporation
List of Figures
- Figure 1: Global MiRNA Sequencing and Assay Industry Revenue Breakdown (Million, %) by Region 2024 & 2032
- Figure 2: North America MiRNA Sequencing and Assay Industry Revenue (Million), by Country 2024 & 2032
- Figure 3: North America MiRNA Sequencing and Assay Industry Revenue Share (%), by Country 2024 & 2032
- Figure 4: Europe MiRNA Sequencing and Assay Industry Revenue (Million), by Country 2024 & 2032
- Figure 5: Europe MiRNA Sequencing and Assay Industry Revenue Share (%), by Country 2024 & 2032
- Figure 6: Asia Pacific MiRNA Sequencing and Assay Industry Revenue (Million), by Country 2024 & 2032
- Figure 7: Asia Pacific MiRNA Sequencing and Assay Industry Revenue Share (%), by Country 2024 & 2032
- Figure 8: Middle East and Africa MiRNA Sequencing and Assay Industry Revenue (Million), by Country 2024 & 2032
- Figure 9: Middle East and Africa MiRNA Sequencing and Assay Industry Revenue Share (%), by Country 2024 & 2032
- Figure 10: South America MiRNA Sequencing and Assay Industry Revenue (Million), by Country 2024 & 2032
- Figure 11: South America MiRNA Sequencing and Assay Industry Revenue Share (%), by Country 2024 & 2032
- Figure 12: North America MiRNA Sequencing and Assay Industry Revenue (Million), by Product 2024 & 2032
- Figure 13: North America MiRNA Sequencing and Assay Industry Revenue Share (%), by Product 2024 & 2032
- Figure 14: North America MiRNA Sequencing and Assay Industry Revenue (Million), by Technology 2024 & 2032
- Figure 15: North America MiRNA Sequencing and Assay Industry Revenue Share (%), by Technology 2024 & 2032
- Figure 16: North America MiRNA Sequencing and Assay Industry Revenue (Million), by End User 2024 & 2032
- Figure 17: North America MiRNA Sequencing and Assay Industry Revenue Share (%), by End User 2024 & 2032
- Figure 18: North America MiRNA Sequencing and Assay Industry Revenue (Million), by Country 2024 & 2032
- Figure 19: North America MiRNA Sequencing and Assay Industry Revenue Share (%), by Country 2024 & 2032
- Figure 20: Europe MiRNA Sequencing and Assay Industry Revenue (Million), by Product 2024 & 2032
- Figure 21: Europe MiRNA Sequencing and Assay Industry Revenue Share (%), by Product 2024 & 2032
- Figure 22: Europe MiRNA Sequencing and Assay Industry Revenue (Million), by Technology 2024 & 2032
- Figure 23: Europe MiRNA Sequencing and Assay Industry Revenue Share (%), by Technology 2024 & 2032
- Figure 24: Europe MiRNA Sequencing and Assay Industry Revenue (Million), by End User 2024 & 2032
- Figure 25: Europe MiRNA Sequencing and Assay Industry Revenue Share (%), by End User 2024 & 2032
- Figure 26: Europe MiRNA Sequencing and Assay Industry Revenue (Million), by Country 2024 & 2032
- Figure 27: Europe MiRNA Sequencing and Assay Industry Revenue Share (%), by Country 2024 & 2032
- Figure 28: Asia Pacific MiRNA Sequencing and Assay Industry Revenue (Million), by Product 2024 & 2032
- Figure 29: Asia Pacific MiRNA Sequencing and Assay Industry Revenue Share (%), by Product 2024 & 2032
- Figure 30: Asia Pacific MiRNA Sequencing and Assay Industry Revenue (Million), by Technology 2024 & 2032
- Figure 31: Asia Pacific MiRNA Sequencing and Assay Industry Revenue Share (%), by Technology 2024 & 2032
- Figure 32: Asia Pacific MiRNA Sequencing and Assay Industry Revenue (Million), by End User 2024 & 2032
- Figure 33: Asia Pacific MiRNA Sequencing and Assay Industry Revenue Share (%), by End User 2024 & 2032
- Figure 34: Asia Pacific MiRNA Sequencing and Assay Industry Revenue (Million), by Country 2024 & 2032
- Figure 35: Asia Pacific MiRNA Sequencing and Assay Industry Revenue Share (%), by Country 2024 & 2032
- Figure 36: Middle East and Africa MiRNA Sequencing and Assay Industry Revenue (Million), by Product 2024 & 2032
- Figure 37: Middle East and Africa MiRNA Sequencing and Assay Industry Revenue Share (%), by Product 2024 & 2032
- Figure 38: Middle East and Africa MiRNA Sequencing and Assay Industry Revenue (Million), by Technology 2024 & 2032
- Figure 39: Middle East and Africa MiRNA Sequencing and Assay Industry Revenue Share (%), by Technology 2024 & 2032
- Figure 40: Middle East and Africa MiRNA Sequencing and Assay Industry Revenue (Million), by End User 2024 & 2032
- Figure 41: Middle East and Africa MiRNA Sequencing and Assay Industry Revenue Share (%), by End User 2024 & 2032
- Figure 42: Middle East and Africa MiRNA Sequencing and Assay Industry Revenue (Million), by Country 2024 & 2032
- Figure 43: Middle East and Africa MiRNA Sequencing and Assay Industry Revenue Share (%), by Country 2024 & 2032
- Figure 44: South America MiRNA Sequencing and Assay Industry Revenue (Million), by Product 2024 & 2032
- Figure 45: South America MiRNA Sequencing and Assay Industry Revenue Share (%), by Product 2024 & 2032
- Figure 46: South America MiRNA Sequencing and Assay Industry Revenue (Million), by Technology 2024 & 2032
- Figure 47: South America MiRNA Sequencing and Assay Industry Revenue Share (%), by Technology 2024 & 2032
- Figure 48: South America MiRNA Sequencing and Assay Industry Revenue (Million), by End User 2024 & 2032
- Figure 49: South America MiRNA Sequencing and Assay Industry Revenue Share (%), by End User 2024 & 2032
- Figure 50: South America MiRNA Sequencing and Assay Industry Revenue (Million), by Country 2024 & 2032
- Figure 51: South America MiRNA Sequencing and Assay Industry Revenue Share (%), by Country 2024 & 2032
List of Tables
- Table 1: Global MiRNA Sequencing and Assay Industry Revenue Million Forecast, by Region 2019 & 2032
- Table 2: Global MiRNA Sequencing and Assay Industry Revenue Million Forecast, by Product 2019 & 2032
- Table 3: Global MiRNA Sequencing and Assay Industry Revenue Million Forecast, by Technology 2019 & 2032
- Table 4: Global MiRNA Sequencing and Assay Industry Revenue Million Forecast, by End User 2019 & 2032
- Table 5: Global MiRNA Sequencing and Assay Industry Revenue Million Forecast, by Region 2019 & 2032
- Table 6: Global MiRNA Sequencing and Assay Industry Revenue Million Forecast, by Country 2019 & 2032
- Table 7: United States MiRNA Sequencing and Assay Industry Revenue (Million) Forecast, by Application 2019 & 2032
- Table 8: Canada MiRNA Sequencing and Assay Industry Revenue (Million) Forecast, by Application 2019 & 2032
- Table 9: Mexico MiRNA Sequencing and Assay Industry Revenue (Million) Forecast, by Application 2019 & 2032
- Table 10: Global MiRNA Sequencing and Assay Industry Revenue Million Forecast, by Country 2019 & 2032
- Table 11: Germany MiRNA Sequencing and Assay Industry Revenue (Million) Forecast, by Application 2019 & 2032
- Table 12: United Kingdom MiRNA Sequencing and Assay Industry Revenue (Million) Forecast, by Application 2019 & 2032
- Table 13: France MiRNA Sequencing and Assay Industry Revenue (Million) Forecast, by Application 2019 & 2032
- Table 14: Italy MiRNA Sequencing and Assay Industry Revenue (Million) Forecast, by Application 2019 & 2032
- Table 15: Spain MiRNA Sequencing and Assay Industry Revenue (Million) Forecast, by Application 2019 & 2032
- Table 16: Rest of Europe MiRNA Sequencing and Assay Industry Revenue (Million) Forecast, by Application 2019 & 2032
- Table 17: Global MiRNA Sequencing and Assay Industry Revenue Million Forecast, by Country 2019 & 2032
- Table 18: China MiRNA Sequencing and Assay Industry Revenue (Million) Forecast, by Application 2019 & 2032
- Table 19: Japan MiRNA Sequencing and Assay Industry Revenue (Million) Forecast, by Application 2019 & 2032
- Table 20: India MiRNA Sequencing and Assay Industry Revenue (Million) Forecast, by Application 2019 & 2032
- Table 21: Australia MiRNA Sequencing and Assay Industry Revenue (Million) Forecast, by Application 2019 & 2032
- Table 22: South Korea MiRNA Sequencing and Assay Industry Revenue (Million) Forecast, by Application 2019 & 2032
- Table 23: Rest of Asia Pacific MiRNA Sequencing and Assay Industry Revenue (Million) Forecast, by Application 2019 & 2032
- Table 24: Global MiRNA Sequencing and Assay Industry Revenue Million Forecast, by Country 2019 & 2032
- Table 25: GCC MiRNA Sequencing and Assay Industry Revenue (Million) Forecast, by Application 2019 & 2032
- Table 26: South Africa MiRNA Sequencing and Assay Industry Revenue (Million) Forecast, by Application 2019 & 2032
- Table 27: Rest of Middle East and Africa MiRNA Sequencing and Assay Industry Revenue (Million) Forecast, by Application 2019 & 2032
- Table 28: Global MiRNA Sequencing and Assay Industry Revenue Million Forecast, by Country 2019 & 2032
- Table 29: Brazil MiRNA Sequencing and Assay Industry Revenue (Million) Forecast, by Application 2019 & 2032
- Table 30: Argentina MiRNA Sequencing and Assay Industry Revenue (Million) Forecast, by Application 2019 & 2032
- Table 31: Rest of South America MiRNA Sequencing and Assay Industry Revenue (Million) Forecast, by Application 2019 & 2032
- Table 32: Global MiRNA Sequencing and Assay Industry Revenue Million Forecast, by Product 2019 & 2032
- Table 33: Global MiRNA Sequencing and Assay Industry Revenue Million Forecast, by Technology 2019 & 2032
- Table 34: Global MiRNA Sequencing and Assay Industry Revenue Million Forecast, by End User 2019 & 2032
- Table 35: Global MiRNA Sequencing and Assay Industry Revenue Million Forecast, by Country 2019 & 2032
- Table 36: United States MiRNA Sequencing and Assay Industry Revenue (Million) Forecast, by Application 2019 & 2032
- Table 37: Canada MiRNA Sequencing and Assay Industry Revenue (Million) Forecast, by Application 2019 & 2032
- Table 38: Mexico MiRNA Sequencing and Assay Industry Revenue (Million) Forecast, by Application 2019 & 2032
- Table 39: Global MiRNA Sequencing and Assay Industry Revenue Million Forecast, by Product 2019 & 2032
- Table 40: Global MiRNA Sequencing and Assay Industry Revenue Million Forecast, by Technology 2019 & 2032
- Table 41: Global MiRNA Sequencing and Assay Industry Revenue Million Forecast, by End User 2019 & 2032
- Table 42: Global MiRNA Sequencing and Assay Industry Revenue Million Forecast, by Country 2019 & 2032
- Table 43: Germany MiRNA Sequencing and Assay Industry Revenue (Million) Forecast, by Application 2019 & 2032
- Table 44: United Kingdom MiRNA Sequencing and Assay Industry Revenue (Million) Forecast, by Application 2019 & 2032
- Table 45: France MiRNA Sequencing and Assay Industry Revenue (Million) Forecast, by Application 2019 & 2032
- Table 46: Italy MiRNA Sequencing and Assay Industry Revenue (Million) Forecast, by Application 2019 & 2032
- Table 47: Spain MiRNA Sequencing and Assay Industry Revenue (Million) Forecast, by Application 2019 & 2032
- Table 48: Rest of Europe MiRNA Sequencing and Assay Industry Revenue (Million) Forecast, by Application 2019 & 2032
- Table 49: Global MiRNA Sequencing and Assay Industry Revenue Million Forecast, by Product 2019 & 2032
- Table 50: Global MiRNA Sequencing and Assay Industry Revenue Million Forecast, by Technology 2019 & 2032
- Table 51: Global MiRNA Sequencing and Assay Industry Revenue Million Forecast, by End User 2019 & 2032
- Table 52: Global MiRNA Sequencing and Assay Industry Revenue Million Forecast, by Country 2019 & 2032
- Table 53: China MiRNA Sequencing and Assay Industry Revenue (Million) Forecast, by Application 2019 & 2032
- Table 54: Japan MiRNA Sequencing and Assay Industry Revenue (Million) Forecast, by Application 2019 & 2032
- Table 55: India MiRNA Sequencing and Assay Industry Revenue (Million) Forecast, by Application 2019 & 2032
- Table 56: Australia MiRNA Sequencing and Assay Industry Revenue (Million) Forecast, by Application 2019 & 2032
- Table 57: South Korea MiRNA Sequencing and Assay Industry Revenue (Million) Forecast, by Application 2019 & 2032
- Table 58: Rest of Asia Pacific MiRNA Sequencing and Assay Industry Revenue (Million) Forecast, by Application 2019 & 2032
- Table 59: Global MiRNA Sequencing and Assay Industry Revenue Million Forecast, by Product 2019 & 2032
- Table 60: Global MiRNA Sequencing and Assay Industry Revenue Million Forecast, by Technology 2019 & 2032
- Table 61: Global MiRNA Sequencing and Assay Industry Revenue Million Forecast, by End User 2019 & 2032
- Table 62: Global MiRNA Sequencing and Assay Industry Revenue Million Forecast, by Country 2019 & 2032
- Table 63: GCC MiRNA Sequencing and Assay Industry Revenue (Million) Forecast, by Application 2019 & 2032
- Table 64: South Africa MiRNA Sequencing and Assay Industry Revenue (Million) Forecast, by Application 2019 & 2032
- Table 65: Rest of Middle East and Africa MiRNA Sequencing and Assay Industry Revenue (Million) Forecast, by Application 2019 & 2032
- Table 66: Global MiRNA Sequencing and Assay Industry Revenue Million Forecast, by Product 2019 & 2032
- Table 67: Global MiRNA Sequencing and Assay Industry Revenue Million Forecast, by Technology 2019 & 2032
- Table 68: Global MiRNA Sequencing and Assay Industry Revenue Million Forecast, by End User 2019 & 2032
- Table 69: Global MiRNA Sequencing and Assay Industry Revenue Million Forecast, by Country 2019 & 2032
- Table 70: Brazil MiRNA Sequencing and Assay Industry Revenue (Million) Forecast, by Application 2019 & 2032
- Table 71: Argentina MiRNA Sequencing and Assay Industry Revenue (Million) Forecast, by Application 2019 & 2032
- Table 72: Rest of South America MiRNA Sequencing and Assay Industry Revenue (Million) Forecast, by Application 2019 & 2032
Frequently Asked Questions
1. What is the projected Compound Annual Growth Rate (CAGR) of the MiRNA Sequencing and Assay Industry?
The projected CAGR is approximately 10.90%.
2. Which companies are prominent players in the MiRNA Sequencing and Assay Industry?
Key companies in the market include Norgen Biotek Corporation, Trilink Biotechnologies, Takara Bio Inc, Qiagen N V, Lexogen, Oxford Nanopore Technologies*List Not Exhaustive, New England Biolabs Inc, PerkinElmer Inc, Illumina Inc, Thermo Fisher Scientific.
3. What are the main segments of the MiRNA Sequencing and Assay Industry?
The market segments include Product, Technology, End User.
4. Can you provide details about the market size?
The market size is estimated to be USD XX Million as of 2022.
5. What are some drivers contributing to market growth?
MiRNA Sequencing and Assay Sequencing Supremacy Over Other Methods; Increased Research in the Field of Genomics; Reduced Sequencing Costs.
6. What are the notable trends driving market growth?
Library Preparation Kits are Expected to Hold the Largest Market Share in the miRNA Sequencing and Assay Market.
7. Are there any restraints impacting market growth?
Paucity of Expert and Need for Computing Infrastructure.
8. Can you provide examples of recent developments in the market?
April 2022: HTC Molecular Diagnostics Inc. unveiled new features of its proprietary HTG EdgeSeq technology. The company has improved its technology, and now its new sample preparation harmonization enables miRNA and mRNA profiling without the need for additional samples.
9. What pricing options are available for accessing the report?
Pricing options include single-user, multi-user, and enterprise licenses priced at USD 4750, USD 5250, and USD 8750 respectively.
10. Is the market size provided in terms of value or volume?
The market size is provided in terms of value, measured in Million.
11. Are there any specific market keywords associated with the report?
Yes, the market keyword associated with the report is "MiRNA Sequencing and Assay Industry," which aids in identifying and referencing the specific market segment covered.
12. How do I determine which pricing option suits my needs best?
The pricing options vary based on user requirements and access needs. Individual users may opt for single-user licenses, while businesses requiring broader access may choose multi-user or enterprise licenses for cost-effective access to the report.
13. Are there any additional resources or data provided in the MiRNA Sequencing and Assay Industry report?
While the report offers comprehensive insights, it's advisable to review the specific contents or supplementary materials provided to ascertain if additional resources or data are available.
14. How can I stay updated on further developments or reports in the MiRNA Sequencing and Assay Industry?
To stay informed about further developments, trends, and reports in the MiRNA Sequencing and Assay Industry, consider subscribing to industry newsletters, following relevant companies and organizations, or regularly checking reputable industry news sources and publications.
Methodology
Step 1 - Identification of Relevant Samples Size from Population Database


Step 2 - Approaches for Defining Global Market Size (Value, Volume* & Price*)

Note*: In applicable scenarios
Step 3 - Data Sources
Primary Research
- Web Analytics
- Survey Reports
- Research Institute
- Latest Research Reports
- Opinion Leaders
Secondary Research
- Annual Reports
- White Paper
- Latest Press Release
- Industry Association
- Paid Database
- Investor Presentations

Step 4 - Data Triangulation
Involves using different sources of information in order to increase the validity of a study
These sources are likely to be stakeholders in a program - participants, other researchers, program staff, other community members, and so on.
Then we put all data in single framework & apply various statistical tools to find out the dynamic on the market.
During the analysis stage, feedback from the stakeholder groups would be compared to determine areas of agreement as well as areas of divergence
