

Key Insights
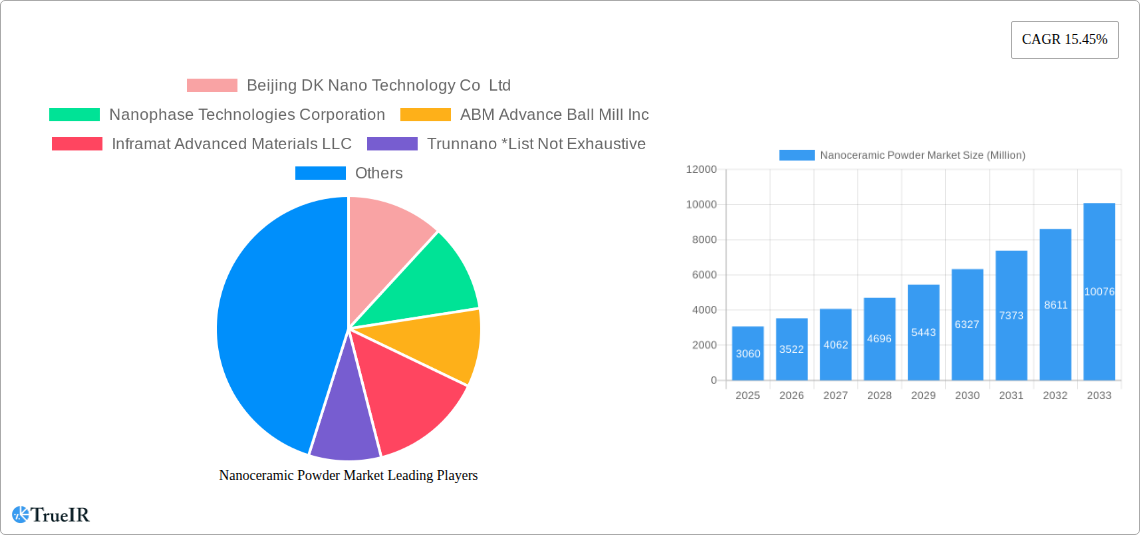
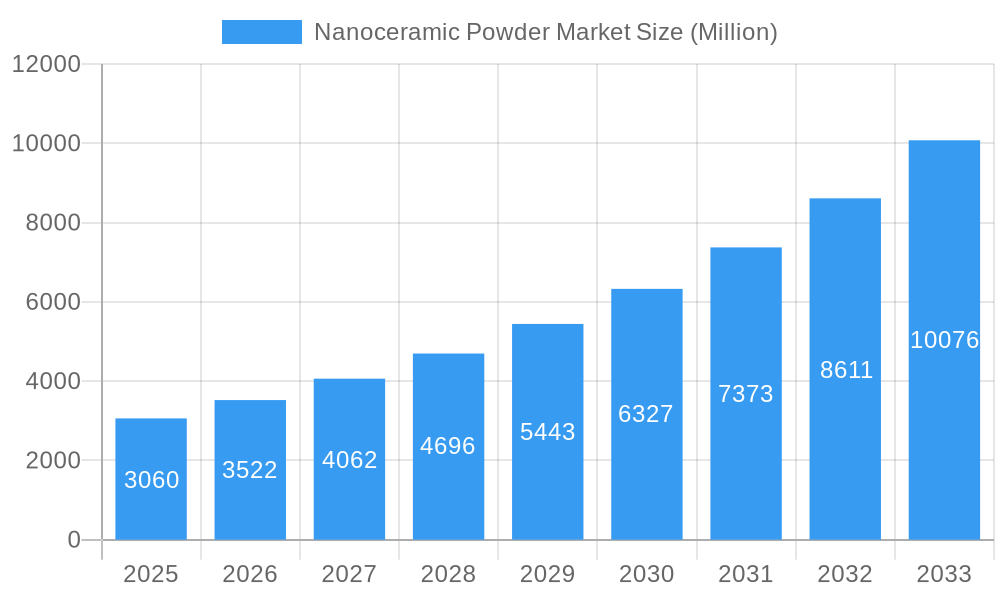
The nanoceramic powder market is experiencing robust growth, projected to reach a market size of $3.06 billion in 2025 and maintain a Compound Annual Growth Rate (CAGR) of 15.45% from 2025 to 2033. This expansion is driven by increasing demand across diverse end-user industries, particularly in the electrical and electronics, industrial, and transportation sectors. Advancements in materials science and nanotechnology are enabling the development of high-performance nanoceramic powders with enhanced properties like superior strength, thermal conductivity, and electrical insulation, fueling adoption in applications requiring advanced materials. The rising adoption of electric vehicles (EVs) is a significant driver, as nanoceramic powders are crucial components in EV batteries and other related technologies. Furthermore, the growing focus on miniaturization and lightweighting in various industries contributes to the market's growth trajectory. Competitive pressures among manufacturers are also promoting innovation and cost reductions, making nanoceramic powders more accessible across a wider range of applications.
Nanoceramic Powder Market Market Size (In Billion)
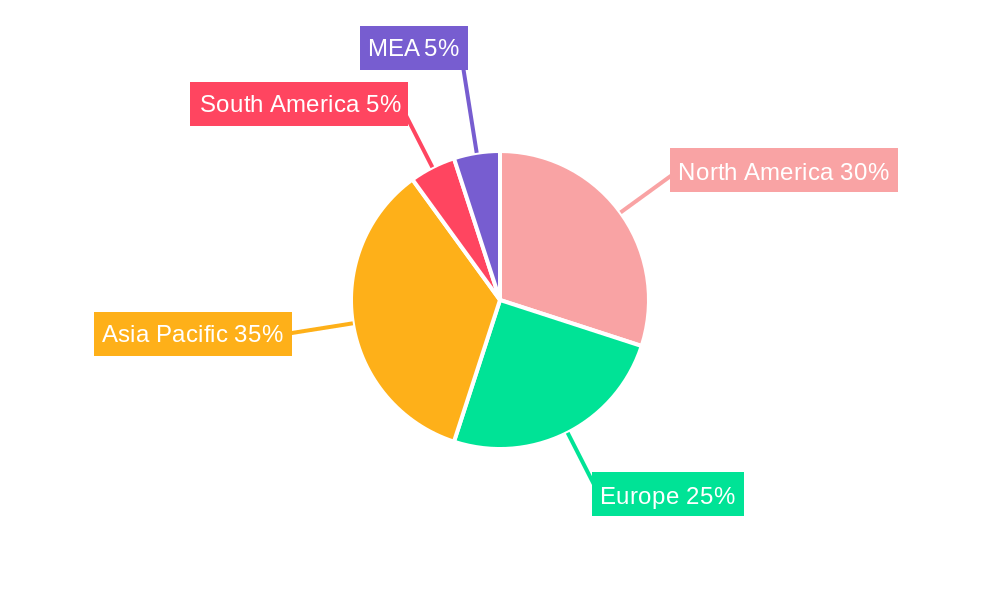
The market is segmented by type (oxide, carbide, nitride, boron, and others) and end-user industry (electrical and electronics, industrial, transportation, medical, chemical, defense, and others). The oxide powder segment currently holds the largest market share due to its wide range of applications and established manufacturing processes. However, the carbide and nitride powder segments are expected to experience significant growth driven by their superior mechanical properties and increasing demand in high-performance applications. Regionally, Asia Pacific, particularly China and Japan, is a major market due to significant manufacturing activities and substantial investments in research and development. North America and Europe follow closely, driven by strong technological advancements and increased adoption across various industries. However, emerging economies in South America and the Middle East and Africa are anticipated to witness substantial growth in the coming years, providing lucrative opportunities for market participants.
Nanoceramic Powder Market Company Market Share
Nanoceramic Powder Market: A Comprehensive Report (2019-2033)
This dynamic report provides a thorough analysis of the global Nanoceramic Powder market, offering invaluable insights for industry stakeholders, investors, and researchers. Leveraging extensive data from the historical period (2019-2024), base year (2025), and estimated year (2025), the report projects market trends and opportunities through 2033. The market is expected to reach xx Million by 2033, exhibiting a CAGR of xx% during the forecast period (2025-2033).
Nanoceramic Powder Market Market Structure & Competitive Landscape
The nanoceramic powder market is characterized by a moderately concentrated structure, with several key players holding significant market share. The Herfindahl-Hirschman Index (HHI) for 2024 is estimated at xx, indicating a moderately concentrated market. Innovation is a primary driver, with companies continuously developing advanced nanoceramic powders with enhanced properties. Stringent regulatory frameworks regarding material safety and environmental impact pose a significant challenge, influencing product development and market entry. The presence of substitute materials, such as traditional ceramics, presents competitive pressure. End-user segmentation is diverse, with applications spanning various sectors. M&A activity in the last five years has been moderate, with xx major acquisitions recorded, primarily focused on expanding product portfolios and geographical reach.
- Key Players: Beijing DK Nano Technology Co Ltd, Nanophase Technologies Corporation, ABM Advance Ball Mill Inc, Inframat Advanced Materials LLC, Trunnano, Tosoh Corporation, Cerion LLC, NYACOL Nano Technologies Inc, Innovnano-materiais Avancados SA (List Not Exhaustive).
- Market Concentration: Moderately concentrated, HHI (2024): xx
- M&A Activity (2019-2024): xx major acquisitions.
- Innovation Drivers: Enhanced material properties, new applications.
- Regulatory Impacts: Stringent safety and environmental regulations.
- Product Substitutes: Traditional ceramics.
Nanoceramic Powder Market Market Trends & Opportunities
The global nanoceramic powder market is experiencing significant growth, driven by increasing demand across diverse end-user industries. Technological advancements, such as improved synthesis techniques and surface modification methods, are enhancing the properties of nanoceramic powders, leading to wider adoption. Consumer preference for high-performance materials is further fueling market growth. Intense competition among manufacturers is promoting innovation and cost reduction. The market penetration rate in the electrical and electronics sector is estimated at xx% in 2025, expected to rise to xx% by 2033. The increasing adoption of nanoceramic powders in high-technology applications, like advanced electronics and energy storage devices, presents significant growth opportunities. Furthermore, government initiatives promoting the development and use of advanced materials are creating a favorable environment for market expansion. The market size is projected to reach xx Million by 2033, with a CAGR of xx%. Emerging applications in areas such as biomedical devices and sustainable energy technologies are poised to drive substantial growth in the coming years.
Dominant Markets & Segments in Nanoceramic Powder Market
The Asia-Pacific region dominates the global nanoceramic powder market, fueled by rapid industrialization and robust infrastructure development. China and Japan are the leading countries within this region. Within the type segment, Oxide Powder currently holds the largest market share, driven by its wide range of applications across various industries. The Electrical and Electronics sector is the leading end-user industry for nanoceramic powders, driven by the expanding electronics and semiconductor industries.
- Leading Region: Asia-Pacific (China and Japan)
- Dominant Type: Oxide Powder
- Major End-User Industry: Electrical and Electronics
Key Growth Drivers:
- Asia-Pacific: Rapid industrialization, infrastructure development, government support for advanced materials.
- Oxide Powder: Versatility, wide applications across industries.
- Electrical & Electronics: Expansion of electronics & semiconductor sectors, demand for high-performance materials.
Nanoceramic Powder Market Product Analysis
Nanoceramic powder innovation focuses on enhancing properties like strength, durability, and thermal conductivity. New synthesis methods are improving particle size control and reducing defects, leading to superior performance. These advancements cater to a growing demand for higher-performance materials in various applications, offering manufacturers a clear competitive advantage. Specific examples include the development of high-purity powders for advanced electronics and specialized coatings for enhanced durability in harsh environments.
Key Drivers, Barriers & Challenges in Nanoceramic Powder Market
Key Drivers:
- Growing demand from electronics, transportation, and energy sectors.
- Technological advancements in synthesis and processing.
- Government support for advanced materials research and development.
Challenges:
- High production costs and complex synthesis processes.
- Stringent environmental regulations and safety concerns.
- Competition from substitute materials and potential supply chain disruptions. The impact of potential supply chain disruptions is estimated to reduce market growth by xx% in the next five years.
Growth Drivers in the Nanoceramic Powder Market Market
The market is propelled by escalating demand across various sectors, particularly electronics and transportation. Technological breakthroughs in synthesis techniques are continuously enhancing the quality and functionality of nanoceramic powders. Government policies promoting the adoption of advanced materials further accelerate growth.
Challenges Impacting Nanoceramic Powder Market Growth
Significant challenges include high production costs, intricate manufacturing processes, and stringent environmental regulations impacting profitability and market penetration. Intense competition among producers and the availability of alternative materials present additional obstacles.
Key Players Shaping the Nanoceramic Powder Market Market
- Beijing DK Nano Technology Co Ltd
- Nanophase Technologies Corporation
- ABM Advance Ball Mill Inc
- Inframat Advanced Materials LLC
- Trunnano
- Tosoh Corporation
- Cerion LLC
- NYACOL Nano Technologies Inc
- Innovnano-materiais Avancados SA
Significant Nanoceramic Powder Market Industry Milestones
- 2020, Q4: Nanophase Technologies Corporation launches a new line of high-purity zirconia nanoceramic powders.
- 2021, Q2: Beijing DK Nano Technology Co Ltd secures a significant contract for the supply of nanoceramic powders to a major electronics manufacturer.
- 2022, Q3: Merger between two smaller nanoceramic powder producers expands market share.
- 2023, Q1: Introduction of a novel synthesis method resulting in improved particle size control and reduced production costs.
Future Outlook for Nanoceramic Powder Market Market
The nanoceramic powder market is poised for substantial growth, driven by ongoing technological advancements, increasing demand from diverse applications, and supportive government policies. Strategic opportunities exist in developing novel nanoceramic powders with enhanced properties and expanding into emerging markets. The market’s future success hinges on addressing the challenges of high production costs, complex synthesis methods, and stringent regulations.
Nanoceramic Powder Market Segmentation
-
1. Type
- 1.1. Oxide Powder
- 1.2. Carbide Powder
- 1.3. Nitride Powder
- 1.4. Boron Powder
- 1.5. Other Types
-
2. End-user Industry
- 2.1. Electrical and Electronics
- 2.2. Industrial
- 2.3. Transportation
- 2.4. Medical
- 2.5. Chemical
- 2.6. Defense
- 2.7. Other End-user Industries
Nanoceramic Powder Market Segmentation By Geography
-
1. Asia Pacific
- 1.1. China
- 1.2. India
- 1.3. Japan
- 1.4. South Korea
- 1.5. Rest of Asia Pacific
-
2. Europe
- 2.1. Germany
- 2.2. United Kingdom
- 2.3. France
- 2.4. Italy
- 2.5. Rest of Europe
-
3. North America
- 3.1. United States
- 3.2. Canada
- 3.3. Mexico
- 4. Rest of the World
Nanoceramic Powder Market Regional Market Share
Geographic Coverage of Nanoceramic Powder Market
Nanoceramic Powder Market REPORT HIGHLIGHTS
| Aspects | Details |
|---|---|
| Study Period | 2020-2034 |
| Base Year | 2025 |
| Estimated Year | 2026 |
| Forecast Period | 2026-2034 |
| Historical Period | 2020-2025 |
| Growth Rate | CAGR of 15.45% from 2020-2034 |
| Segmentation |
|
Table of Contents
- 1. Introduction
- 1.1. Research Scope
- 1.2. Market Segmentation
- 1.3. Research Objective
- 1.4. Definitions and Assumptions
- 2. Executive Summary
- 2.1. Market Snapshot
- 3. Market Dynamics
- 3.1. Market Drivers
- 3.2. Market Restrains
- 3.3. Market Trends
- 3.4. Market Opportunities
- 4. Market Factor Analysis
- 4.1. Porters Five Forces
- 4.1.1. Bargaining Power of Suppliers
- 4.1.2. Bargaining Power of Buyers
- 4.1.3. Threat of New Entrants
- 4.1.4. Threat of Substitutes
- 4.1.5. Competitive Rivalry
- 4.2. PESTEL analysis
- 4.3. BCG Analysis
- 4.3.1. Stars (High Growth, High Market Share)
- 4.3.2. Cash Cows (Low Growth, High Market Share)
- 4.3.3. Question Mark (High Growth, Low Market Share)
- 4.3.4. Dogs (Low Growth, Low Market Share)
- 4.4. Ansoff Matrix Analysis
- 4.5. Supply Chain Analysis
- 4.6. Regulatory Landscape
- 4.7. Current Market Potential and Opportunity Assessment (TAM–SAM–SOM Framework)
- 4.8. TIR Analyst Note
- 4.1. Porters Five Forces
- 5. Market Analysis, Insights and Forecast 2021-2033
- 5.1. Market Analysis, Insights and Forecast - by Type
- 5.1.1. Oxide Powder
- 5.1.2. Carbide Powder
- 5.1.3. Nitride Powder
- 5.1.4. Boron Powder
- 5.1.5. Other Types
- 5.2. Market Analysis, Insights and Forecast - by End-user Industry
- 5.2.1. Electrical and Electronics
- 5.2.2. Industrial
- 5.2.3. Transportation
- 5.2.4. Medical
- 5.2.5. Chemical
- 5.2.6. Defense
- 5.2.7. Other End-user Industries
- 5.3. Market Analysis, Insights and Forecast - by Region
- 5.3.1. Asia Pacific
- 5.3.2. Europe
- 5.3.3. North America
- 5.3.4. Rest of the World
- 5.1. Market Analysis, Insights and Forecast - by Type
- 6. Global Nanoceramic Powder Market Analysis, Insights and Forecast, 2021-2033
- 6.1. Market Analysis, Insights and Forecast - by Type
- 6.1.1. Oxide Powder
- 6.1.2. Carbide Powder
- 6.1.3. Nitride Powder
- 6.1.4. Boron Powder
- 6.1.5. Other Types
- 6.2. Market Analysis, Insights and Forecast - by End-user Industry
- 6.2.1. Electrical and Electronics
- 6.2.2. Industrial
- 6.2.3. Transportation
- 6.2.4. Medical
- 6.2.5. Chemical
- 6.2.6. Defense
- 6.2.7. Other End-user Industries
- 6.1. Market Analysis, Insights and Forecast - by Type
- 7. Asia Pacific Nanoceramic Powder Market Analysis, Insights and Forecast, 2020-2032
- 7.1. Market Analysis, Insights and Forecast - by Type
- 7.1.1. Oxide Powder
- 7.1.2. Carbide Powder
- 7.1.3. Nitride Powder
- 7.1.4. Boron Powder
- 7.1.5. Other Types
- 7.2. Market Analysis, Insights and Forecast - by End-user Industry
- 7.2.1. Electrical and Electronics
- 7.2.2. Industrial
- 7.2.3. Transportation
- 7.2.4. Medical
- 7.2.5. Chemical
- 7.2.6. Defense
- 7.2.7. Other End-user Industries
- 7.1. Market Analysis, Insights and Forecast - by Type
- 8. Europe Nanoceramic Powder Market Analysis, Insights and Forecast, 2020-2032
- 8.1. Market Analysis, Insights and Forecast - by Type
- 8.1.1. Oxide Powder
- 8.1.2. Carbide Powder
- 8.1.3. Nitride Powder
- 8.1.4. Boron Powder
- 8.1.5. Other Types
- 8.2. Market Analysis, Insights and Forecast - by End-user Industry
- 8.2.1. Electrical and Electronics
- 8.2.2. Industrial
- 8.2.3. Transportation
- 8.2.4. Medical
- 8.2.5. Chemical
- 8.2.6. Defense
- 8.2.7. Other End-user Industries
- 8.1. Market Analysis, Insights and Forecast - by Type
- 9. North America Nanoceramic Powder Market Analysis, Insights and Forecast, 2020-2032
- 9.1. Market Analysis, Insights and Forecast - by Type
- 9.1.1. Oxide Powder
- 9.1.2. Carbide Powder
- 9.1.3. Nitride Powder
- 9.1.4. Boron Powder
- 9.1.5. Other Types
- 9.2. Market Analysis, Insights and Forecast - by End-user Industry
- 9.2.1. Electrical and Electronics
- 9.2.2. Industrial
- 9.2.3. Transportation
- 9.2.4. Medical
- 9.2.5. Chemical
- 9.2.6. Defense
- 9.2.7. Other End-user Industries
- 9.1. Market Analysis, Insights and Forecast - by Type
- 10. Rest of the World Nanoceramic Powder Market Analysis, Insights and Forecast, 2020-2032
- 10.1. Market Analysis, Insights and Forecast - by Type
- 10.1.1. Oxide Powder
- 10.1.2. Carbide Powder
- 10.1.3. Nitride Powder
- 10.1.4. Boron Powder
- 10.1.5. Other Types
- 10.2. Market Analysis, Insights and Forecast - by End-user Industry
- 10.2.1. Electrical and Electronics
- 10.2.2. Industrial
- 10.2.3. Transportation
- 10.2.4. Medical
- 10.2.5. Chemical
- 10.2.6. Defense
- 10.2.7. Other End-user Industries
- 10.1. Market Analysis, Insights and Forecast - by Type
- 11. Competitive Analysis
- 11.1. Company Profiles
- 11.1.1 Beijing DK Nano Technology Co Ltd
- 11.1.1.1. Company Overview
- 11.1.1.2. Products
- 11.1.1.3. Company Financials
- 11.1.1.4. SWOT Analysis
- 11.1.2 Nanophase Technologies Corporation
- 11.1.2.1. Company Overview
- 11.1.2.2. Products
- 11.1.2.3. Company Financials
- 11.1.2.4. SWOT Analysis
- 11.1.3 ABM Advance Ball Mill Inc
- 11.1.3.1. Company Overview
- 11.1.3.2. Products
- 11.1.3.3. Company Financials
- 11.1.3.4. SWOT Analysis
- 11.1.4 Inframat Advanced Materials LLC
- 11.1.4.1. Company Overview
- 11.1.4.2. Products
- 11.1.4.3. Company Financials
- 11.1.4.4. SWOT Analysis
- 11.1.5 Trunnano *List Not Exhaustive
- 11.1.5.1. Company Overview
- 11.1.5.2. Products
- 11.1.5.3. Company Financials
- 11.1.5.4. SWOT Analysis
- 11.1.6 Tosoh Corporation
- 11.1.6.1. Company Overview
- 11.1.6.2. Products
- 11.1.6.3. Company Financials
- 11.1.6.4. SWOT Analysis
- 11.1.7 Cerion LLC
- 11.1.7.1. Company Overview
- 11.1.7.2. Products
- 11.1.7.3. Company Financials
- 11.1.7.4. SWOT Analysis
- 11.1.8 NYACOL Nano Technologies Inc
- 11.1.8.1. Company Overview
- 11.1.8.2. Products
- 11.1.8.3. Company Financials
- 11.1.8.4. SWOT Analysis
- 11.1.9 Innovnano-materiais Avancados SA
- 11.1.9.1. Company Overview
- 11.1.9.2. Products
- 11.1.9.3. Company Financials
- 11.1.9.4. SWOT Analysis
- 11.1.1 Beijing DK Nano Technology Co Ltd
- 11.2. Market Entropy
- 11.2.1 Company's Key Areas Served
- 11.2.2 Recent Developments
- 11.3. Company Market Share Analysis 2025
- 11.3.1 Top 5 Companies Market Share Analysis
- 11.3.2 Top 3 Companies Market Share Analysis
- 11.4. List of Potential Customers
- 12. Research Methodology
List of Figures
- Figure 1: Global Nanoceramic Powder Market Revenue Breakdown (Million, %) by Region 2025 & 2033
- Figure 2: Asia Pacific Nanoceramic Powder Market Revenue (Million), by Type 2025 & 2033
- Figure 3: Asia Pacific Nanoceramic Powder Market Revenue Share (%), by Type 2025 & 2033
- Figure 4: Asia Pacific Nanoceramic Powder Market Revenue (Million), by End-user Industry 2025 & 2033
- Figure 5: Asia Pacific Nanoceramic Powder Market Revenue Share (%), by End-user Industry 2025 & 2033
- Figure 6: Asia Pacific Nanoceramic Powder Market Revenue (Million), by Country 2025 & 2033
- Figure 7: Asia Pacific Nanoceramic Powder Market Revenue Share (%), by Country 2025 & 2033
- Figure 8: Europe Nanoceramic Powder Market Revenue (Million), by Type 2025 & 2033
- Figure 9: Europe Nanoceramic Powder Market Revenue Share (%), by Type 2025 & 2033
- Figure 10: Europe Nanoceramic Powder Market Revenue (Million), by End-user Industry 2025 & 2033
- Figure 11: Europe Nanoceramic Powder Market Revenue Share (%), by End-user Industry 2025 & 2033
- Figure 12: Europe Nanoceramic Powder Market Revenue (Million), by Country 2025 & 2033
- Figure 13: Europe Nanoceramic Powder Market Revenue Share (%), by Country 2025 & 2033
- Figure 14: North America Nanoceramic Powder Market Revenue (Million), by Type 2025 & 2033
- Figure 15: North America Nanoceramic Powder Market Revenue Share (%), by Type 2025 & 2033
- Figure 16: North America Nanoceramic Powder Market Revenue (Million), by End-user Industry 2025 & 2033
- Figure 17: North America Nanoceramic Powder Market Revenue Share (%), by End-user Industry 2025 & 2033
- Figure 18: North America Nanoceramic Powder Market Revenue (Million), by Country 2025 & 2033
- Figure 19: North America Nanoceramic Powder Market Revenue Share (%), by Country 2025 & 2033
- Figure 20: Rest of the World Nanoceramic Powder Market Revenue (Million), by Type 2025 & 2033
- Figure 21: Rest of the World Nanoceramic Powder Market Revenue Share (%), by Type 2025 & 2033
- Figure 22: Rest of the World Nanoceramic Powder Market Revenue (Million), by End-user Industry 2025 & 2033
- Figure 23: Rest of the World Nanoceramic Powder Market Revenue Share (%), by End-user Industry 2025 & 2033
- Figure 24: Rest of the World Nanoceramic Powder Market Revenue (Million), by Country 2025 & 2033
- Figure 25: Rest of the World Nanoceramic Powder Market Revenue Share (%), by Country 2025 & 2033
List of Tables
- Table 1: Global Nanoceramic Powder Market Revenue Million Forecast, by Type 2020 & 2033
- Table 2: Global Nanoceramic Powder Market Revenue Million Forecast, by End-user Industry 2020 & 2033
- Table 3: Global Nanoceramic Powder Market Revenue Million Forecast, by Region 2020 & 2033
- Table 4: Global Nanoceramic Powder Market Revenue Million Forecast, by Type 2020 & 2033
- Table 5: Global Nanoceramic Powder Market Revenue Million Forecast, by End-user Industry 2020 & 2033
- Table 6: Global Nanoceramic Powder Market Revenue Million Forecast, by Country 2020 & 2033
- Table 7: China Nanoceramic Powder Market Revenue (Million) Forecast, by Application 2020 & 2033
- Table 8: India Nanoceramic Powder Market Revenue (Million) Forecast, by Application 2020 & 2033
- Table 9: Japan Nanoceramic Powder Market Revenue (Million) Forecast, by Application 2020 & 2033
- Table 10: South Korea Nanoceramic Powder Market Revenue (Million) Forecast, by Application 2020 & 2033
- Table 11: Rest of Asia Pacific Nanoceramic Powder Market Revenue (Million) Forecast, by Application 2020 & 2033
- Table 12: Global Nanoceramic Powder Market Revenue Million Forecast, by Type 2020 & 2033
- Table 13: Global Nanoceramic Powder Market Revenue Million Forecast, by End-user Industry 2020 & 2033
- Table 14: Global Nanoceramic Powder Market Revenue Million Forecast, by Country 2020 & 2033
- Table 15: Germany Nanoceramic Powder Market Revenue (Million) Forecast, by Application 2020 & 2033
- Table 16: United Kingdom Nanoceramic Powder Market Revenue (Million) Forecast, by Application 2020 & 2033
- Table 17: France Nanoceramic Powder Market Revenue (Million) Forecast, by Application 2020 & 2033
- Table 18: Italy Nanoceramic Powder Market Revenue (Million) Forecast, by Application 2020 & 2033
- Table 19: Rest of Europe Nanoceramic Powder Market Revenue (Million) Forecast, by Application 2020 & 2033
- Table 20: Global Nanoceramic Powder Market Revenue Million Forecast, by Type 2020 & 2033
- Table 21: Global Nanoceramic Powder Market Revenue Million Forecast, by End-user Industry 2020 & 2033
- Table 22: Global Nanoceramic Powder Market Revenue Million Forecast, by Country 2020 & 2033
- Table 23: United States Nanoceramic Powder Market Revenue (Million) Forecast, by Application 2020 & 2033
- Table 24: Canada Nanoceramic Powder Market Revenue (Million) Forecast, by Application 2020 & 2033
- Table 25: Mexico Nanoceramic Powder Market Revenue (Million) Forecast, by Application 2020 & 2033
- Table 26: Global Nanoceramic Powder Market Revenue Million Forecast, by Type 2020 & 2033
- Table 27: Global Nanoceramic Powder Market Revenue Million Forecast, by End-user Industry 2020 & 2033
- Table 28: Global Nanoceramic Powder Market Revenue Million Forecast, by Country 2020 & 2033
Frequently Asked Questions
1. What is the projected Compound Annual Growth Rate (CAGR) of the Nanoceramic Powder Market?
The projected CAGR is approximately 15.45%.
2. Which companies are prominent players in the Nanoceramic Powder Market?
Key companies in the market include Beijing DK Nano Technology Co Ltd, Nanophase Technologies Corporation, ABM Advance Ball Mill Inc, Inframat Advanced Materials LLC, Trunnano *List Not Exhaustive, Tosoh Corporation, Cerion LLC, NYACOL Nano Technologies Inc, Innovnano-materiais Avancados SA.
3. What are the main segments of the Nanoceramic Powder Market?
The market segments include Type, End-user Industry.
4. Can you provide details about the market size?
The market size is estimated to be USD 3.06 Million as of 2022.
5. What are some drivers contributing to market growth?
Widespread Use in the Electronics Industry; Increasing Demand from the Healthcare Sector; Increasing Demand for High-performance Ceramic Coatings.
6. What are the notable trends driving market growth?
Increasing Demand from the Electrical and Electronics Industry.
7. Are there any restraints impacting market growth?
High Processing Cost; Other Restraints.
8. Can you provide examples of recent developments in the market?
N/A
9. What pricing options are available for accessing the report?
Pricing options include single-user, multi-user, and enterprise licenses priced at USD 4750, USD 5250, and USD 8750 respectively.
10. Is the market size provided in terms of value or volume?
The market size is provided in terms of value, measured in Million.
11. Are there any specific market keywords associated with the report?
Yes, the market keyword associated with the report is "Nanoceramic Powder Market," which aids in identifying and referencing the specific market segment covered.
12. How do I determine which pricing option suits my needs best?
The pricing options vary based on user requirements and access needs. Individual users may opt for single-user licenses, while businesses requiring broader access may choose multi-user or enterprise licenses for cost-effective access to the report.
13. Are there any additional resources or data provided in the Nanoceramic Powder Market report?
While the report offers comprehensive insights, it's advisable to review the specific contents or supplementary materials provided to ascertain if additional resources or data are available.
14. How can I stay updated on further developments or reports in the Nanoceramic Powder Market?
To stay informed about further developments, trends, and reports in the Nanoceramic Powder Market, consider subscribing to industry newsletters, following relevant companies and organizations, or regularly checking reputable industry news sources and publications.
Methodology
Step 1 - Identification of Relevant Samples Size from Population Database


Step 2 - Approaches for Defining Global Market Size (Value, Volume* & Price*)

Note*: In applicable scenarios
Step 3 - Data Sources
Primary Research
- Web Analytics
- Survey Reports
- Research Institute
- Latest Research Reports
- Opinion Leaders
Secondary Research
- Annual Reports
- White Paper
- Latest Press Release
- Industry Association
- Paid Database
- Investor Presentations

Step 4 - Data Triangulation
Involves using different sources of information in order to increase the validity of a study
These sources are likely to be stakeholders in a program - participants, other researchers, program staff, other community members, and so on.
Then we put all data in single framework & apply various statistical tools to find out the dynamic on the market.
During the analysis stage, feedback from the stakeholder groups would be compared to determine areas of agreement as well as areas of divergence