

Key Insights
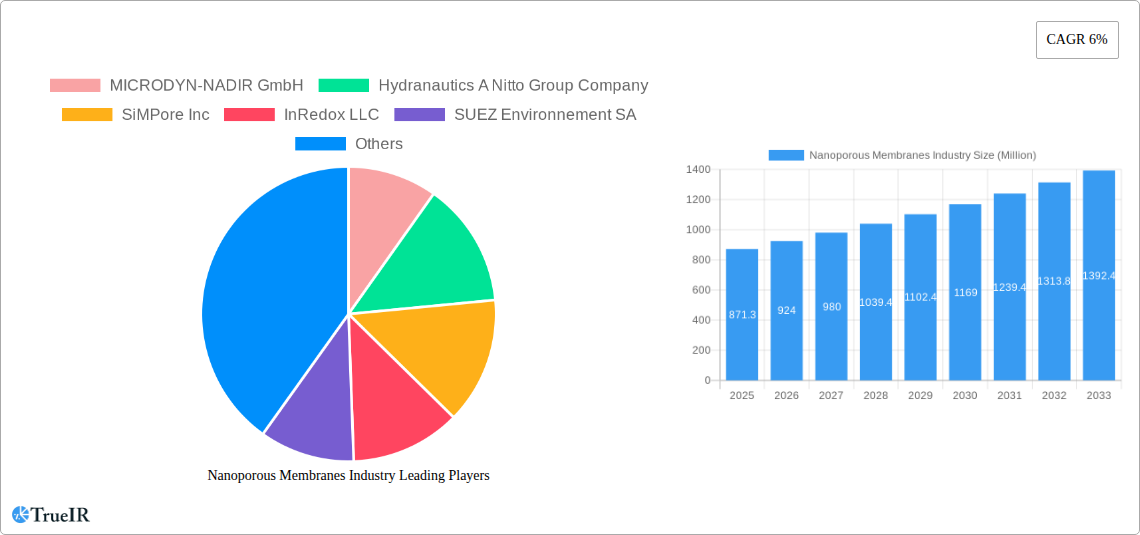
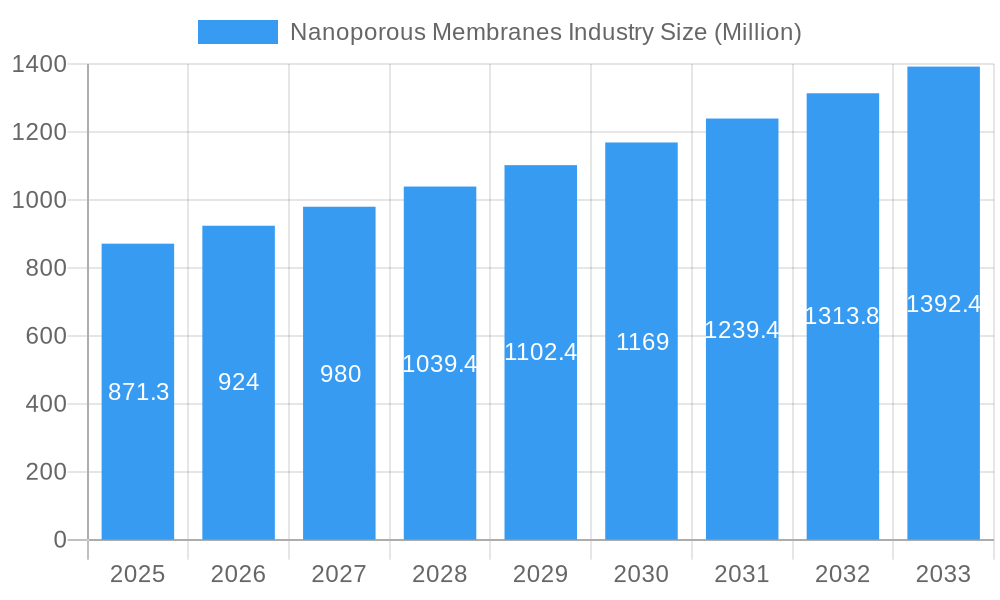
The nanoporous membranes market, valued at $871.3 million in 2025, is projected to experience robust growth, driven by increasing demand across diverse applications. A compound annual growth rate (CAGR) of 6% from 2025 to 2033 indicates a significant expansion, reaching approximately $1,460 million by 2033. Key drivers include the rising need for advanced water purification technologies in both developed and developing nations, the burgeoning fuel cell industry seeking efficient membrane-based separation systems, and the growing biomedical sector's reliance on nanoporous membranes for drug delivery and diagnostics. Furthermore, innovations in material science, particularly in organic, inorganic (ceramics, carbon nanotubes, and graphene), and hybrid membranes, are continuously improving performance parameters like selectivity, permeability, and durability, further fueling market expansion. While challenges remain in terms of high manufacturing costs and potential scalability issues for certain advanced materials, the overall market outlook remains positive due to ongoing research and development efforts aimed at overcoming these limitations. The market segmentation, with significant contributions from water treatment, fuel cells, and biomedical applications, reflects the wide-ranging applicability of nanoporous membranes. The presence of numerous established and emerging players indicates a competitive but dynamic market landscape. Geographic distribution shows a substantial presence across North America, Europe, and Asia-Pacific, highlighting the global reach and significance of this technology.
Nanoporous Membranes Industry Market Size (In Million)
The regional breakdown suggests a strong market presence in North America and Europe, driven by robust regulatory frameworks and technological advancements. Asia-Pacific is expected to witness significant growth fueled by rapid industrialization and increasing investments in water infrastructure projects. The presence of key players such as MICRODYN-NADIR GmbH, Hydranautics, and others underscores the competitive landscape. Continuous research and development efforts focused on improving membrane efficiency, cost-effectiveness, and expanding application areas will shape the future trajectory of this market. The increasing adoption of sustainable technologies and stricter environmental regulations will further contribute to market expansion, creating numerous opportunities for both established players and new entrants. The market's evolution will be dictated by advancements in material science, improved manufacturing processes, and government policies promoting sustainable technologies.
Nanoporous Membranes Industry Company Market Share
Nanoporous Membranes Industry Market Report: 2019-2033
This comprehensive report provides a detailed analysis of the global nanoporous membranes industry, offering invaluable insights for stakeholders seeking to navigate this rapidly evolving market. With a study period spanning 2019-2033, a base year of 2025, and a forecast period of 2025-2033, this report leverages extensive data analysis to project market growth and identify key trends. The market is valued at xx Million in 2025 and is projected to reach xx Million by 2033, exhibiting a CAGR of xx%.
Nanoporous Membranes Industry Market Structure & Competitive Landscape
The nanoporous membranes market is moderately concentrated, with several key players commanding significant market share. The Herfindahl-Hirschman Index (HHI) is estimated at xx, indicating a moderately competitive landscape. However, the market is characterized by continuous innovation, with companies investing heavily in R&D to develop advanced materials and improve membrane performance. Regulatory pressures, particularly concerning environmental compliance and safety standards, are increasingly influencing market dynamics. Product substitutes, such as alternative filtration technologies, present a moderate competitive threat, while the growing demand for water purification and other applications fuels market growth. End-user segmentation is significant, with the water treatment sector dominating the market, followed by biomedical and fuel cell applications. The M&A activity within the sector, while not excessively high, shows a steady trend, with approximately xx Million in transactions recorded between 2019 and 2024. Key factors driving M&A include expansion into new markets, acquisition of specialized technologies, and consolidation of market share.
- Market Concentration: Moderately concentrated, HHI estimated at xx.
- Innovation Drivers: R&D investments in advanced materials and membrane designs.
- Regulatory Impacts: Stringent environmental regulations drive adoption of advanced filtration technologies.
- Product Substitutes: Alternative filtration technologies pose a moderate threat.
- End-User Segmentation: Water treatment (xx Million), Biomedical (xx Million), Fuel cells (xx Million), Others (xx Million).
- M&A Trends: Steady volume, approximately xx Million in transactions (2019-2024).
Nanoporous Membranes Industry Market Trends & Opportunities
The global nanoporous membranes market is experiencing robust growth, driven by several factors. Technological advancements in membrane materials, particularly in the development of high-performance organic, inorganic (ceramics, carbon nanotubes, and graphene), and hybrid membranes, are significantly enhancing filtration efficiency and expanding applications. Rising consumer awareness of water quality and increasing demand for clean water are driving the adoption of advanced water treatment technologies. The growing need for efficient energy solutions is fueling the demand for nanoporous membranes in fuel cell applications. The biomedical sector is showing consistent growth due to advanced applications in drug delivery and diagnostics. Competitive dynamics are characterized by both cooperation and competition, with companies focusing on strategic alliances, technology licensing, and product diversification to gain a competitive edge. Market penetration rates for advanced nanoporous membrane technologies are steadily rising, reaching xx% in 2025 and projected to reach xx% by 2033.
Dominant Markets & Segments in Nanoporous Membranes Industry
The water treatment segment dominates the nanoporous membranes market, accounting for xx Million in 2025, driven by the escalating global demand for clean water and stringent environmental regulations. The Asia-Pacific region, particularly China and India, are experiencing the fastest growth due to extensive infrastructure development and increasing investments in water treatment facilities. The organic material type segment holds a substantial market share due to its cost-effectiveness and versatile applications. However, the inorganic segment, especially carbon nanotubes and graphene-based membranes, is witnessing rapid growth due to their superior performance characteristics.
- Key Growth Drivers (Water Treatment):
- Expanding infrastructure for water treatment plants.
- Stringent government regulations for water purification.
- Growing awareness of water quality and public health concerns.
- Key Growth Drivers (Inorganic - Carbon Nanotubes):
- Superior filtration efficiency and durability.
- Increasing R&D investments in advanced material synthesis.
- Growing applications in high-performance filtration systems.
The North American market holds a considerable share due to the presence of key players and technological advancements, followed by Europe. The biomedical segment is a rapidly growing area, driven by the increased demand for advanced drug delivery systems and medical diagnostic technologies.
Nanoporous Membranes Industry Product Analysis
Nanoporous membranes are witnessing significant technological advancements, with a focus on improving pore size control, membrane selectivity, and fouling resistance. Innovations in material science are leading to the development of membranes with superior performance characteristics. These advancements are expanding applications in various sectors, including water treatment, fuel cells, and biomedical applications. The competitive advantage lies in the ability to deliver high-performance membranes with enhanced durability, cost-effectiveness, and specific application suitability.
Key Drivers, Barriers & Challenges in Nanoporous Membranes Industry
Key Drivers: Technological advancements in membrane materials and manufacturing processes, increasing demand for clean water and efficient energy solutions, stringent environmental regulations, and growing applications in diverse sectors.
Challenges: High manufacturing costs, potential supply chain disruptions of raw materials, complex regulatory approval processes, and intense competition from established and emerging players. These challenges negatively impact market growth by approximately xx Million annually.
Growth Drivers in the Nanoporous Membranes Industry Market
Technological innovations, rising demand for clean water, and supportive government policies are key drivers. The development of advanced materials like graphene-based membranes enhances performance, driving market growth. Stringent environmental regulations and increasing investments in water treatment infrastructure further propel the market.
Challenges Impacting Nanoporous Membranes Industry Growth
High manufacturing costs, raw material supply chain vulnerabilities, and stringent regulatory hurdles impede growth. Competition from established filtration technologies also poses a significant challenge. These factors limit market expansion by an estimated xx Million annually.
Key Players Shaping the Nanoporous Membranes Industry Market
- MICRODYN-NADIR GmbH
- Hydranautics A Nitto Group Company
- SiMPore Inc
- InRedox LLC
- SUEZ Environnement SA
- Osmotech Membranes Pvt Ltd
- Hunan Keensen Technology Co Ltd
- Synder Filtration Inc
- AXEON Water Technologies Inc
- inopor GmbH
- BASF SE
- Toray Chemical Korea Inc
- DowDuPont Inc
- Koch Membrane Systems Inc
- SmartMembranes GmbH
- Applied Membranes Inc
- Alfa Laval AB
- Pure-Pro Water Corporation
Significant Nanoporous Membranes Industry Industry Milestones
- 2020: Introduction of a novel graphene-based membrane by SiMPore Inc., significantly improving filtration efficiency.
- 2021: Merger between two key players, resulting in expanded market reach and product portfolio.
- 2022: Launch of a cost-effective hybrid membrane by MICRODYN-NADIR GmbH, expanding market access.
- 2023: Significant investments in R&D by BASF SE to develop next-generation membrane materials.
- 2024: Implementation of stricter environmental regulations in several key markets, boosting demand for high-performance membranes.
Future Outlook for Nanoporous Membranes Industry Market
The nanoporous membranes market is poised for continued strong growth, driven by technological innovations, expanding applications, and favorable regulatory landscapes. Strategic partnerships and investments in R&D will play a crucial role in shaping the future of the industry. The market is expected to witness significant expansion in emerging economies, particularly in Asia and Africa, driven by increasing infrastructure development and rising consumer demand. Opportunities exist for companies to develop innovative products tailored to specific applications and focus on sustainability initiatives.
Nanoporous Membranes Industry Segmentation
-
1. Material Type
- 1.1. Organic
- 1.2. Inorgani
- 1.3. Hybrid
-
2. Application
- 2.1. Water Treatment
- 2.2. Fuel Cells
- 2.3. Biomedical
- 2.4. Food Processing
- 2.5. Other Applications
Nanoporous Membranes Industry Segmentation By Geography
-
1. Asia Pacific
- 1.1. China
- 1.2. India
- 1.3. Japan
- 1.4. South Korea
- 1.5. ASEAN Countries
- 1.6. Rest of Asia Pacific
-
2. North America
- 2.1. United States
- 2.2. Canada
- 2.3. Rest of North America
-
3. Europe
- 3.1. Germany
- 3.2. United Kingdom
- 3.3. Italy
- 3.4. France
- 3.5. Spain
- 3.6. Rest of Europe
-
4. South America
- 4.1. Brazil
- 4.2. Argentina
- 4.3. Rest of South America
- 5. Middle East
-
6. Saudi Arabia
- 6.1. South Africa
- 6.2. Rest of Middle East
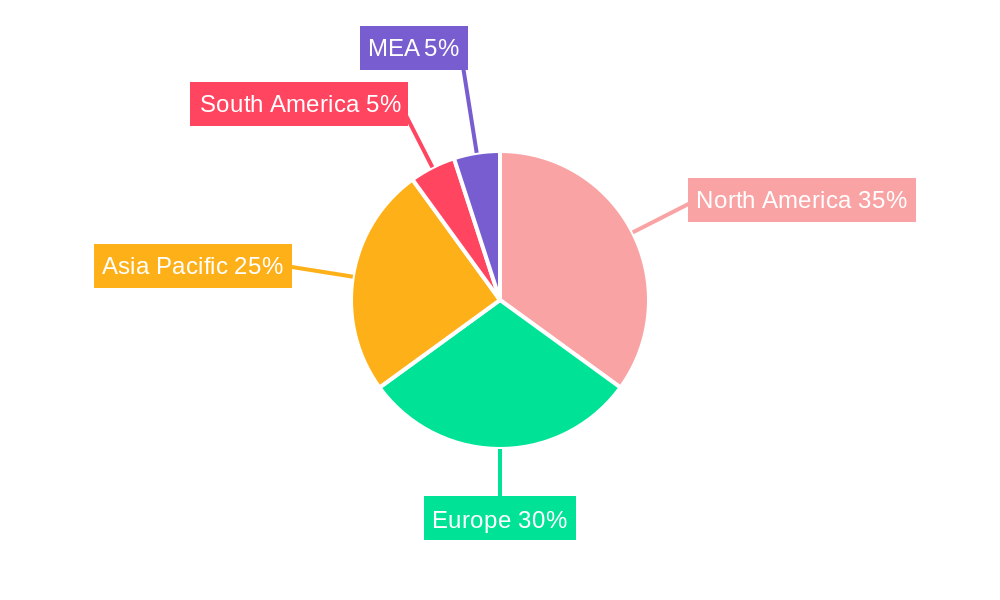
Nanoporous Membranes Industry Regional Market Share
Geographic Coverage of Nanoporous Membranes Industry
Nanoporous Membranes Industry REPORT HIGHLIGHTS
| Aspects | Details |
|---|---|
| Study Period | 2020-2034 |
| Base Year | 2025 |
| Estimated Year | 2026 |
| Forecast Period | 2026-2034 |
| Historical Period | 2020-2025 |
| Growth Rate | CAGR of 6% from 2020-2034 |
| Segmentation |
|
Table of Contents
- 1. Introduction
- 1.1. Research Scope
- 1.2. Market Segmentation
- 1.3. Research Objective
- 1.4. Definitions and Assumptions
- 2. Executive Summary
- 2.1. Market Snapshot
- 3. Market Dynamics
- 3.1. Market Drivers
- 3.2. Market Restrains
- 3.3. Market Trends
- 3.4. Market Opportunities
- 4. Market Factor Analysis
- 4.1. Porters Five Forces
- 4.1.1. Bargaining Power of Suppliers
- 4.1.2. Bargaining Power of Buyers
- 4.1.3. Threat of New Entrants
- 4.1.4. Threat of Substitutes
- 4.1.5. Competitive Rivalry
- 4.2. PESTEL analysis
- 4.3. BCG Analysis
- 4.3.1. Stars (High Growth, High Market Share)
- 4.3.2. Cash Cows (Low Growth, High Market Share)
- 4.3.3. Question Mark (High Growth, Low Market Share)
- 4.3.4. Dogs (Low Growth, Low Market Share)
- 4.4. Ansoff Matrix Analysis
- 4.5. Supply Chain Analysis
- 4.6. Regulatory Landscape
- 4.7. Current Market Potential and Opportunity Assessment (TAM–SAM–SOM Framework)
- 4.8. TIR Analyst Note
- 4.1. Porters Five Forces
- 5. Market Analysis, Insights and Forecast 2021-2033
- 5.1. Market Analysis, Insights and Forecast - by Material Type
- 5.1.1. Organic
- 5.1.2. Inorgani
- 5.1.3. Hybrid
- 5.2. Market Analysis, Insights and Forecast - by Application
- 5.2.1. Water Treatment
- 5.2.2. Fuel Cells
- 5.2.3. Biomedical
- 5.2.4. Food Processing
- 5.2.5. Other Applications
- 5.3. Market Analysis, Insights and Forecast - by Region
- 5.3.1. Asia Pacific
- 5.3.2. North America
- 5.3.3. Europe
- 5.3.4. South America
- 5.3.5. Middle East
- 5.3.6. Saudi Arabia
- 5.1. Market Analysis, Insights and Forecast - by Material Type
- 6. Global Nanoporous Membranes Industry Analysis, Insights and Forecast, 2021-2033
- 6.1. Market Analysis, Insights and Forecast - by Material Type
- 6.1.1. Organic
- 6.1.2. Inorgani
- 6.1.3. Hybrid
- 6.2. Market Analysis, Insights and Forecast - by Application
- 6.2.1. Water Treatment
- 6.2.2. Fuel Cells
- 6.2.3. Biomedical
- 6.2.4. Food Processing
- 6.2.5. Other Applications
- 6.1. Market Analysis, Insights and Forecast - by Material Type
- 7. Asia Pacific Nanoporous Membranes Industry Analysis, Insights and Forecast, 2020-2032
- 7.1. Market Analysis, Insights and Forecast - by Material Type
- 7.1.1. Organic
- 7.1.2. Inorgani
- 7.1.3. Hybrid
- 7.2. Market Analysis, Insights and Forecast - by Application
- 7.2.1. Water Treatment
- 7.2.2. Fuel Cells
- 7.2.3. Biomedical
- 7.2.4. Food Processing
- 7.2.5. Other Applications
- 7.1. Market Analysis, Insights and Forecast - by Material Type
- 8. North America Nanoporous Membranes Industry Analysis, Insights and Forecast, 2020-2032
- 8.1. Market Analysis, Insights and Forecast - by Material Type
- 8.1.1. Organic
- 8.1.2. Inorgani
- 8.1.3. Hybrid
- 8.2. Market Analysis, Insights and Forecast - by Application
- 8.2.1. Water Treatment
- 8.2.2. Fuel Cells
- 8.2.3. Biomedical
- 8.2.4. Food Processing
- 8.2.5. Other Applications
- 8.1. Market Analysis, Insights and Forecast - by Material Type
- 9. Europe Nanoporous Membranes Industry Analysis, Insights and Forecast, 2020-2032
- 9.1. Market Analysis, Insights and Forecast - by Material Type
- 9.1.1. Organic
- 9.1.2. Inorgani
- 9.1.3. Hybrid
- 9.2. Market Analysis, Insights and Forecast - by Application
- 9.2.1. Water Treatment
- 9.2.2. Fuel Cells
- 9.2.3. Biomedical
- 9.2.4. Food Processing
- 9.2.5. Other Applications
- 9.1. Market Analysis, Insights and Forecast - by Material Type
- 10. South America Nanoporous Membranes Industry Analysis, Insights and Forecast, 2020-2032
- 10.1. Market Analysis, Insights and Forecast - by Material Type
- 10.1.1. Organic
- 10.1.2. Inorgani
- 10.1.3. Hybrid
- 10.2. Market Analysis, Insights and Forecast - by Application
- 10.2.1. Water Treatment
- 10.2.2. Fuel Cells
- 10.2.3. Biomedical
- 10.2.4. Food Processing
- 10.2.5. Other Applications
- 10.1. Market Analysis, Insights and Forecast - by Material Type
- 11. Middle East Nanoporous Membranes Industry Analysis, Insights and Forecast, 2020-2032
- 11.1. Market Analysis, Insights and Forecast - by Material Type
- 11.1.1. Organic
- 11.1.2. Inorgani
- 11.1.3. Hybrid
- 11.2. Market Analysis, Insights and Forecast - by Application
- 11.2.1. Water Treatment
- 11.2.2. Fuel Cells
- 11.2.3. Biomedical
- 11.2.4. Food Processing
- 11.2.5. Other Applications
- 11.1. Market Analysis, Insights and Forecast - by Material Type
- 12. Saudi Arabia Nanoporous Membranes Industry Analysis, Insights and Forecast, 2020-2032
- 12.1. Market Analysis, Insights and Forecast - by Material Type
- 12.1.1. Organic
- 12.1.2. Inorgani
- 12.1.3. Hybrid
- 12.2. Market Analysis, Insights and Forecast - by Application
- 12.2.1. Water Treatment
- 12.2.2. Fuel Cells
- 12.2.3. Biomedical
- 12.2.4. Food Processing
- 12.2.5. Other Applications
- 12.1. Market Analysis, Insights and Forecast - by Material Type
- 13. Competitive Analysis
- 13.1. Company Profiles
- 13.1.1 MICRODYN-NADIR GmbH
- 13.1.1.1. Company Overview
- 13.1.1.2. Products
- 13.1.1.3. Company Financials
- 13.1.1.4. SWOT Analysis
- 13.1.2 Hydranautics A Nitto Group Company
- 13.1.2.1. Company Overview
- 13.1.2.2. Products
- 13.1.2.3. Company Financials
- 13.1.2.4. SWOT Analysis
- 13.1.3 SiMPore Inc
- 13.1.3.1. Company Overview
- 13.1.3.2. Products
- 13.1.3.3. Company Financials
- 13.1.3.4. SWOT Analysis
- 13.1.4 InRedox LLC
- 13.1.4.1. Company Overview
- 13.1.4.2. Products
- 13.1.4.3. Company Financials
- 13.1.4.4. SWOT Analysis
- 13.1.5 SUEZ Environnement SA
- 13.1.5.1. Company Overview
- 13.1.5.2. Products
- 13.1.5.3. Company Financials
- 13.1.5.4. SWOT Analysis
- 13.1.6 Osmotech Membranes Pvt Ltd
- 13.1.6.1. Company Overview
- 13.1.6.2. Products
- 13.1.6.3. Company Financials
- 13.1.6.4. SWOT Analysis
- 13.1.7 Hunan Keensen Technology Co Ltd
- 13.1.7.1. Company Overview
- 13.1.7.2. Products
- 13.1.7.3. Company Financials
- 13.1.7.4. SWOT Analysis
- 13.1.8 Synder Filtration Inc
- 13.1.8.1. Company Overview
- 13.1.8.2. Products
- 13.1.8.3. Company Financials
- 13.1.8.4. SWOT Analysis
- 13.1.9 AXEON Water Technologies Inc
- 13.1.9.1. Company Overview
- 13.1.9.2. Products
- 13.1.9.3. Company Financials
- 13.1.9.4. SWOT Analysis
- 13.1.10 inopor GmbH
- 13.1.10.1. Company Overview
- 13.1.10.2. Products
- 13.1.10.3. Company Financials
- 13.1.10.4. SWOT Analysis
- 13.1.11 BASF SE
- 13.1.11.1. Company Overview
- 13.1.11.2. Products
- 13.1.11.3. Company Financials
- 13.1.11.4. SWOT Analysis
- 13.1.12 Toray Chemical Korea Inc
- 13.1.12.1. Company Overview
- 13.1.12.2. Products
- 13.1.12.3. Company Financials
- 13.1.12.4. SWOT Analysis
- 13.1.13 DowDuPont Inc
- 13.1.13.1. Company Overview
- 13.1.13.2. Products
- 13.1.13.3. Company Financials
- 13.1.13.4. SWOT Analysis
- 13.1.14 Koch Membrane Systems Inc
- 13.1.14.1. Company Overview
- 13.1.14.2. Products
- 13.1.14.3. Company Financials
- 13.1.14.4. SWOT Analysis
- 13.1.15 SmartMembranes GmbH
- 13.1.15.1. Company Overview
- 13.1.15.2. Products
- 13.1.15.3. Company Financials
- 13.1.15.4. SWOT Analysis
- 13.1.16 Applied Membranes Inc
- 13.1.16.1. Company Overview
- 13.1.16.2. Products
- 13.1.16.3. Company Financials
- 13.1.16.4. SWOT Analysis
- 13.1.17 Alfa Laval AB
- 13.1.17.1. Company Overview
- 13.1.17.2. Products
- 13.1.17.3. Company Financials
- 13.1.17.4. SWOT Analysis
- 13.1.18 Pure-Pro Water Corporation
- 13.1.18.1. Company Overview
- 13.1.18.2. Products
- 13.1.18.3. Company Financials
- 13.1.18.4. SWOT Analysis
- 13.1.1 MICRODYN-NADIR GmbH
- 13.2. Market Entropy
- 13.2.1 Company's Key Areas Served
- 13.2.2 Recent Developments
- 13.3. Company Market Share Analysis 2025
- 13.3.1 Top 5 Companies Market Share Analysis
- 13.3.2 Top 3 Companies Market Share Analysis
- 13.4. List of Potential Customers
- 14. Research Methodology
List of Figures
- Figure 1: Global Nanoporous Membranes Industry Revenue Breakdown (Million, %) by Region 2025 & 2033
- Figure 2: Global Nanoporous Membranes Industry Volume Breakdown (K Units, %) by Region 2025 & 2033
- Figure 3: Asia Pacific Nanoporous Membranes Industry Revenue (Million), by Material Type 2025 & 2033
- Figure 4: Asia Pacific Nanoporous Membranes Industry Volume (K Units), by Material Type 2025 & 2033
- Figure 5: Asia Pacific Nanoporous Membranes Industry Revenue Share (%), by Material Type 2025 & 2033
- Figure 6: Asia Pacific Nanoporous Membranes Industry Volume Share (%), by Material Type 2025 & 2033
- Figure 7: Asia Pacific Nanoporous Membranes Industry Revenue (Million), by Application 2025 & 2033
- Figure 8: Asia Pacific Nanoporous Membranes Industry Volume (K Units), by Application 2025 & 2033
- Figure 9: Asia Pacific Nanoporous Membranes Industry Revenue Share (%), by Application 2025 & 2033
- Figure 10: Asia Pacific Nanoporous Membranes Industry Volume Share (%), by Application 2025 & 2033
- Figure 11: Asia Pacific Nanoporous Membranes Industry Revenue (Million), by Country 2025 & 2033
- Figure 12: Asia Pacific Nanoporous Membranes Industry Volume (K Units), by Country 2025 & 2033
- Figure 13: Asia Pacific Nanoporous Membranes Industry Revenue Share (%), by Country 2025 & 2033
- Figure 14: Asia Pacific Nanoporous Membranes Industry Volume Share (%), by Country 2025 & 2033
- Figure 15: North America Nanoporous Membranes Industry Revenue (Million), by Material Type 2025 & 2033
- Figure 16: North America Nanoporous Membranes Industry Volume (K Units), by Material Type 2025 & 2033
- Figure 17: North America Nanoporous Membranes Industry Revenue Share (%), by Material Type 2025 & 2033
- Figure 18: North America Nanoporous Membranes Industry Volume Share (%), by Material Type 2025 & 2033
- Figure 19: North America Nanoporous Membranes Industry Revenue (Million), by Application 2025 & 2033
- Figure 20: North America Nanoporous Membranes Industry Volume (K Units), by Application 2025 & 2033
- Figure 21: North America Nanoporous Membranes Industry Revenue Share (%), by Application 2025 & 2033
- Figure 22: North America Nanoporous Membranes Industry Volume Share (%), by Application 2025 & 2033
- Figure 23: North America Nanoporous Membranes Industry Revenue (Million), by Country 2025 & 2033
- Figure 24: North America Nanoporous Membranes Industry Volume (K Units), by Country 2025 & 2033
- Figure 25: North America Nanoporous Membranes Industry Revenue Share (%), by Country 2025 & 2033
- Figure 26: North America Nanoporous Membranes Industry Volume Share (%), by Country 2025 & 2033
- Figure 27: Europe Nanoporous Membranes Industry Revenue (Million), by Material Type 2025 & 2033
- Figure 28: Europe Nanoporous Membranes Industry Volume (K Units), by Material Type 2025 & 2033
- Figure 29: Europe Nanoporous Membranes Industry Revenue Share (%), by Material Type 2025 & 2033
- Figure 30: Europe Nanoporous Membranes Industry Volume Share (%), by Material Type 2025 & 2033
- Figure 31: Europe Nanoporous Membranes Industry Revenue (Million), by Application 2025 & 2033
- Figure 32: Europe Nanoporous Membranes Industry Volume (K Units), by Application 2025 & 2033
- Figure 33: Europe Nanoporous Membranes Industry Revenue Share (%), by Application 2025 & 2033
- Figure 34: Europe Nanoporous Membranes Industry Volume Share (%), by Application 2025 & 2033
- Figure 35: Europe Nanoporous Membranes Industry Revenue (Million), by Country 2025 & 2033
- Figure 36: Europe Nanoporous Membranes Industry Volume (K Units), by Country 2025 & 2033
- Figure 37: Europe Nanoporous Membranes Industry Revenue Share (%), by Country 2025 & 2033
- Figure 38: Europe Nanoporous Membranes Industry Volume Share (%), by Country 2025 & 2033
- Figure 39: South America Nanoporous Membranes Industry Revenue (Million), by Material Type 2025 & 2033
- Figure 40: South America Nanoporous Membranes Industry Volume (K Units), by Material Type 2025 & 2033
- Figure 41: South America Nanoporous Membranes Industry Revenue Share (%), by Material Type 2025 & 2033
- Figure 42: South America Nanoporous Membranes Industry Volume Share (%), by Material Type 2025 & 2033
- Figure 43: South America Nanoporous Membranes Industry Revenue (Million), by Application 2025 & 2033
- Figure 44: South America Nanoporous Membranes Industry Volume (K Units), by Application 2025 & 2033
- Figure 45: South America Nanoporous Membranes Industry Revenue Share (%), by Application 2025 & 2033
- Figure 46: South America Nanoporous Membranes Industry Volume Share (%), by Application 2025 & 2033
- Figure 47: South America Nanoporous Membranes Industry Revenue (Million), by Country 2025 & 2033
- Figure 48: South America Nanoporous Membranes Industry Volume (K Units), by Country 2025 & 2033
- Figure 49: South America Nanoporous Membranes Industry Revenue Share (%), by Country 2025 & 2033
- Figure 50: South America Nanoporous Membranes Industry Volume Share (%), by Country 2025 & 2033
- Figure 51: Middle East Nanoporous Membranes Industry Revenue (Million), by Material Type 2025 & 2033
- Figure 52: Middle East Nanoporous Membranes Industry Volume (K Units), by Material Type 2025 & 2033
- Figure 53: Middle East Nanoporous Membranes Industry Revenue Share (%), by Material Type 2025 & 2033
- Figure 54: Middle East Nanoporous Membranes Industry Volume Share (%), by Material Type 2025 & 2033
- Figure 55: Middle East Nanoporous Membranes Industry Revenue (Million), by Application 2025 & 2033
- Figure 56: Middle East Nanoporous Membranes Industry Volume (K Units), by Application 2025 & 2033
- Figure 57: Middle East Nanoporous Membranes Industry Revenue Share (%), by Application 2025 & 2033
- Figure 58: Middle East Nanoporous Membranes Industry Volume Share (%), by Application 2025 & 2033
- Figure 59: Middle East Nanoporous Membranes Industry Revenue (Million), by Country 2025 & 2033
- Figure 60: Middle East Nanoporous Membranes Industry Volume (K Units), by Country 2025 & 2033
- Figure 61: Middle East Nanoporous Membranes Industry Revenue Share (%), by Country 2025 & 2033
- Figure 62: Middle East Nanoporous Membranes Industry Volume Share (%), by Country 2025 & 2033
- Figure 63: Saudi Arabia Nanoporous Membranes Industry Revenue (Million), by Material Type 2025 & 2033
- Figure 64: Saudi Arabia Nanoporous Membranes Industry Volume (K Units), by Material Type 2025 & 2033
- Figure 65: Saudi Arabia Nanoporous Membranes Industry Revenue Share (%), by Material Type 2025 & 2033
- Figure 66: Saudi Arabia Nanoporous Membranes Industry Volume Share (%), by Material Type 2025 & 2033
- Figure 67: Saudi Arabia Nanoporous Membranes Industry Revenue (Million), by Application 2025 & 2033
- Figure 68: Saudi Arabia Nanoporous Membranes Industry Volume (K Units), by Application 2025 & 2033
- Figure 69: Saudi Arabia Nanoporous Membranes Industry Revenue Share (%), by Application 2025 & 2033
- Figure 70: Saudi Arabia Nanoporous Membranes Industry Volume Share (%), by Application 2025 & 2033
- Figure 71: Saudi Arabia Nanoporous Membranes Industry Revenue (Million), by Country 2025 & 2033
- Figure 72: Saudi Arabia Nanoporous Membranes Industry Volume (K Units), by Country 2025 & 2033
- Figure 73: Saudi Arabia Nanoporous Membranes Industry Revenue Share (%), by Country 2025 & 2033
- Figure 74: Saudi Arabia Nanoporous Membranes Industry Volume Share (%), by Country 2025 & 2033
List of Tables
- Table 1: Global Nanoporous Membranes Industry Revenue Million Forecast, by Material Type 2020 & 2033
- Table 2: Global Nanoporous Membranes Industry Volume K Units Forecast, by Material Type 2020 & 2033
- Table 3: Global Nanoporous Membranes Industry Revenue Million Forecast, by Application 2020 & 2033
- Table 4: Global Nanoporous Membranes Industry Volume K Units Forecast, by Application 2020 & 2033
- Table 5: Global Nanoporous Membranes Industry Revenue Million Forecast, by Region 2020 & 2033
- Table 6: Global Nanoporous Membranes Industry Volume K Units Forecast, by Region 2020 & 2033
- Table 7: Global Nanoporous Membranes Industry Revenue Million Forecast, by Material Type 2020 & 2033
- Table 8: Global Nanoporous Membranes Industry Volume K Units Forecast, by Material Type 2020 & 2033
- Table 9: Global Nanoporous Membranes Industry Revenue Million Forecast, by Application 2020 & 2033
- Table 10: Global Nanoporous Membranes Industry Volume K Units Forecast, by Application 2020 & 2033
- Table 11: Global Nanoporous Membranes Industry Revenue Million Forecast, by Country 2020 & 2033
- Table 12: Global Nanoporous Membranes Industry Volume K Units Forecast, by Country 2020 & 2033
- Table 13: China Nanoporous Membranes Industry Revenue (Million) Forecast, by Application 2020 & 2033
- Table 14: China Nanoporous Membranes Industry Volume (K Units) Forecast, by Application 2020 & 2033
- Table 15: India Nanoporous Membranes Industry Revenue (Million) Forecast, by Application 2020 & 2033
- Table 16: India Nanoporous Membranes Industry Volume (K Units) Forecast, by Application 2020 & 2033
- Table 17: Japan Nanoporous Membranes Industry Revenue (Million) Forecast, by Application 2020 & 2033
- Table 18: Japan Nanoporous Membranes Industry Volume (K Units) Forecast, by Application 2020 & 2033
- Table 19: South Korea Nanoporous Membranes Industry Revenue (Million) Forecast, by Application 2020 & 2033
- Table 20: South Korea Nanoporous Membranes Industry Volume (K Units) Forecast, by Application 2020 & 2033
- Table 21: ASEAN Countries Nanoporous Membranes Industry Revenue (Million) Forecast, by Application 2020 & 2033
- Table 22: ASEAN Countries Nanoporous Membranes Industry Volume (K Units) Forecast, by Application 2020 & 2033
- Table 23: Rest of Asia Pacific Nanoporous Membranes Industry Revenue (Million) Forecast, by Application 2020 & 2033
- Table 24: Rest of Asia Pacific Nanoporous Membranes Industry Volume (K Units) Forecast, by Application 2020 & 2033
- Table 25: Global Nanoporous Membranes Industry Revenue Million Forecast, by Material Type 2020 & 2033
- Table 26: Global Nanoporous Membranes Industry Volume K Units Forecast, by Material Type 2020 & 2033
- Table 27: Global Nanoporous Membranes Industry Revenue Million Forecast, by Application 2020 & 2033
- Table 28: Global Nanoporous Membranes Industry Volume K Units Forecast, by Application 2020 & 2033
- Table 29: Global Nanoporous Membranes Industry Revenue Million Forecast, by Country 2020 & 2033
- Table 30: Global Nanoporous Membranes Industry Volume K Units Forecast, by Country 2020 & 2033
- Table 31: United States Nanoporous Membranes Industry Revenue (Million) Forecast, by Application 2020 & 2033
- Table 32: United States Nanoporous Membranes Industry Volume (K Units) Forecast, by Application 2020 & 2033
- Table 33: Canada Nanoporous Membranes Industry Revenue (Million) Forecast, by Application 2020 & 2033
- Table 34: Canada Nanoporous Membranes Industry Volume (K Units) Forecast, by Application 2020 & 2033
- Table 35: Rest of North America Nanoporous Membranes Industry Revenue (Million) Forecast, by Application 2020 & 2033
- Table 36: Rest of North America Nanoporous Membranes Industry Volume (K Units) Forecast, by Application 2020 & 2033
- Table 37: Global Nanoporous Membranes Industry Revenue Million Forecast, by Material Type 2020 & 2033
- Table 38: Global Nanoporous Membranes Industry Volume K Units Forecast, by Material Type 2020 & 2033
- Table 39: Global Nanoporous Membranes Industry Revenue Million Forecast, by Application 2020 & 2033
- Table 40: Global Nanoporous Membranes Industry Volume K Units Forecast, by Application 2020 & 2033
- Table 41: Global Nanoporous Membranes Industry Revenue Million Forecast, by Country 2020 & 2033
- Table 42: Global Nanoporous Membranes Industry Volume K Units Forecast, by Country 2020 & 2033
- Table 43: Germany Nanoporous Membranes Industry Revenue (Million) Forecast, by Application 2020 & 2033
- Table 44: Germany Nanoporous Membranes Industry Volume (K Units) Forecast, by Application 2020 & 2033
- Table 45: United Kingdom Nanoporous Membranes Industry Revenue (Million) Forecast, by Application 2020 & 2033
- Table 46: United Kingdom Nanoporous Membranes Industry Volume (K Units) Forecast, by Application 2020 & 2033
- Table 47: Italy Nanoporous Membranes Industry Revenue (Million) Forecast, by Application 2020 & 2033
- Table 48: Italy Nanoporous Membranes Industry Volume (K Units) Forecast, by Application 2020 & 2033
- Table 49: France Nanoporous Membranes Industry Revenue (Million) Forecast, by Application 2020 & 2033
- Table 50: France Nanoporous Membranes Industry Volume (K Units) Forecast, by Application 2020 & 2033
- Table 51: Spain Nanoporous Membranes Industry Revenue (Million) Forecast, by Application 2020 & 2033
- Table 52: Spain Nanoporous Membranes Industry Volume (K Units) Forecast, by Application 2020 & 2033
- Table 53: Rest of Europe Nanoporous Membranes Industry Revenue (Million) Forecast, by Application 2020 & 2033
- Table 54: Rest of Europe Nanoporous Membranes Industry Volume (K Units) Forecast, by Application 2020 & 2033
- Table 55: Global Nanoporous Membranes Industry Revenue Million Forecast, by Material Type 2020 & 2033
- Table 56: Global Nanoporous Membranes Industry Volume K Units Forecast, by Material Type 2020 & 2033
- Table 57: Global Nanoporous Membranes Industry Revenue Million Forecast, by Application 2020 & 2033
- Table 58: Global Nanoporous Membranes Industry Volume K Units Forecast, by Application 2020 & 2033
- Table 59: Global Nanoporous Membranes Industry Revenue Million Forecast, by Country 2020 & 2033
- Table 60: Global Nanoporous Membranes Industry Volume K Units Forecast, by Country 2020 & 2033
- Table 61: Brazil Nanoporous Membranes Industry Revenue (Million) Forecast, by Application 2020 & 2033
- Table 62: Brazil Nanoporous Membranes Industry Volume (K Units) Forecast, by Application 2020 & 2033
- Table 63: Argentina Nanoporous Membranes Industry Revenue (Million) Forecast, by Application 2020 & 2033
- Table 64: Argentina Nanoporous Membranes Industry Volume (K Units) Forecast, by Application 2020 & 2033
- Table 65: Rest of South America Nanoporous Membranes Industry Revenue (Million) Forecast, by Application 2020 & 2033
- Table 66: Rest of South America Nanoporous Membranes Industry Volume (K Units) Forecast, by Application 2020 & 2033
- Table 67: Global Nanoporous Membranes Industry Revenue Million Forecast, by Material Type 2020 & 2033
- Table 68: Global Nanoporous Membranes Industry Volume K Units Forecast, by Material Type 2020 & 2033
- Table 69: Global Nanoporous Membranes Industry Revenue Million Forecast, by Application 2020 & 2033
- Table 70: Global Nanoporous Membranes Industry Volume K Units Forecast, by Application 2020 & 2033
- Table 71: Global Nanoporous Membranes Industry Revenue Million Forecast, by Country 2020 & 2033
- Table 72: Global Nanoporous Membranes Industry Volume K Units Forecast, by Country 2020 & 2033
- Table 73: Global Nanoporous Membranes Industry Revenue Million Forecast, by Material Type 2020 & 2033
- Table 74: Global Nanoporous Membranes Industry Volume K Units Forecast, by Material Type 2020 & 2033
- Table 75: Global Nanoporous Membranes Industry Revenue Million Forecast, by Application 2020 & 2033
- Table 76: Global Nanoporous Membranes Industry Volume K Units Forecast, by Application 2020 & 2033
- Table 77: Global Nanoporous Membranes Industry Revenue Million Forecast, by Country 2020 & 2033
- Table 78: Global Nanoporous Membranes Industry Volume K Units Forecast, by Country 2020 & 2033
- Table 79: South Africa Nanoporous Membranes Industry Revenue (Million) Forecast, by Application 2020 & 2033
- Table 80: South Africa Nanoporous Membranes Industry Volume (K Units) Forecast, by Application 2020 & 2033
- Table 81: Rest of Middle East Nanoporous Membranes Industry Revenue (Million) Forecast, by Application 2020 & 2033
- Table 82: Rest of Middle East Nanoporous Membranes Industry Volume (K Units) Forecast, by Application 2020 & 2033
Frequently Asked Questions
1. What is the projected Compound Annual Growth Rate (CAGR) of the Nanoporous Membranes Industry?
The projected CAGR is approximately 6%.
2. Which companies are prominent players in the Nanoporous Membranes Industry?
Key companies in the market include MICRODYN-NADIR GmbH, Hydranautics A Nitto Group Company, SiMPore Inc, InRedox LLC, SUEZ Environnement SA, Osmotech Membranes Pvt Ltd, Hunan Keensen Technology Co Ltd, Synder Filtration Inc, AXEON Water Technologies Inc, inopor GmbH, BASF SE, Toray Chemical Korea Inc, DowDuPont Inc, Koch Membrane Systems Inc, SmartMembranes GmbH, Applied Membranes Inc, Alfa Laval AB, Pure-Pro Water Corporation.
3. What are the main segments of the Nanoporous Membranes Industry?
The market segments include Material Type, Application.
4. Can you provide details about the market size?
The market size is estimated to be USD 871.3 Million as of 2022.
5. What are some drivers contributing to market growth?
; Growing Need to Treat Wastewater; Rising Water Desalination Activities.
6. What are the notable trends driving market growth?
Growing Demand from Water Treatment Application.
7. Are there any restraints impacting market growth?
; Low Adoption in the Developing Countries; Poor Fouling Resistance of Nanoporous Membranes; Supply Deficiency of Nanomaterials.
8. Can you provide examples of recent developments in the market?
N/A
9. What pricing options are available for accessing the report?
Pricing options include single-user, multi-user, and enterprise licenses priced at USD 4750, USD 5250, and USD 8750 respectively.
10. Is the market size provided in terms of value or volume?
The market size is provided in terms of value, measured in Million and volume, measured in K Units.
11. Are there any specific market keywords associated with the report?
Yes, the market keyword associated with the report is "Nanoporous Membranes Industry," which aids in identifying and referencing the specific market segment covered.
12. How do I determine which pricing option suits my needs best?
The pricing options vary based on user requirements and access needs. Individual users may opt for single-user licenses, while businesses requiring broader access may choose multi-user or enterprise licenses for cost-effective access to the report.
13. Are there any additional resources or data provided in the Nanoporous Membranes Industry report?
While the report offers comprehensive insights, it's advisable to review the specific contents or supplementary materials provided to ascertain if additional resources or data are available.
14. How can I stay updated on further developments or reports in the Nanoporous Membranes Industry?
To stay informed about further developments, trends, and reports in the Nanoporous Membranes Industry, consider subscribing to industry newsletters, following relevant companies and organizations, or regularly checking reputable industry news sources and publications.
Methodology
Step 1 - Identification of Relevant Samples Size from Population Database


Step 2 - Approaches for Defining Global Market Size (Value, Volume* & Price*)

Note*: In applicable scenarios
Step 3 - Data Sources
Primary Research
- Web Analytics
- Survey Reports
- Research Institute
- Latest Research Reports
- Opinion Leaders
Secondary Research
- Annual Reports
- White Paper
- Latest Press Release
- Industry Association
- Paid Database
- Investor Presentations

Step 4 - Data Triangulation
Involves using different sources of information in order to increase the validity of a study
These sources are likely to be stakeholders in a program - participants, other researchers, program staff, other community members, and so on.
Then we put all data in single framework & apply various statistical tools to find out the dynamic on the market.
During the analysis stage, feedback from the stakeholder groups would be compared to determine areas of agreement as well as areas of divergence