

Key Insights
The global nanotubes market, valued at $7.98 billion in 2025, is projected to experience robust growth, driven by a compound annual growth rate (CAGR) of 19.95% from 2025 to 2033. This expansion is fueled by increasing demand across diverse sectors, primarily driven by the unique properties of nanotubes – their exceptional strength, electrical conductivity, and thermal stability. Key applications such as lithium-ion batteries in the burgeoning electric vehicle market, advanced sensors for various industries, and innovative biomedical applications like targeted drug delivery and biosensors are significant contributors to market growth. The electronics industry, particularly semiconductor manufacturing and conductive plastics, is another major driver, pushing for miniaturization and enhanced performance. Growth is further stimulated by ongoing research and development leading to new nanotube types and applications, and improvements in production techniques making nanotubes more cost-effective and scalable.
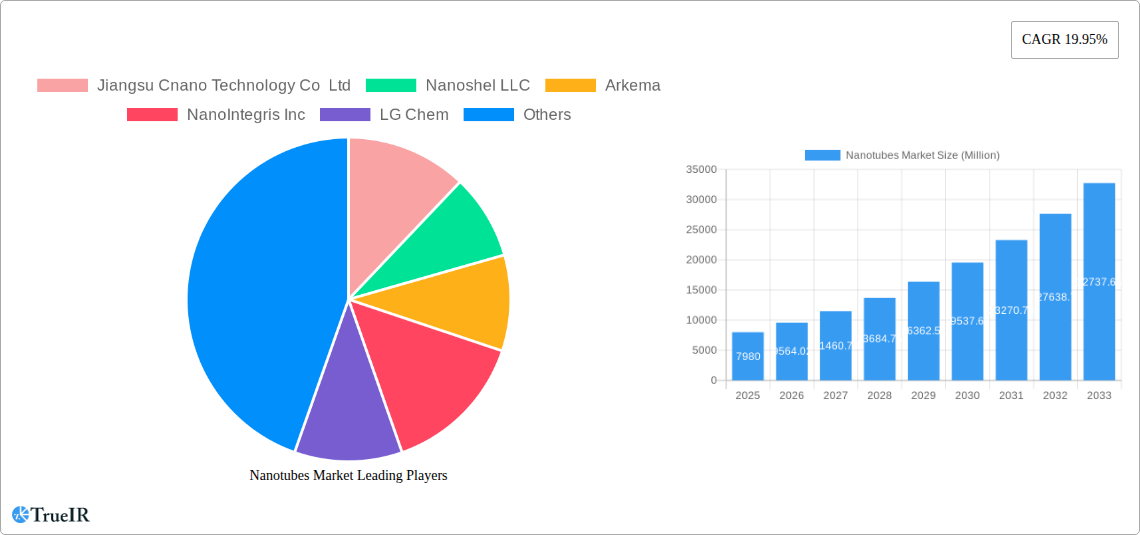
Nanotubes Market Market Size (In Billion)
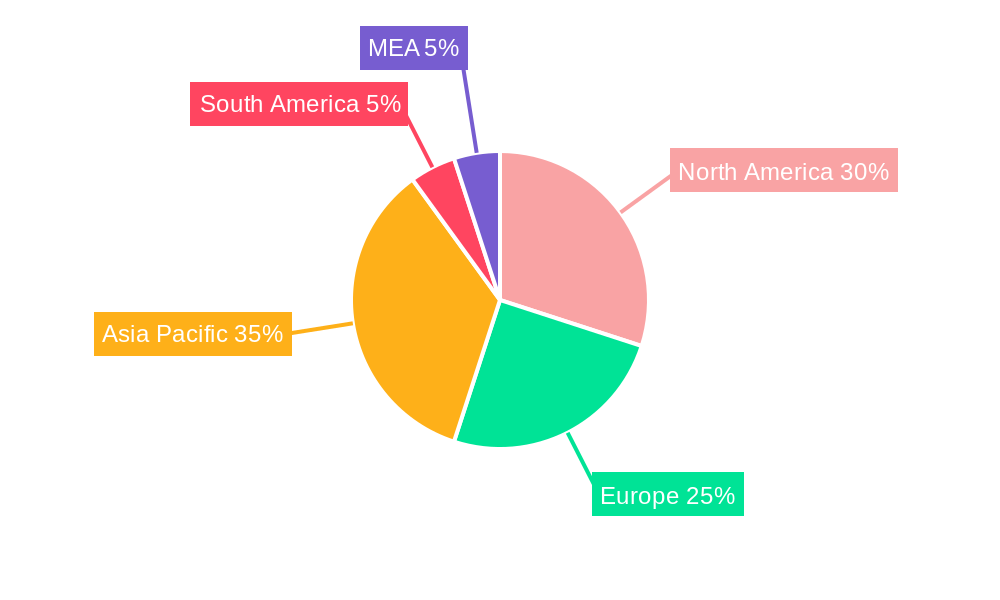
However, certain restraints impact market growth. The high cost of production, particularly for specialized nanotubes, remains a barrier to wider adoption. Moreover, concerns regarding the potential toxicity of nanotubes and the need for rigorous safety protocols require careful consideration and influence market expansion. Despite these limitations, the market segmentation reveals strong growth opportunities across various types (carbon nanotubes dominating, followed by silicon and inorganic nanotubes), structures (polymeric nanomaterials showing promising growth), and end-use industries (healthcare, electronics, and energy exhibiting particularly strong demand). Regional analysis indicates that Asia-Pacific, particularly China, is expected to lead the market due to its significant manufacturing base and growing investments in nanotechnology research and development. North America and Europe are anticipated to maintain substantial market shares, driven by technological advancements and strong adoption rates in various industries. The overall market outlook remains exceptionally positive, with significant potential for continued growth throughout the forecast period.
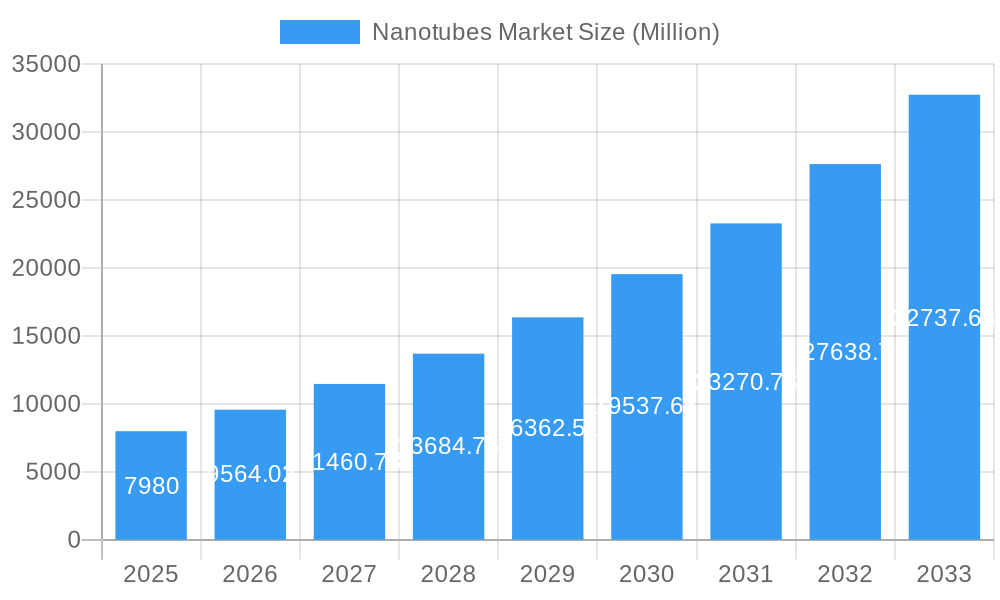
Nanotubes Market Company Market Share
Nanotubes Market: A Comprehensive Market Report (2019-2033)
This dynamic report provides a comprehensive analysis of the Nanotubes Market, offering invaluable insights for investors, industry professionals, and researchers. The study period spans from 2019 to 2033, with 2025 serving as the base and estimated year. The report leverages extensive market research to forecast market trends and growth opportunities until 2033. Key segments analyzed include various types of nanotubes, structure types, applications, and end-user industries, providing a holistic view of this rapidly evolving market. The report also examines the competitive landscape, highlighting key players and significant industry milestones.
Nanotubes Market Structure & Competitive Landscape
The Nanotubes Market exhibits a moderately concentrated structure, with a handful of major players holding significant market share. However, the market is also characterized by the presence of numerous smaller companies, particularly in the specialized application segments. Innovation is a key driver, with companies continuously developing new nanotube materials and applications. Regulatory frameworks concerning nanomaterials' safety and environmental impact play a significant role, influencing market growth and investment decisions. Product substitution, mainly from other advanced materials, poses a competitive challenge. The market demonstrates strong end-user segmentation, with the electronics, energy, and healthcare sectors dominating demand. M&A activity has been notably increasing, driven by the need for companies to expand their product portfolios, gain access to new technologies, and enhance their competitive positioning. For example, the acquisition of Nanocyl SA by Birla Carbon in October 2023 signifies the consolidation trend in the sector.
- Market Concentration: The Herfindahl-Hirschman Index (HHI) for the market is estimated at xx, suggesting a moderately concentrated market.
- M&A Volume: The total value of M&A transactions within the Nanotubes Market from 2019-2024 reached approximately xx Million.
- Innovation Drivers: R&D investments in improving nanotube synthesis, functionalization, and processing are key factors driving innovation.
- Regulatory Impacts: Stringent regulations regarding nanomaterial safety and environmental impact can potentially hinder growth, especially in certain regions.
Nanotubes Market Trends & Opportunities
The Nanotubes Market is experiencing substantial growth, driven by increasing demand across various end-use sectors. The Compound Annual Growth Rate (CAGR) from 2025 to 2033 is projected to be xx%, reflecting the market's strong expansion trajectory. Technological advancements, particularly in the synthesis and functionalization of nanotubes, are constantly broadening their applications. Consumer preferences are shifting towards high-performance, sustainable, and lightweight materials, making nanotubes increasingly attractive. The competitive landscape is dynamic, with both established players and emerging startups vying for market share. Strategic alliances, partnerships, and R&D collaborations are becoming increasingly common as companies seek to gain a competitive edge. Market penetration rates are notably increasing in key application areas, such as lithium-ion batteries and conductive plastics.
Dominant Markets & Segments in Nanotubes Market
The Asia-Pacific region currently dominates the Nanotubes Market, primarily due to significant manufacturing capacity and a robust electronics industry. Within the various segments:
Type: Carbon nanotubes currently dominate the market due to their established production methods and widespread applications.
Structure Type: Non-polymer organic nanomaterials hold a larger share due to their superior properties in certain applications, although polymeric nanomaterials are showing promising growth potential.
Application: Lithium-ion batteries and conductive plastics represent the largest application segments, driven by the booming electronics and automotive industries.
- Key Growth Drivers (Asia-Pacific Region):
- Rapid expansion of the electronics and automotive industries.
- Government support for nanotechnology R&D.
- Increasing adoption of renewable energy technologies.
- Abundant raw materials.
The detailed analysis of market dominance across regions and segments would require detailed data not provided, which can only be predicted at this point in time.
Nanotubes Market Product Analysis
Significant advancements are shaping the Nanotubes Market, characterized by ongoing innovation in synthesis techniques, resulting in higher-quality nanotubes with improved properties. These improvements directly enhance various applications, leading to better performance, reliability, and cost-effectiveness. The competitive advantage is primarily determined by production efficiency, cost-effectiveness, and the ability to deliver customized nanotube solutions to meet specific application requirements.
Key Drivers, Barriers & Challenges in Nanotubes Market
Key Drivers: The increasing demand for lightweight, high-strength materials in various industries (e.g., aerospace and automotive) is a key driver. Furthermore, the growing adoption of renewable energy technologies, such as lithium-ion batteries and hydrogen storage devices, is fueling market growth. Government initiatives and funding programs dedicated to nanotechnology R&D also play a significant role.
Challenges: High production costs and challenges in achieving consistent product quality pose significant barriers. Regulatory uncertainties and concerns about the potential toxicity of nanomaterials impede wider adoption. Intense competition among established players and new entrants further complicates the market landscape. The supply chain can be disrupted by global events such as pandemics or regional conflicts.
Growth Drivers in the Nanotubes Market Market
The rising demand for high-performance materials in diverse sectors is a primary growth driver. The push towards miniaturization in electronics and the increasing need for advanced energy storage solutions further fuels market growth. Government regulations promoting sustainable technologies are also boosting demand. The development of new and improved manufacturing methods and applications are further bolstering the growth potential of this market.
Challenges Impacting Nanotubes Market Growth
High production costs, coupled with scalability challenges, hinder widespread adoption. The need for extensive safety and toxicity testing creates regulatory hurdles, delaying market entry for new products. Furthermore, intense competition among established players and emerging companies can compress profit margins. Variations in product quality and lack of standardization can reduce market confidence.
Key Players Shaping the Nanotubes Market Market
- Jiangsu Cnano Technology Co Ltd
- Nanoshel LLC
- Arkema
- NanoIntegris Inc
- LG Chem
- Cheap Tubes
- Carbon Solutions Inc
- Hyperion Catalysis International
- Resonac Holdings Corporation
- Nano-C
- Thomas Swan & Co Ltd
- Nanocyl SA (Birla Carbon)
Significant Nanotubes Market Industry Milestones
- October 2023: Birla Carbon (Aditya Birla Group) acquired Nanocyl SA, significantly strengthening its position in the lithium-ion battery materials market. This acquisition significantly enhanced the company's portfolio and market share in the nanotubes sector.
- May 2023: LG Chem commenced construction of its fourth carbon nanotube (CNT) plant, indicating substantial investment and a strong belief in future market growth. This expansion will significantly increase LG Chem's production capacity by 2025, thereby potentially impacting market pricing and availability.
Future Outlook for Nanotubes Market Market
The Nanotubes Market is poised for continued expansion, driven by technological advancements, increasing demand across diverse industries, and supportive government policies. The market presents strategic opportunities for companies focusing on innovation, cost reduction, and application diversification. The potential for nanotubes to revolutionize various sectors, including electronics, energy, and healthcare, ensures substantial market potential in the coming years. The market is expected to witness both organic and inorganic growth as new players enter the scene.
Nanotubes Market Segmentation
-
1. Type
- 1.1. Carbon Nanotubes
- 1.2. Silicon Nanotubes
- 1.3. Inorganic Nanotubes
- 1.4. Other Types (Membrane Nanotubes, Etc.)
-
2. Structure Type
- 2.1. Non-polymer Organic Nanomaterials
- 2.2. Polymeric Nanomaterials
-
3. Application
- 3.1. Hydrogen Storage Devices
- 3.2. Sensors
- 3.3. Polymeric Biomaterials
- 3.4. Li-ion Batteries
- 3.5. Luminescent Display Devices
- 3.6. Biosensors
- 3.7. Nanoelectrodes
- 3.8. Water Purification Filters
- 3.9. Semiconductor Devices
- 3.10. Conductive Plastics
-
4. End-user Industry
- 4.1. Healthcare
- 4.2. Electronics
- 4.3. Energy
- 4.4. Automotive
- 4.5. Aerospace and Defense
- 4.6. Textile
- 4.7. Other En
Nanotubes Market Segmentation By Geography
-
1. Asia Pacific
- 1.1. China
- 1.2. India
- 1.3. Japan
- 1.4. South Korea
- 1.5. Rest of Asia Pacific
-
2. North America
- 2.1. United States
- 2.2. Canada
- 2.3. Mexico
-
3. Europe
- 3.1. Germany
- 3.2. United Kingdom
- 3.3. France
- 3.4. Italy
- 3.5. Rest of Europe
-
4. South America
- 4.1. Brazil
- 4.2. Argentina
- 4.3. Rest of South America
-
5. Middle East and Africa
- 5.1. Saudi Arabia
- 5.2. South Africa
- 5.3. Rest of Middle East and Africa
Nanotubes Market Regional Market Share
Geographic Coverage of Nanotubes Market
Nanotubes Market REPORT HIGHLIGHTS
| Aspects | Details |
|---|---|
| Study Period | 2020-2034 |
| Base Year | 2025 |
| Estimated Year | 2026 |
| Forecast Period | 2026-2034 |
| Historical Period | 2020-2025 |
| Growth Rate | CAGR of 19.95% from 2020-2034 |
| Segmentation |
|
Table of Contents
- 1. Introduction
- 1.1. Research Scope
- 1.2. Market Segmentation
- 1.3. Research Objective
- 1.4. Definitions and Assumptions
- 2. Executive Summary
- 2.1. Market Snapshot
- 3. Market Dynamics
- 3.1. Market Drivers
- 3.2. Market Restrains
- 3.3. Market Trends
- 3.4. Market Opportunities
- 4. Market Factor Analysis
- 4.1. Porters Five Forces
- 4.1.1. Bargaining Power of Suppliers
- 4.1.2. Bargaining Power of Buyers
- 4.1.3. Threat of New Entrants
- 4.1.4. Threat of Substitutes
- 4.1.5. Competitive Rivalry
- 4.2. PESTEL analysis
- 4.3. BCG Analysis
- 4.3.1. Stars (High Growth, High Market Share)
- 4.3.2. Cash Cows (Low Growth, High Market Share)
- 4.3.3. Question Mark (High Growth, Low Market Share)
- 4.3.4. Dogs (Low Growth, Low Market Share)
- 4.4. Ansoff Matrix Analysis
- 4.5. Supply Chain Analysis
- 4.6. Regulatory Landscape
- 4.7. Current Market Potential and Opportunity Assessment (TAM–SAM–SOM Framework)
- 4.8. TIR Analyst Note
- 4.1. Porters Five Forces
- 5. Market Analysis, Insights and Forecast 2021-2033
- 5.1. Market Analysis, Insights and Forecast - by Type
- 5.1.1. Carbon Nanotubes
- 5.1.2. Silicon Nanotubes
- 5.1.3. Inorganic Nanotubes
- 5.1.4. Other Types (Membrane Nanotubes, Etc.)
- 5.2. Market Analysis, Insights and Forecast - by Structure Type
- 5.2.1. Non-polymer Organic Nanomaterials
- 5.2.2. Polymeric Nanomaterials
- 5.3. Market Analysis, Insights and Forecast - by Application
- 5.3.1. Hydrogen Storage Devices
- 5.3.2. Sensors
- 5.3.3. Polymeric Biomaterials
- 5.3.4. Li-ion Batteries
- 5.3.5. Luminescent Display Devices
- 5.3.6. Biosensors
- 5.3.7. Nanoelectrodes
- 5.3.8. Water Purification Filters
- 5.3.9. Semiconductor Devices
- 5.3.10. Conductive Plastics
- 5.4. Market Analysis, Insights and Forecast - by End-user Industry
- 5.4.1. Healthcare
- 5.4.2. Electronics
- 5.4.3. Energy
- 5.4.4. Automotive
- 5.4.5. Aerospace and Defense
- 5.4.6. Textile
- 5.4.7. Other En
- 5.5. Market Analysis, Insights and Forecast - by Region
- 5.5.1. Asia Pacific
- 5.5.2. North America
- 5.5.3. Europe
- 5.5.4. South America
- 5.5.5. Middle East and Africa
- 5.1. Market Analysis, Insights and Forecast - by Type
- 6. Global Nanotubes Market Analysis, Insights and Forecast, 2021-2033
- 6.1. Market Analysis, Insights and Forecast - by Type
- 6.1.1. Carbon Nanotubes
- 6.1.2. Silicon Nanotubes
- 6.1.3. Inorganic Nanotubes
- 6.1.4. Other Types (Membrane Nanotubes, Etc.)
- 6.2. Market Analysis, Insights and Forecast - by Structure Type
- 6.2.1. Non-polymer Organic Nanomaterials
- 6.2.2. Polymeric Nanomaterials
- 6.3. Market Analysis, Insights and Forecast - by Application
- 6.3.1. Hydrogen Storage Devices
- 6.3.2. Sensors
- 6.3.3. Polymeric Biomaterials
- 6.3.4. Li-ion Batteries
- 6.3.5. Luminescent Display Devices
- 6.3.6. Biosensors
- 6.3.7. Nanoelectrodes
- 6.3.8. Water Purification Filters
- 6.3.9. Semiconductor Devices
- 6.3.10. Conductive Plastics
- 6.4. Market Analysis, Insights and Forecast - by End-user Industry
- 6.4.1. Healthcare
- 6.4.2. Electronics
- 6.4.3. Energy
- 6.4.4. Automotive
- 6.4.5. Aerospace and Defense
- 6.4.6. Textile
- 6.4.7. Other En
- 6.1. Market Analysis, Insights and Forecast - by Type
- 7. Asia Pacific Nanotubes Market Analysis, Insights and Forecast, 2020-2032
- 7.1. Market Analysis, Insights and Forecast - by Type
- 7.1.1. Carbon Nanotubes
- 7.1.2. Silicon Nanotubes
- 7.1.3. Inorganic Nanotubes
- 7.1.4. Other Types (Membrane Nanotubes, Etc.)
- 7.2. Market Analysis, Insights and Forecast - by Structure Type
- 7.2.1. Non-polymer Organic Nanomaterials
- 7.2.2. Polymeric Nanomaterials
- 7.3. Market Analysis, Insights and Forecast - by Application
- 7.3.1. Hydrogen Storage Devices
- 7.3.2. Sensors
- 7.3.3. Polymeric Biomaterials
- 7.3.4. Li-ion Batteries
- 7.3.5. Luminescent Display Devices
- 7.3.6. Biosensors
- 7.3.7. Nanoelectrodes
- 7.3.8. Water Purification Filters
- 7.3.9. Semiconductor Devices
- 7.3.10. Conductive Plastics
- 7.4. Market Analysis, Insights and Forecast - by End-user Industry
- 7.4.1. Healthcare
- 7.4.2. Electronics
- 7.4.3. Energy
- 7.4.4. Automotive
- 7.4.5. Aerospace and Defense
- 7.4.6. Textile
- 7.4.7. Other En
- 7.1. Market Analysis, Insights and Forecast - by Type
- 8. North America Nanotubes Market Analysis, Insights and Forecast, 2020-2032
- 8.1. Market Analysis, Insights and Forecast - by Type
- 8.1.1. Carbon Nanotubes
- 8.1.2. Silicon Nanotubes
- 8.1.3. Inorganic Nanotubes
- 8.1.4. Other Types (Membrane Nanotubes, Etc.)
- 8.2. Market Analysis, Insights and Forecast - by Structure Type
- 8.2.1. Non-polymer Organic Nanomaterials
- 8.2.2. Polymeric Nanomaterials
- 8.3. Market Analysis, Insights and Forecast - by Application
- 8.3.1. Hydrogen Storage Devices
- 8.3.2. Sensors
- 8.3.3. Polymeric Biomaterials
- 8.3.4. Li-ion Batteries
- 8.3.5. Luminescent Display Devices
- 8.3.6. Biosensors
- 8.3.7. Nanoelectrodes
- 8.3.8. Water Purification Filters
- 8.3.9. Semiconductor Devices
- 8.3.10. Conductive Plastics
- 8.4. Market Analysis, Insights and Forecast - by End-user Industry
- 8.4.1. Healthcare
- 8.4.2. Electronics
- 8.4.3. Energy
- 8.4.4. Automotive
- 8.4.5. Aerospace and Defense
- 8.4.6. Textile
- 8.4.7. Other En
- 8.1. Market Analysis, Insights and Forecast - by Type
- 9. Europe Nanotubes Market Analysis, Insights and Forecast, 2020-2032
- 9.1. Market Analysis, Insights and Forecast - by Type
- 9.1.1. Carbon Nanotubes
- 9.1.2. Silicon Nanotubes
- 9.1.3. Inorganic Nanotubes
- 9.1.4. Other Types (Membrane Nanotubes, Etc.)
- 9.2. Market Analysis, Insights and Forecast - by Structure Type
- 9.2.1. Non-polymer Organic Nanomaterials
- 9.2.2. Polymeric Nanomaterials
- 9.3. Market Analysis, Insights and Forecast - by Application
- 9.3.1. Hydrogen Storage Devices
- 9.3.2. Sensors
- 9.3.3. Polymeric Biomaterials
- 9.3.4. Li-ion Batteries
- 9.3.5. Luminescent Display Devices
- 9.3.6. Biosensors
- 9.3.7. Nanoelectrodes
- 9.3.8. Water Purification Filters
- 9.3.9. Semiconductor Devices
- 9.3.10. Conductive Plastics
- 9.4. Market Analysis, Insights and Forecast - by End-user Industry
- 9.4.1. Healthcare
- 9.4.2. Electronics
- 9.4.3. Energy
- 9.4.4. Automotive
- 9.4.5. Aerospace and Defense
- 9.4.6. Textile
- 9.4.7. Other En
- 9.1. Market Analysis, Insights and Forecast - by Type
- 10. South America Nanotubes Market Analysis, Insights and Forecast, 2020-2032
- 10.1. Market Analysis, Insights and Forecast - by Type
- 10.1.1. Carbon Nanotubes
- 10.1.2. Silicon Nanotubes
- 10.1.3. Inorganic Nanotubes
- 10.1.4. Other Types (Membrane Nanotubes, Etc.)
- 10.2. Market Analysis, Insights and Forecast - by Structure Type
- 10.2.1. Non-polymer Organic Nanomaterials
- 10.2.2. Polymeric Nanomaterials
- 10.3. Market Analysis, Insights and Forecast - by Application
- 10.3.1. Hydrogen Storage Devices
- 10.3.2. Sensors
- 10.3.3. Polymeric Biomaterials
- 10.3.4. Li-ion Batteries
- 10.3.5. Luminescent Display Devices
- 10.3.6. Biosensors
- 10.3.7. Nanoelectrodes
- 10.3.8. Water Purification Filters
- 10.3.9. Semiconductor Devices
- 10.3.10. Conductive Plastics
- 10.4. Market Analysis, Insights and Forecast - by End-user Industry
- 10.4.1. Healthcare
- 10.4.2. Electronics
- 10.4.3. Energy
- 10.4.4. Automotive
- 10.4.5. Aerospace and Defense
- 10.4.6. Textile
- 10.4.7. Other En
- 10.1. Market Analysis, Insights and Forecast - by Type
- 11. Middle East and Africa Nanotubes Market Analysis, Insights and Forecast, 2020-2032
- 11.1. Market Analysis, Insights and Forecast - by Type
- 11.1.1. Carbon Nanotubes
- 11.1.2. Silicon Nanotubes
- 11.1.3. Inorganic Nanotubes
- 11.1.4. Other Types (Membrane Nanotubes, Etc.)
- 11.2. Market Analysis, Insights and Forecast - by Structure Type
- 11.2.1. Non-polymer Organic Nanomaterials
- 11.2.2. Polymeric Nanomaterials
- 11.3. Market Analysis, Insights and Forecast - by Application
- 11.3.1. Hydrogen Storage Devices
- 11.3.2. Sensors
- 11.3.3. Polymeric Biomaterials
- 11.3.4. Li-ion Batteries
- 11.3.5. Luminescent Display Devices
- 11.3.6. Biosensors
- 11.3.7. Nanoelectrodes
- 11.3.8. Water Purification Filters
- 11.3.9. Semiconductor Devices
- 11.3.10. Conductive Plastics
- 11.4. Market Analysis, Insights and Forecast - by End-user Industry
- 11.4.1. Healthcare
- 11.4.2. Electronics
- 11.4.3. Energy
- 11.4.4. Automotive
- 11.4.5. Aerospace and Defense
- 11.4.6. Textile
- 11.4.7. Other En
- 11.1. Market Analysis, Insights and Forecast - by Type
- 12. Competitive Analysis
- 12.1. Company Profiles
- 12.1.1 Jiangsu Cnano Technology Co Ltd
- 12.1.1.1. Company Overview
- 12.1.1.2. Products
- 12.1.1.3. Company Financials
- 12.1.1.4. SWOT Analysis
- 12.1.2 Nanoshel LLC
- 12.1.2.1. Company Overview
- 12.1.2.2. Products
- 12.1.2.3. Company Financials
- 12.1.2.4. SWOT Analysis
- 12.1.3 Arkema
- 12.1.3.1. Company Overview
- 12.1.3.2. Products
- 12.1.3.3. Company Financials
- 12.1.3.4. SWOT Analysis
- 12.1.4 NanoIntegris Inc
- 12.1.4.1. Company Overview
- 12.1.4.2. Products
- 12.1.4.3. Company Financials
- 12.1.4.4. SWOT Analysis
- 12.1.5 LG Chem
- 12.1.5.1. Company Overview
- 12.1.5.2. Products
- 12.1.5.3. Company Financials
- 12.1.5.4. SWOT Analysis
- 12.1.6 Cheap Tubes
- 12.1.6.1. Company Overview
- 12.1.6.2. Products
- 12.1.6.3. Company Financials
- 12.1.6.4. SWOT Analysis
- 12.1.7 Carbon Solutions Inc
- 12.1.7.1. Company Overview
- 12.1.7.2. Products
- 12.1.7.3. Company Financials
- 12.1.7.4. SWOT Analysis
- 12.1.8 Hyperion Catalysis International
- 12.1.8.1. Company Overview
- 12.1.8.2. Products
- 12.1.8.3. Company Financials
- 12.1.8.4. SWOT Analysis
- 12.1.9 Resonac Holdings Corporation
- 12.1.9.1. Company Overview
- 12.1.9.2. Products
- 12.1.9.3. Company Financials
- 12.1.9.4. SWOT Analysis
- 12.1.10 Nano-C
- 12.1.10.1. Company Overview
- 12.1.10.2. Products
- 12.1.10.3. Company Financials
- 12.1.10.4. SWOT Analysis
- 12.1.11 Thomas Swan & Co Ltd
- 12.1.11.1. Company Overview
- 12.1.11.2. Products
- 12.1.11.3. Company Financials
- 12.1.11.4. SWOT Analysis
- 12.1.12 Nanocyl SA (Birla Carbon)
- 12.1.12.1. Company Overview
- 12.1.12.2. Products
- 12.1.12.3. Company Financials
- 12.1.12.4. SWOT Analysis
- 12.1.1 Jiangsu Cnano Technology Co Ltd
- 12.2. Market Entropy
- 12.2.1 Company's Key Areas Served
- 12.2.2 Recent Developments
- 12.3. Company Market Share Analysis 2025
- 12.3.1 Top 5 Companies Market Share Analysis
- 12.3.2 Top 3 Companies Market Share Analysis
- 12.4. List of Potential Customers
- 13. Research Methodology
List of Figures
- Figure 1: Global Nanotubes Market Revenue Breakdown (Million, %) by Region 2025 & 2033
- Figure 2: Global Nanotubes Market Volume Breakdown (K Tons, %) by Region 2025 & 2033
- Figure 3: Asia Pacific Nanotubes Market Revenue (Million), by Type 2025 & 2033
- Figure 4: Asia Pacific Nanotubes Market Volume (K Tons), by Type 2025 & 2033
- Figure 5: Asia Pacific Nanotubes Market Revenue Share (%), by Type 2025 & 2033
- Figure 6: Asia Pacific Nanotubes Market Volume Share (%), by Type 2025 & 2033
- Figure 7: Asia Pacific Nanotubes Market Revenue (Million), by Structure Type 2025 & 2033
- Figure 8: Asia Pacific Nanotubes Market Volume (K Tons), by Structure Type 2025 & 2033
- Figure 9: Asia Pacific Nanotubes Market Revenue Share (%), by Structure Type 2025 & 2033
- Figure 10: Asia Pacific Nanotubes Market Volume Share (%), by Structure Type 2025 & 2033
- Figure 11: Asia Pacific Nanotubes Market Revenue (Million), by Application 2025 & 2033
- Figure 12: Asia Pacific Nanotubes Market Volume (K Tons), by Application 2025 & 2033
- Figure 13: Asia Pacific Nanotubes Market Revenue Share (%), by Application 2025 & 2033
- Figure 14: Asia Pacific Nanotubes Market Volume Share (%), by Application 2025 & 2033
- Figure 15: Asia Pacific Nanotubes Market Revenue (Million), by End-user Industry 2025 & 2033
- Figure 16: Asia Pacific Nanotubes Market Volume (K Tons), by End-user Industry 2025 & 2033
- Figure 17: Asia Pacific Nanotubes Market Revenue Share (%), by End-user Industry 2025 & 2033
- Figure 18: Asia Pacific Nanotubes Market Volume Share (%), by End-user Industry 2025 & 2033
- Figure 19: Asia Pacific Nanotubes Market Revenue (Million), by Country 2025 & 2033
- Figure 20: Asia Pacific Nanotubes Market Volume (K Tons), by Country 2025 & 2033
- Figure 21: Asia Pacific Nanotubes Market Revenue Share (%), by Country 2025 & 2033
- Figure 22: Asia Pacific Nanotubes Market Volume Share (%), by Country 2025 & 2033
- Figure 23: North America Nanotubes Market Revenue (Million), by Type 2025 & 2033
- Figure 24: North America Nanotubes Market Volume (K Tons), by Type 2025 & 2033
- Figure 25: North America Nanotubes Market Revenue Share (%), by Type 2025 & 2033
- Figure 26: North America Nanotubes Market Volume Share (%), by Type 2025 & 2033
- Figure 27: North America Nanotubes Market Revenue (Million), by Structure Type 2025 & 2033
- Figure 28: North America Nanotubes Market Volume (K Tons), by Structure Type 2025 & 2033
- Figure 29: North America Nanotubes Market Revenue Share (%), by Structure Type 2025 & 2033
- Figure 30: North America Nanotubes Market Volume Share (%), by Structure Type 2025 & 2033
- Figure 31: North America Nanotubes Market Revenue (Million), by Application 2025 & 2033
- Figure 32: North America Nanotubes Market Volume (K Tons), by Application 2025 & 2033
- Figure 33: North America Nanotubes Market Revenue Share (%), by Application 2025 & 2033
- Figure 34: North America Nanotubes Market Volume Share (%), by Application 2025 & 2033
- Figure 35: North America Nanotubes Market Revenue (Million), by End-user Industry 2025 & 2033
- Figure 36: North America Nanotubes Market Volume (K Tons), by End-user Industry 2025 & 2033
- Figure 37: North America Nanotubes Market Revenue Share (%), by End-user Industry 2025 & 2033
- Figure 38: North America Nanotubes Market Volume Share (%), by End-user Industry 2025 & 2033
- Figure 39: North America Nanotubes Market Revenue (Million), by Country 2025 & 2033
- Figure 40: North America Nanotubes Market Volume (K Tons), by Country 2025 & 2033
- Figure 41: North America Nanotubes Market Revenue Share (%), by Country 2025 & 2033
- Figure 42: North America Nanotubes Market Volume Share (%), by Country 2025 & 2033
- Figure 43: Europe Nanotubes Market Revenue (Million), by Type 2025 & 2033
- Figure 44: Europe Nanotubes Market Volume (K Tons), by Type 2025 & 2033
- Figure 45: Europe Nanotubes Market Revenue Share (%), by Type 2025 & 2033
- Figure 46: Europe Nanotubes Market Volume Share (%), by Type 2025 & 2033
- Figure 47: Europe Nanotubes Market Revenue (Million), by Structure Type 2025 & 2033
- Figure 48: Europe Nanotubes Market Volume (K Tons), by Structure Type 2025 & 2033
- Figure 49: Europe Nanotubes Market Revenue Share (%), by Structure Type 2025 & 2033
- Figure 50: Europe Nanotubes Market Volume Share (%), by Structure Type 2025 & 2033
- Figure 51: Europe Nanotubes Market Revenue (Million), by Application 2025 & 2033
- Figure 52: Europe Nanotubes Market Volume (K Tons), by Application 2025 & 2033
- Figure 53: Europe Nanotubes Market Revenue Share (%), by Application 2025 & 2033
- Figure 54: Europe Nanotubes Market Volume Share (%), by Application 2025 & 2033
- Figure 55: Europe Nanotubes Market Revenue (Million), by End-user Industry 2025 & 2033
- Figure 56: Europe Nanotubes Market Volume (K Tons), by End-user Industry 2025 & 2033
- Figure 57: Europe Nanotubes Market Revenue Share (%), by End-user Industry 2025 & 2033
- Figure 58: Europe Nanotubes Market Volume Share (%), by End-user Industry 2025 & 2033
- Figure 59: Europe Nanotubes Market Revenue (Million), by Country 2025 & 2033
- Figure 60: Europe Nanotubes Market Volume (K Tons), by Country 2025 & 2033
- Figure 61: Europe Nanotubes Market Revenue Share (%), by Country 2025 & 2033
- Figure 62: Europe Nanotubes Market Volume Share (%), by Country 2025 & 2033
- Figure 63: South America Nanotubes Market Revenue (Million), by Type 2025 & 2033
- Figure 64: South America Nanotubes Market Volume (K Tons), by Type 2025 & 2033
- Figure 65: South America Nanotubes Market Revenue Share (%), by Type 2025 & 2033
- Figure 66: South America Nanotubes Market Volume Share (%), by Type 2025 & 2033
- Figure 67: South America Nanotubes Market Revenue (Million), by Structure Type 2025 & 2033
- Figure 68: South America Nanotubes Market Volume (K Tons), by Structure Type 2025 & 2033
- Figure 69: South America Nanotubes Market Revenue Share (%), by Structure Type 2025 & 2033
- Figure 70: South America Nanotubes Market Volume Share (%), by Structure Type 2025 & 2033
- Figure 71: South America Nanotubes Market Revenue (Million), by Application 2025 & 2033
- Figure 72: South America Nanotubes Market Volume (K Tons), by Application 2025 & 2033
- Figure 73: South America Nanotubes Market Revenue Share (%), by Application 2025 & 2033
- Figure 74: South America Nanotubes Market Volume Share (%), by Application 2025 & 2033
- Figure 75: South America Nanotubes Market Revenue (Million), by End-user Industry 2025 & 2033
- Figure 76: South America Nanotubes Market Volume (K Tons), by End-user Industry 2025 & 2033
- Figure 77: South America Nanotubes Market Revenue Share (%), by End-user Industry 2025 & 2033
- Figure 78: South America Nanotubes Market Volume Share (%), by End-user Industry 2025 & 2033
- Figure 79: South America Nanotubes Market Revenue (Million), by Country 2025 & 2033
- Figure 80: South America Nanotubes Market Volume (K Tons), by Country 2025 & 2033
- Figure 81: South America Nanotubes Market Revenue Share (%), by Country 2025 & 2033
- Figure 82: South America Nanotubes Market Volume Share (%), by Country 2025 & 2033
- Figure 83: Middle East and Africa Nanotubes Market Revenue (Million), by Type 2025 & 2033
- Figure 84: Middle East and Africa Nanotubes Market Volume (K Tons), by Type 2025 & 2033
- Figure 85: Middle East and Africa Nanotubes Market Revenue Share (%), by Type 2025 & 2033
- Figure 86: Middle East and Africa Nanotubes Market Volume Share (%), by Type 2025 & 2033
- Figure 87: Middle East and Africa Nanotubes Market Revenue (Million), by Structure Type 2025 & 2033
- Figure 88: Middle East and Africa Nanotubes Market Volume (K Tons), by Structure Type 2025 & 2033
- Figure 89: Middle East and Africa Nanotubes Market Revenue Share (%), by Structure Type 2025 & 2033
- Figure 90: Middle East and Africa Nanotubes Market Volume Share (%), by Structure Type 2025 & 2033
- Figure 91: Middle East and Africa Nanotubes Market Revenue (Million), by Application 2025 & 2033
- Figure 92: Middle East and Africa Nanotubes Market Volume (K Tons), by Application 2025 & 2033
- Figure 93: Middle East and Africa Nanotubes Market Revenue Share (%), by Application 2025 & 2033
- Figure 94: Middle East and Africa Nanotubes Market Volume Share (%), by Application 2025 & 2033
- Figure 95: Middle East and Africa Nanotubes Market Revenue (Million), by End-user Industry 2025 & 2033
- Figure 96: Middle East and Africa Nanotubes Market Volume (K Tons), by End-user Industry 2025 & 2033
- Figure 97: Middle East and Africa Nanotubes Market Revenue Share (%), by End-user Industry 2025 & 2033
- Figure 98: Middle East and Africa Nanotubes Market Volume Share (%), by End-user Industry 2025 & 2033
- Figure 99: Middle East and Africa Nanotubes Market Revenue (Million), by Country 2025 & 2033
- Figure 100: Middle East and Africa Nanotubes Market Volume (K Tons), by Country 2025 & 2033
- Figure 101: Middle East and Africa Nanotubes Market Revenue Share (%), by Country 2025 & 2033
- Figure 102: Middle East and Africa Nanotubes Market Volume Share (%), by Country 2025 & 2033
List of Tables
- Table 1: Global Nanotubes Market Revenue Million Forecast, by Type 2020 & 2033
- Table 2: Global Nanotubes Market Volume K Tons Forecast, by Type 2020 & 2033
- Table 3: Global Nanotubes Market Revenue Million Forecast, by Structure Type 2020 & 2033
- Table 4: Global Nanotubes Market Volume K Tons Forecast, by Structure Type 2020 & 2033
- Table 5: Global Nanotubes Market Revenue Million Forecast, by Application 2020 & 2033
- Table 6: Global Nanotubes Market Volume K Tons Forecast, by Application 2020 & 2033
- Table 7: Global Nanotubes Market Revenue Million Forecast, by End-user Industry 2020 & 2033
- Table 8: Global Nanotubes Market Volume K Tons Forecast, by End-user Industry 2020 & 2033
- Table 9: Global Nanotubes Market Revenue Million Forecast, by Region 2020 & 2033
- Table 10: Global Nanotubes Market Volume K Tons Forecast, by Region 2020 & 2033
- Table 11: Global Nanotubes Market Revenue Million Forecast, by Type 2020 & 2033
- Table 12: Global Nanotubes Market Volume K Tons Forecast, by Type 2020 & 2033
- Table 13: Global Nanotubes Market Revenue Million Forecast, by Structure Type 2020 & 2033
- Table 14: Global Nanotubes Market Volume K Tons Forecast, by Structure Type 2020 & 2033
- Table 15: Global Nanotubes Market Revenue Million Forecast, by Application 2020 & 2033
- Table 16: Global Nanotubes Market Volume K Tons Forecast, by Application 2020 & 2033
- Table 17: Global Nanotubes Market Revenue Million Forecast, by End-user Industry 2020 & 2033
- Table 18: Global Nanotubes Market Volume K Tons Forecast, by End-user Industry 2020 & 2033
- Table 19: Global Nanotubes Market Revenue Million Forecast, by Country 2020 & 2033
- Table 20: Global Nanotubes Market Volume K Tons Forecast, by Country 2020 & 2033
- Table 21: China Nanotubes Market Revenue (Million) Forecast, by Application 2020 & 2033
- Table 22: China Nanotubes Market Volume (K Tons) Forecast, by Application 2020 & 2033
- Table 23: India Nanotubes Market Revenue (Million) Forecast, by Application 2020 & 2033
- Table 24: India Nanotubes Market Volume (K Tons) Forecast, by Application 2020 & 2033
- Table 25: Japan Nanotubes Market Revenue (Million) Forecast, by Application 2020 & 2033
- Table 26: Japan Nanotubes Market Volume (K Tons) Forecast, by Application 2020 & 2033
- Table 27: South Korea Nanotubes Market Revenue (Million) Forecast, by Application 2020 & 2033
- Table 28: South Korea Nanotubes Market Volume (K Tons) Forecast, by Application 2020 & 2033
- Table 29: Rest of Asia Pacific Nanotubes Market Revenue (Million) Forecast, by Application 2020 & 2033
- Table 30: Rest of Asia Pacific Nanotubes Market Volume (K Tons) Forecast, by Application 2020 & 2033
- Table 31: Global Nanotubes Market Revenue Million Forecast, by Type 2020 & 2033
- Table 32: Global Nanotubes Market Volume K Tons Forecast, by Type 2020 & 2033
- Table 33: Global Nanotubes Market Revenue Million Forecast, by Structure Type 2020 & 2033
- Table 34: Global Nanotubes Market Volume K Tons Forecast, by Structure Type 2020 & 2033
- Table 35: Global Nanotubes Market Revenue Million Forecast, by Application 2020 & 2033
- Table 36: Global Nanotubes Market Volume K Tons Forecast, by Application 2020 & 2033
- Table 37: Global Nanotubes Market Revenue Million Forecast, by End-user Industry 2020 & 2033
- Table 38: Global Nanotubes Market Volume K Tons Forecast, by End-user Industry 2020 & 2033
- Table 39: Global Nanotubes Market Revenue Million Forecast, by Country 2020 & 2033
- Table 40: Global Nanotubes Market Volume K Tons Forecast, by Country 2020 & 2033
- Table 41: United States Nanotubes Market Revenue (Million) Forecast, by Application 2020 & 2033
- Table 42: United States Nanotubes Market Volume (K Tons) Forecast, by Application 2020 & 2033
- Table 43: Canada Nanotubes Market Revenue (Million) Forecast, by Application 2020 & 2033
- Table 44: Canada Nanotubes Market Volume (K Tons) Forecast, by Application 2020 & 2033
- Table 45: Mexico Nanotubes Market Revenue (Million) Forecast, by Application 2020 & 2033
- Table 46: Mexico Nanotubes Market Volume (K Tons) Forecast, by Application 2020 & 2033
- Table 47: Global Nanotubes Market Revenue Million Forecast, by Type 2020 & 2033
- Table 48: Global Nanotubes Market Volume K Tons Forecast, by Type 2020 & 2033
- Table 49: Global Nanotubes Market Revenue Million Forecast, by Structure Type 2020 & 2033
- Table 50: Global Nanotubes Market Volume K Tons Forecast, by Structure Type 2020 & 2033
- Table 51: Global Nanotubes Market Revenue Million Forecast, by Application 2020 & 2033
- Table 52: Global Nanotubes Market Volume K Tons Forecast, by Application 2020 & 2033
- Table 53: Global Nanotubes Market Revenue Million Forecast, by End-user Industry 2020 & 2033
- Table 54: Global Nanotubes Market Volume K Tons Forecast, by End-user Industry 2020 & 2033
- Table 55: Global Nanotubes Market Revenue Million Forecast, by Country 2020 & 2033
- Table 56: Global Nanotubes Market Volume K Tons Forecast, by Country 2020 & 2033
- Table 57: Germany Nanotubes Market Revenue (Million) Forecast, by Application 2020 & 2033
- Table 58: Germany Nanotubes Market Volume (K Tons) Forecast, by Application 2020 & 2033
- Table 59: United Kingdom Nanotubes Market Revenue (Million) Forecast, by Application 2020 & 2033
- Table 60: United Kingdom Nanotubes Market Volume (K Tons) Forecast, by Application 2020 & 2033
- Table 61: France Nanotubes Market Revenue (Million) Forecast, by Application 2020 & 2033
- Table 62: France Nanotubes Market Volume (K Tons) Forecast, by Application 2020 & 2033
- Table 63: Italy Nanotubes Market Revenue (Million) Forecast, by Application 2020 & 2033
- Table 64: Italy Nanotubes Market Volume (K Tons) Forecast, by Application 2020 & 2033
- Table 65: Rest of Europe Nanotubes Market Revenue (Million) Forecast, by Application 2020 & 2033
- Table 66: Rest of Europe Nanotubes Market Volume (K Tons) Forecast, by Application 2020 & 2033
- Table 67: Global Nanotubes Market Revenue Million Forecast, by Type 2020 & 2033
- Table 68: Global Nanotubes Market Volume K Tons Forecast, by Type 2020 & 2033
- Table 69: Global Nanotubes Market Revenue Million Forecast, by Structure Type 2020 & 2033
- Table 70: Global Nanotubes Market Volume K Tons Forecast, by Structure Type 2020 & 2033
- Table 71: Global Nanotubes Market Revenue Million Forecast, by Application 2020 & 2033
- Table 72: Global Nanotubes Market Volume K Tons Forecast, by Application 2020 & 2033
- Table 73: Global Nanotubes Market Revenue Million Forecast, by End-user Industry 2020 & 2033
- Table 74: Global Nanotubes Market Volume K Tons Forecast, by End-user Industry 2020 & 2033
- Table 75: Global Nanotubes Market Revenue Million Forecast, by Country 2020 & 2033
- Table 76: Global Nanotubes Market Volume K Tons Forecast, by Country 2020 & 2033
- Table 77: Brazil Nanotubes Market Revenue (Million) Forecast, by Application 2020 & 2033
- Table 78: Brazil Nanotubes Market Volume (K Tons) Forecast, by Application 2020 & 2033
- Table 79: Argentina Nanotubes Market Revenue (Million) Forecast, by Application 2020 & 2033
- Table 80: Argentina Nanotubes Market Volume (K Tons) Forecast, by Application 2020 & 2033
- Table 81: Rest of South America Nanotubes Market Revenue (Million) Forecast, by Application 2020 & 2033
- Table 82: Rest of South America Nanotubes Market Volume (K Tons) Forecast, by Application 2020 & 2033
- Table 83: Global Nanotubes Market Revenue Million Forecast, by Type 2020 & 2033
- Table 84: Global Nanotubes Market Volume K Tons Forecast, by Type 2020 & 2033
- Table 85: Global Nanotubes Market Revenue Million Forecast, by Structure Type 2020 & 2033
- Table 86: Global Nanotubes Market Volume K Tons Forecast, by Structure Type 2020 & 2033
- Table 87: Global Nanotubes Market Revenue Million Forecast, by Application 2020 & 2033
- Table 88: Global Nanotubes Market Volume K Tons Forecast, by Application 2020 & 2033
- Table 89: Global Nanotubes Market Revenue Million Forecast, by End-user Industry 2020 & 2033
- Table 90: Global Nanotubes Market Volume K Tons Forecast, by End-user Industry 2020 & 2033
- Table 91: Global Nanotubes Market Revenue Million Forecast, by Country 2020 & 2033
- Table 92: Global Nanotubes Market Volume K Tons Forecast, by Country 2020 & 2033
- Table 93: Saudi Arabia Nanotubes Market Revenue (Million) Forecast, by Application 2020 & 2033
- Table 94: Saudi Arabia Nanotubes Market Volume (K Tons) Forecast, by Application 2020 & 2033
- Table 95: South Africa Nanotubes Market Revenue (Million) Forecast, by Application 2020 & 2033
- Table 96: South Africa Nanotubes Market Volume (K Tons) Forecast, by Application 2020 & 2033
- Table 97: Rest of Middle East and Africa Nanotubes Market Revenue (Million) Forecast, by Application 2020 & 2033
- Table 98: Rest of Middle East and Africa Nanotubes Market Volume (K Tons) Forecast, by Application 2020 & 2033
Frequently Asked Questions
1. What is the projected Compound Annual Growth Rate (CAGR) of the Nanotubes Market?
The projected CAGR is approximately 19.95%.
2. Which companies are prominent players in the Nanotubes Market?
Key companies in the market include Jiangsu Cnano Technology Co Ltd, Nanoshel LLC, Arkema, NanoIntegris Inc, LG Chem, Cheap Tubes, Carbon Solutions Inc, Hyperion Catalysis International, Resonac Holdings Corporation, Nano-C, Thomas Swan & Co Ltd, Nanocyl SA (Birla Carbon).
3. What are the main segments of the Nanotubes Market?
The market segments include Type, Structure Type, Application, End-user Industry.
4. Can you provide details about the market size?
The market size is estimated to be USD 7.98 Million as of 2022.
5. What are some drivers contributing to market growth?
Advancement in Nanotubes Technologies; Growing Adoption of Carbon Nanotubes; Other Drivers.
6. What are the notable trends driving market growth?
Electronics and Semiconductor Segment to Dominate the Market Demand.
7. Are there any restraints impacting market growth?
High Manufacturing and R&D Cost; Other Restraints.
8. Can you provide examples of recent developments in the market?
October 2023: Birla Carbon (Aditya Birla Group) acquired Nanocyl SA to enhance its growth in battery materials for lithium-ion batteries, which will add value to its nanotubes business segment.
9. What pricing options are available for accessing the report?
Pricing options include single-user, multi-user, and enterprise licenses priced at USD 4750, USD 5250, and USD 8750 respectively.
10. Is the market size provided in terms of value or volume?
The market size is provided in terms of value, measured in Million and volume, measured in K Tons.
11. Are there any specific market keywords associated with the report?
Yes, the market keyword associated with the report is "Nanotubes Market," which aids in identifying and referencing the specific market segment covered.
12. How do I determine which pricing option suits my needs best?
The pricing options vary based on user requirements and access needs. Individual users may opt for single-user licenses, while businesses requiring broader access may choose multi-user or enterprise licenses for cost-effective access to the report.
13. Are there any additional resources or data provided in the Nanotubes Market report?
While the report offers comprehensive insights, it's advisable to review the specific contents or supplementary materials provided to ascertain if additional resources or data are available.
14. How can I stay updated on further developments or reports in the Nanotubes Market?
To stay informed about further developments, trends, and reports in the Nanotubes Market, consider subscribing to industry newsletters, following relevant companies and organizations, or regularly checking reputable industry news sources and publications.
Methodology
Step 1 - Identification of Relevant Samples Size from Population Database


Step 2 - Approaches for Defining Global Market Size (Value, Volume* & Price*)

Note*: In applicable scenarios
Step 3 - Data Sources
Primary Research
- Web Analytics
- Survey Reports
- Research Institute
- Latest Research Reports
- Opinion Leaders
Secondary Research
- Annual Reports
- White Paper
- Latest Press Release
- Industry Association
- Paid Database
- Investor Presentations

Step 4 - Data Triangulation
Involves using different sources of information in order to increase the validity of a study
These sources are likely to be stakeholders in a program - participants, other researchers, program staff, other community members, and so on.
Then we put all data in single framework & apply various statistical tools to find out the dynamic on the market.
During the analysis stage, feedback from the stakeholder groups would be compared to determine areas of agreement as well as areas of divergence