

Key Insights
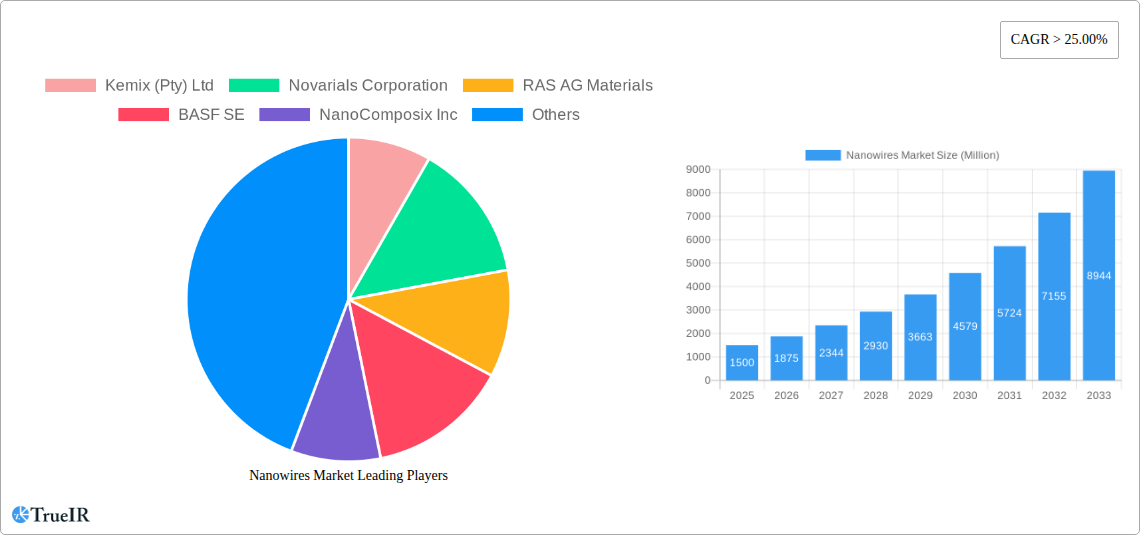
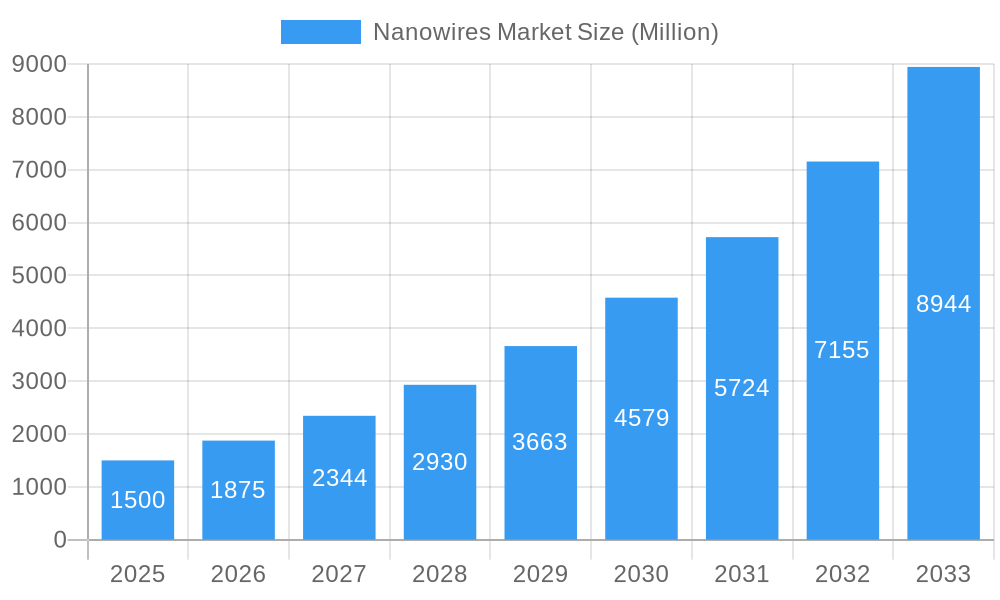
The global nanowires market is experiencing robust growth, driven by escalating demand across diverse sectors. A compound annual growth rate (CAGR) exceeding 25% from 2019 to 2033 signifies a significant expansion, with the market value expected to reach substantial figures by 2033. Key drivers include the increasing adoption of nanowires in advanced electronics, particularly in consumer electronics like smartphones and wearable technology, where their unique electrical and optical properties offer performance enhancements. Furthermore, the burgeoning field of chemical and biological sensors is significantly contributing to market expansion, as nanowires provide high sensitivity and selectivity for various applications, including healthcare diagnostics and environmental monitoring. The market segmentation reveals strong growth across multiple types, including metal, semiconductor, and oxide nanowires, with semiconductor nanowires likely leading due to their prevalent use in electronics. Growth is also fueled by continuous research and development, leading to innovations in applications like solar cells, where nanowires improve energy conversion efficiency. While potential restraints such as high manufacturing costs and regulatory hurdles exist, ongoing technological advancements and increasing investments are expected to mitigate these challenges, ensuring sustained market expansion.
Nanowires Market Market Size (In Billion)
The geographical distribution of the nanowires market reflects the global technological landscape. The Asia-Pacific region, particularly China and India, is expected to dominate due to substantial manufacturing capabilities and increasing investments in nanotechnology research. North America and Europe also maintain significant market shares, driven by strong R&D activities and robust consumer electronics markets. However, emerging economies in South America and the Middle East are projected to witness considerable growth, fueled by expanding industrialization and infrastructure development. The competitive landscape is dynamic, featuring both established players like BASF SE and emerging companies specializing in nanomaterial synthesis and application development. This competition fosters innovation and drives down prices, making nanowires more accessible across various industries. The market's trajectory indicates a promising future for nanowires, with continued expansion driven by technological advancements and broadening applications across various sectors.
Nanowires Market Company Market Share
Nanowires Market: A Comprehensive Report (2019-2033)
This dynamic report provides a detailed analysis of the global Nanowires Market, offering invaluable insights for stakeholders seeking to understand market trends, competitive dynamics, and future growth opportunities. With a study period spanning 2019-2033, a base year of 2025, and a forecast period of 2025-2033, this report leverages extensive data and expert analysis to deliver a comprehensive overview of this rapidly evolving market. The global market size is projected to reach xx Million by 2033, exhibiting a CAGR of xx% during the forecast period.
Nanowires Market Market Structure & Competitive Landscape
The Nanowires market exhibits a moderately concentrated structure, with key players such as BASF SE, NanoComposix Inc., and Cambrios Technologies Corporation holding significant market share. However, the presence of numerous smaller, specialized companies indicates a dynamic competitive landscape. Innovation in nanomaterial synthesis and processing techniques, coupled with advancements in characterization methods, are key drivers of market growth. Regulatory frameworks concerning nanomaterial safety and environmental impact increasingly influence market development, presenting both opportunities and challenges. Product substitutes, such as carbon nanotubes and graphene, exert competitive pressure, while ongoing mergers and acquisitions (M&A) activities reshape market dynamics. The total M&A volume in the sector from 2019 to 2024 is estimated at xx Million. End-user segmentation, dominated by the electronics and consumer electronics sectors, continues to evolve, driven by miniaturization trends and increasing demand for high-performance devices.
- Market Concentration: The Herfindahl-Hirschman Index (HHI) is estimated at xx, suggesting a moderately concentrated market.
- Innovation Drivers: Advances in nanofabrication, surface functionalization, and material characterization.
- Regulatory Impacts: Growing emphasis on nanomaterial safety and environmental regulations.
- Product Substitutes: Carbon nanotubes, graphene, and other advanced materials.
- End-User Segmentation: Consumer electronics, chemical and biological sensors, electronics, solar cells, and other applications.
- M&A Trends: Consolidation expected to continue, driven by economies of scale and technology acquisition.
Nanowires Market Market Trends & Opportunities
The Nanowires market is experiencing robust growth fueled by the increasing demand for miniaturized and high-performance electronic devices. Technological advancements in synthesis and processing techniques are leading to improved material properties, such as enhanced conductivity and tunable optical characteristics. Consumer preferences for smaller, faster, and more energy-efficient electronics are directly impacting market demand. The competitive landscape is marked by intense R&D activities, strategic partnerships, and collaborations aimed at developing innovative nanowire-based products and applications. Market penetration is particularly high in developed economies, although emerging markets present significant untapped potential. The projected market size is expected to reach xx Million in 2025, with a projected growth of xx% annually.
Dominant Markets & Segments in Nanowires Market
The dominant segment in the Nanowires market is currently the Consumer Electronics application, specifically in smartphones and other portable devices. The Metal Nanowires type holds a significant market share due to its superior electrical conductivity and ease of integration into existing manufacturing processes. Geographically, North America currently leads the market, driven by strong technological advancements and substantial R&D investments.
- Key Growth Drivers in Consumer Electronics:
- Increasing demand for high-performance smartphones and other portable devices.
- Miniaturization of electronic components.
- Need for advanced display technologies.
- Key Growth Drivers in Metal Nanowires:
- Superior electrical conductivity.
- Ease of integration into existing manufacturing processes.
- Cost-effectiveness compared to other nanowire types.
- Geographic Dominance: North America
- Strong technological base and R&D infrastructure.
- High adoption of advanced electronics.
- Presence of major market players.
Nanowires Market Product Analysis
Product innovation in the nanowires market focuses on enhancing material properties, improving manufacturing processes, and expanding applications. Recent advancements include the development of high-aspect-ratio nanowires with enhanced conductivity and improved control over surface functionalization. This enables wider adoption in various sectors, leading to greater market penetration. The competitive advantage lies in the ability to tailor nanowire properties to specific application requirements, offering superior performance and cost-effectiveness compared to traditional materials.
Key Drivers, Barriers & Challenges in Nanowires Market
Key Drivers: The primary drivers for Nanowires market growth include technological advancements in synthesis and fabrication, the increasing demand for miniaturized and high-performance electronics, and the growing adoption of nanotechnology across diverse applications. Government funding and policy support for nanotechnology research and development also play a significant role.
Challenges: Challenges include the high cost of production, potential toxicity concerns, and regulatory uncertainties surrounding nanomaterials. Supply chain complexities and the need for standardized testing and characterization methods also pose significant hurdles. The competitive pressure from substitute materials further restricts market growth. The estimated cost of regulatory compliance is projected at xx Million annually.
Growth Drivers in the Nanowires Market Market
Technological advancements, particularly in synthesis and fabrication techniques, are a key driver. Increasing demand for miniaturized electronics and the growing adoption of nanotechnology across diverse applications further stimulate growth. Supportive government policies and funding for nanotechnology research contribute significantly.
Challenges Impacting Nanowires Market Growth
High production costs, concerns about the toxicity of certain nanowires, and the lack of standardized testing procedures hinder growth. Regulatory uncertainties and supply chain complexities also pose significant barriers.
Key Players Shaping the Nanowires Market Market
- BASF SE
- NanoComposix Inc
- Kemix (Pty) Ltd
- Novarials Corporation
- RAS AG Materials
- Minnesota Wire Company
- Nanostructured and Amorphous Materials Inc
- ACS Materials LLC
- US Nano
- Blue Nano Inc
- Cambrios Technologies Corporation
Significant Nanowires Market Industry Milestones
- 2020-Q4: BASF SE announces a new production facility for high-purity metal nanowires.
- 2021-Q2: NanoComposix Inc. launches a new line of functionalized nanowires for biosensing applications.
- 2022-Q3: Cambrios Technologies Corporation announces a strategic partnership to develop nanowire-based solar cells.
- 2023-Q1: A major merger occurs between two smaller nanowire manufacturers. (Further details unavailable - xx)
Future Outlook for Nanowires Market Market
The future of the Nanowires market appears bright, driven by continued technological advancements, increasing demand from diverse sectors, and supportive government policies. Strategic partnerships and collaborations will play a crucial role in fostering innovation and accelerating market penetration. The significant market potential across diverse sectors promises substantial growth in the coming years.
Nanowires Market Segmentation
-
1. Type
- 1.1. Metal Nanowires
- 1.2. Semiconductor Nanowires
- 1.3. Oxide Nanowires
- 1.4. Multi-Segment Nanowires
- 1.5. Semiconductor Quantum Wires
-
2. Application
- 2.1. Consumer Electronics
- 2.2. Chemical and Biological sensors
- 2.3. Solar Cells
- 2.4. Other Applications
Nanowires Market Segmentation By Geography
-
1. Asia Pacific
- 1.1. China
- 1.2. India
- 1.3. Japan
- 1.4. South Korea
- 1.5. Rest of Asia Pacific
-
2. North America
- 2.1. United States
- 2.2. Canada
- 2.3. Mexico
-
3. Europe
- 3.1. Germany
- 3.2. United Kingdom
- 3.3. France
- 3.4. Italy
- 3.5. Rest of Europe
-
4. South America
- 4.1. Brazil
- 4.2. Argentina
- 4.3. Rest of South America
- 5. Middle East
-
6. Saudi Arabia
- 6.1. South Africa
- 6.2. Rest of Middle East
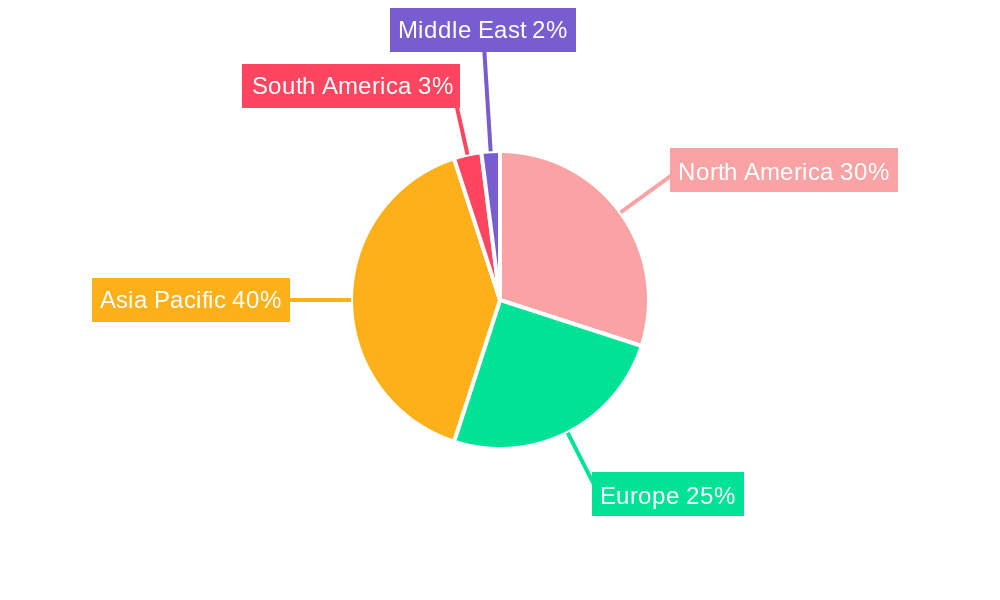
Nanowires Market Regional Market Share
Geographic Coverage of Nanowires Market
Nanowires Market REPORT HIGHLIGHTS
| Aspects | Details |
|---|---|
| Study Period | 2020-2034 |
| Base Year | 2025 |
| Estimated Year | 2026 |
| Forecast Period | 2026-2034 |
| Historical Period | 2020-2025 |
| Growth Rate | CAGR of > 25.00% from 2020-2034 |
| Segmentation |
|
Table of Contents
- 1. Introduction
- 1.1. Research Scope
- 1.2. Market Segmentation
- 1.3. Research Objective
- 1.4. Definitions and Assumptions
- 2. Executive Summary
- 2.1. Market Snapshot
- 3. Market Dynamics
- 3.1. Market Drivers
- 3.2. Market Restrains
- 3.3. Market Trends
- 3.4. Market Opportunities
- 4. Market Factor Analysis
- 4.1. Porters Five Forces
- 4.1.1. Bargaining Power of Suppliers
- 4.1.2. Bargaining Power of Buyers
- 4.1.3. Threat of New Entrants
- 4.1.4. Threat of Substitutes
- 4.1.5. Competitive Rivalry
- 4.2. PESTEL analysis
- 4.3. BCG Analysis
- 4.3.1. Stars (High Growth, High Market Share)
- 4.3.2. Cash Cows (Low Growth, High Market Share)
- 4.3.3. Question Mark (High Growth, Low Market Share)
- 4.3.4. Dogs (Low Growth, Low Market Share)
- 4.4. Ansoff Matrix Analysis
- 4.5. Supply Chain Analysis
- 4.6. Regulatory Landscape
- 4.7. Current Market Potential and Opportunity Assessment (TAM–SAM–SOM Framework)
- 4.8. TIR Analyst Note
- 4.1. Porters Five Forces
- 5. Market Analysis, Insights and Forecast 2021-2033
- 5.1. Market Analysis, Insights and Forecast - by Type
- 5.1.1. Metal Nanowires
- 5.1.2. Semiconductor Nanowires
- 5.1.3. Oxide Nanowires
- 5.1.4. Multi-Segment Nanowires
- 5.1.5. Semiconductor Quantum Wires
- 5.2. Market Analysis, Insights and Forecast - by Application
- 5.2.1. Consumer Electronics
- 5.2.2. Chemical and Biological sensors
- 5.2.3. Solar Cells
- 5.2.4. Other Applications
- 5.3. Market Analysis, Insights and Forecast - by Region
- 5.3.1. Asia Pacific
- 5.3.2. North America
- 5.3.3. Europe
- 5.3.4. South America
- 5.3.5. Middle East
- 5.3.6. Saudi Arabia
- 5.1. Market Analysis, Insights and Forecast - by Type
- 6. Global Nanowires Market Analysis, Insights and Forecast, 2021-2033
- 6.1. Market Analysis, Insights and Forecast - by Type
- 6.1.1. Metal Nanowires
- 6.1.2. Semiconductor Nanowires
- 6.1.3. Oxide Nanowires
- 6.1.4. Multi-Segment Nanowires
- 6.1.5. Semiconductor Quantum Wires
- 6.2. Market Analysis, Insights and Forecast - by Application
- 6.2.1. Consumer Electronics
- 6.2.2. Chemical and Biological sensors
- 6.2.3. Solar Cells
- 6.2.4. Other Applications
- 6.1. Market Analysis, Insights and Forecast - by Type
- 7. Asia Pacific Nanowires Market Analysis, Insights and Forecast, 2020-2032
- 7.1. Market Analysis, Insights and Forecast - by Type
- 7.1.1. Metal Nanowires
- 7.1.2. Semiconductor Nanowires
- 7.1.3. Oxide Nanowires
- 7.1.4. Multi-Segment Nanowires
- 7.1.5. Semiconductor Quantum Wires
- 7.2. Market Analysis, Insights and Forecast - by Application
- 7.2.1. Consumer Electronics
- 7.2.2. Chemical and Biological sensors
- 7.2.3. Solar Cells
- 7.2.4. Other Applications
- 7.1. Market Analysis, Insights and Forecast - by Type
- 8. North America Nanowires Market Analysis, Insights and Forecast, 2020-2032
- 8.1. Market Analysis, Insights and Forecast - by Type
- 8.1.1. Metal Nanowires
- 8.1.2. Semiconductor Nanowires
- 8.1.3. Oxide Nanowires
- 8.1.4. Multi-Segment Nanowires
- 8.1.5. Semiconductor Quantum Wires
- 8.2. Market Analysis, Insights and Forecast - by Application
- 8.2.1. Consumer Electronics
- 8.2.2. Chemical and Biological sensors
- 8.2.3. Solar Cells
- 8.2.4. Other Applications
- 8.1. Market Analysis, Insights and Forecast - by Type
- 9. Europe Nanowires Market Analysis, Insights and Forecast, 2020-2032
- 9.1. Market Analysis, Insights and Forecast - by Type
- 9.1.1. Metal Nanowires
- 9.1.2. Semiconductor Nanowires
- 9.1.3. Oxide Nanowires
- 9.1.4. Multi-Segment Nanowires
- 9.1.5. Semiconductor Quantum Wires
- 9.2. Market Analysis, Insights and Forecast - by Application
- 9.2.1. Consumer Electronics
- 9.2.2. Chemical and Biological sensors
- 9.2.3. Solar Cells
- 9.2.4. Other Applications
- 9.1. Market Analysis, Insights and Forecast - by Type
- 10. South America Nanowires Market Analysis, Insights and Forecast, 2020-2032
- 10.1. Market Analysis, Insights and Forecast - by Type
- 10.1.1. Metal Nanowires
- 10.1.2. Semiconductor Nanowires
- 10.1.3. Oxide Nanowires
- 10.1.4. Multi-Segment Nanowires
- 10.1.5. Semiconductor Quantum Wires
- 10.2. Market Analysis, Insights and Forecast - by Application
- 10.2.1. Consumer Electronics
- 10.2.2. Chemical and Biological sensors
- 10.2.3. Solar Cells
- 10.2.4. Other Applications
- 10.1. Market Analysis, Insights and Forecast - by Type
- 11. Middle East Nanowires Market Analysis, Insights and Forecast, 2020-2032
- 11.1. Market Analysis, Insights and Forecast - by Type
- 11.1.1. Metal Nanowires
- 11.1.2. Semiconductor Nanowires
- 11.1.3. Oxide Nanowires
- 11.1.4. Multi-Segment Nanowires
- 11.1.5. Semiconductor Quantum Wires
- 11.2. Market Analysis, Insights and Forecast - by Application
- 11.2.1. Consumer Electronics
- 11.2.2. Chemical and Biological sensors
- 11.2.3. Solar Cells
- 11.2.4. Other Applications
- 11.1. Market Analysis, Insights and Forecast - by Type
- 12. Saudi Arabia Nanowires Market Analysis, Insights and Forecast, 2020-2032
- 12.1. Market Analysis, Insights and Forecast - by Type
- 12.1.1. Metal Nanowires
- 12.1.2. Semiconductor Nanowires
- 12.1.3. Oxide Nanowires
- 12.1.4. Multi-Segment Nanowires
- 12.1.5. Semiconductor Quantum Wires
- 12.2. Market Analysis, Insights and Forecast - by Application
- 12.2.1. Consumer Electronics
- 12.2.2. Chemical and Biological sensors
- 12.2.3. Solar Cells
- 12.2.4. Other Applications
- 12.1. Market Analysis, Insights and Forecast - by Type
- 13. Competitive Analysis
- 13.1. Company Profiles
- 13.1.1 Kemix (Pty) Ltd
- 13.1.1.1. Company Overview
- 13.1.1.2. Products
- 13.1.1.3. Company Financials
- 13.1.1.4. SWOT Analysis
- 13.1.2 Novarials Corporation
- 13.1.2.1. Company Overview
- 13.1.2.2. Products
- 13.1.2.3. Company Financials
- 13.1.2.4. SWOT Analysis
- 13.1.3 RAS AG Materials
- 13.1.3.1. Company Overview
- 13.1.3.2. Products
- 13.1.3.3. Company Financials
- 13.1.3.4. SWOT Analysis
- 13.1.4 BASF SE
- 13.1.4.1. Company Overview
- 13.1.4.2. Products
- 13.1.4.3. Company Financials
- 13.1.4.4. SWOT Analysis
- 13.1.5 NanoComposix Inc
- 13.1.5.1. Company Overview
- 13.1.5.2. Products
- 13.1.5.3. Company Financials
- 13.1.5.4. SWOT Analysis
- 13.1.6 Minnesota Wire Company
- 13.1.6.1. Company Overview
- 13.1.6.2. Products
- 13.1.6.3. Company Financials
- 13.1.6.4. SWOT Analysis
- 13.1.7 Nanostructured and Amorphous Materials Inc
- 13.1.7.1. Company Overview
- 13.1.7.2. Products
- 13.1.7.3. Company Financials
- 13.1.7.4. SWOT Analysis
- 13.1.8 ACS Materials LLC
- 13.1.8.1. Company Overview
- 13.1.8.2. Products
- 13.1.8.3. Company Financials
- 13.1.8.4. SWOT Analysis
- 13.1.9 US Nano*List Not Exhaustive
- 13.1.9.1. Company Overview
- 13.1.9.2. Products
- 13.1.9.3. Company Financials
- 13.1.9.4. SWOT Analysis
- 13.1.10 Blue Nano Inc
- 13.1.10.1. Company Overview
- 13.1.10.2. Products
- 13.1.10.3. Company Financials
- 13.1.10.4. SWOT Analysis
- 13.1.11 Cambrios Technologies Corporation
- 13.1.11.1. Company Overview
- 13.1.11.2. Products
- 13.1.11.3. Company Financials
- 13.1.11.4. SWOT Analysis
- 13.1.1 Kemix (Pty) Ltd
- 13.2. Market Entropy
- 13.2.1 Company's Key Areas Served
- 13.2.2 Recent Developments
- 13.3. Company Market Share Analysis 2025
- 13.3.1 Top 5 Companies Market Share Analysis
- 13.3.2 Top 3 Companies Market Share Analysis
- 13.4. List of Potential Customers
- 14. Research Methodology
List of Figures
- Figure 1: Global Nanowires Market Revenue Breakdown (Million, %) by Region 2025 & 2033
- Figure 2: Asia Pacific Nanowires Market Revenue (Million), by Type 2025 & 2033
- Figure 3: Asia Pacific Nanowires Market Revenue Share (%), by Type 2025 & 2033
- Figure 4: Asia Pacific Nanowires Market Revenue (Million), by Application 2025 & 2033
- Figure 5: Asia Pacific Nanowires Market Revenue Share (%), by Application 2025 & 2033
- Figure 6: Asia Pacific Nanowires Market Revenue (Million), by Country 2025 & 2033
- Figure 7: Asia Pacific Nanowires Market Revenue Share (%), by Country 2025 & 2033
- Figure 8: North America Nanowires Market Revenue (Million), by Type 2025 & 2033
- Figure 9: North America Nanowires Market Revenue Share (%), by Type 2025 & 2033
- Figure 10: North America Nanowires Market Revenue (Million), by Application 2025 & 2033
- Figure 11: North America Nanowires Market Revenue Share (%), by Application 2025 & 2033
- Figure 12: North America Nanowires Market Revenue (Million), by Country 2025 & 2033
- Figure 13: North America Nanowires Market Revenue Share (%), by Country 2025 & 2033
- Figure 14: Europe Nanowires Market Revenue (Million), by Type 2025 & 2033
- Figure 15: Europe Nanowires Market Revenue Share (%), by Type 2025 & 2033
- Figure 16: Europe Nanowires Market Revenue (Million), by Application 2025 & 2033
- Figure 17: Europe Nanowires Market Revenue Share (%), by Application 2025 & 2033
- Figure 18: Europe Nanowires Market Revenue (Million), by Country 2025 & 2033
- Figure 19: Europe Nanowires Market Revenue Share (%), by Country 2025 & 2033
- Figure 20: South America Nanowires Market Revenue (Million), by Type 2025 & 2033
- Figure 21: South America Nanowires Market Revenue Share (%), by Type 2025 & 2033
- Figure 22: South America Nanowires Market Revenue (Million), by Application 2025 & 2033
- Figure 23: South America Nanowires Market Revenue Share (%), by Application 2025 & 2033
- Figure 24: South America Nanowires Market Revenue (Million), by Country 2025 & 2033
- Figure 25: South America Nanowires Market Revenue Share (%), by Country 2025 & 2033
- Figure 26: Middle East Nanowires Market Revenue (Million), by Type 2025 & 2033
- Figure 27: Middle East Nanowires Market Revenue Share (%), by Type 2025 & 2033
- Figure 28: Middle East Nanowires Market Revenue (Million), by Application 2025 & 2033
- Figure 29: Middle East Nanowires Market Revenue Share (%), by Application 2025 & 2033
- Figure 30: Middle East Nanowires Market Revenue (Million), by Country 2025 & 2033
- Figure 31: Middle East Nanowires Market Revenue Share (%), by Country 2025 & 2033
- Figure 32: Saudi Arabia Nanowires Market Revenue (Million), by Type 2025 & 2033
- Figure 33: Saudi Arabia Nanowires Market Revenue Share (%), by Type 2025 & 2033
- Figure 34: Saudi Arabia Nanowires Market Revenue (Million), by Application 2025 & 2033
- Figure 35: Saudi Arabia Nanowires Market Revenue Share (%), by Application 2025 & 2033
- Figure 36: Saudi Arabia Nanowires Market Revenue (Million), by Country 2025 & 2033
- Figure 37: Saudi Arabia Nanowires Market Revenue Share (%), by Country 2025 & 2033
List of Tables
- Table 1: Global Nanowires Market Revenue Million Forecast, by Type 2020 & 2033
- Table 2: Global Nanowires Market Revenue Million Forecast, by Application 2020 & 2033
- Table 3: Global Nanowires Market Revenue Million Forecast, by Region 2020 & 2033
- Table 4: Global Nanowires Market Revenue Million Forecast, by Type 2020 & 2033
- Table 5: Global Nanowires Market Revenue Million Forecast, by Application 2020 & 2033
- Table 6: Global Nanowires Market Revenue Million Forecast, by Country 2020 & 2033
- Table 7: China Nanowires Market Revenue (Million) Forecast, by Application 2020 & 2033
- Table 8: India Nanowires Market Revenue (Million) Forecast, by Application 2020 & 2033
- Table 9: Japan Nanowires Market Revenue (Million) Forecast, by Application 2020 & 2033
- Table 10: South Korea Nanowires Market Revenue (Million) Forecast, by Application 2020 & 2033
- Table 11: Rest of Asia Pacific Nanowires Market Revenue (Million) Forecast, by Application 2020 & 2033
- Table 12: Global Nanowires Market Revenue Million Forecast, by Type 2020 & 2033
- Table 13: Global Nanowires Market Revenue Million Forecast, by Application 2020 & 2033
- Table 14: Global Nanowires Market Revenue Million Forecast, by Country 2020 & 2033
- Table 15: United States Nanowires Market Revenue (Million) Forecast, by Application 2020 & 2033
- Table 16: Canada Nanowires Market Revenue (Million) Forecast, by Application 2020 & 2033
- Table 17: Mexico Nanowires Market Revenue (Million) Forecast, by Application 2020 & 2033
- Table 18: Global Nanowires Market Revenue Million Forecast, by Type 2020 & 2033
- Table 19: Global Nanowires Market Revenue Million Forecast, by Application 2020 & 2033
- Table 20: Global Nanowires Market Revenue Million Forecast, by Country 2020 & 2033
- Table 21: Germany Nanowires Market Revenue (Million) Forecast, by Application 2020 & 2033
- Table 22: United Kingdom Nanowires Market Revenue (Million) Forecast, by Application 2020 & 2033
- Table 23: France Nanowires Market Revenue (Million) Forecast, by Application 2020 & 2033
- Table 24: Italy Nanowires Market Revenue (Million) Forecast, by Application 2020 & 2033
- Table 25: Rest of Europe Nanowires Market Revenue (Million) Forecast, by Application 2020 & 2033
- Table 26: Global Nanowires Market Revenue Million Forecast, by Type 2020 & 2033
- Table 27: Global Nanowires Market Revenue Million Forecast, by Application 2020 & 2033
- Table 28: Global Nanowires Market Revenue Million Forecast, by Country 2020 & 2033
- Table 29: Brazil Nanowires Market Revenue (Million) Forecast, by Application 2020 & 2033
- Table 30: Argentina Nanowires Market Revenue (Million) Forecast, by Application 2020 & 2033
- Table 31: Rest of South America Nanowires Market Revenue (Million) Forecast, by Application 2020 & 2033
- Table 32: Global Nanowires Market Revenue Million Forecast, by Type 2020 & 2033
- Table 33: Global Nanowires Market Revenue Million Forecast, by Application 2020 & 2033
- Table 34: Global Nanowires Market Revenue Million Forecast, by Country 2020 & 2033
- Table 35: Global Nanowires Market Revenue Million Forecast, by Type 2020 & 2033
- Table 36: Global Nanowires Market Revenue Million Forecast, by Application 2020 & 2033
- Table 37: Global Nanowires Market Revenue Million Forecast, by Country 2020 & 2033
- Table 38: South Africa Nanowires Market Revenue (Million) Forecast, by Application 2020 & 2033
- Table 39: Rest of Middle East Nanowires Market Revenue (Million) Forecast, by Application 2020 & 2033
Frequently Asked Questions
1. What is the projected Compound Annual Growth Rate (CAGR) of the Nanowires Market?
The projected CAGR is approximately > 25.00%.
2. Which companies are prominent players in the Nanowires Market?
Key companies in the market include Kemix (Pty) Ltd, Novarials Corporation, RAS AG Materials, BASF SE, NanoComposix Inc, Minnesota Wire Company, Nanostructured and Amorphous Materials Inc, ACS Materials LLC, US Nano*List Not Exhaustive, Blue Nano Inc, Cambrios Technologies Corporation.
3. What are the main segments of the Nanowires Market?
The market segments include Type, Application.
4. Can you provide details about the market size?
The market size is estimated to be USD XX Million as of 2022.
5. What are some drivers contributing to market growth?
; Emerging Applications of Nanowires in LEDs. Nano-medicines. and Consumer Electronics; Increasing Investments in R&D to Explore New Applications.
6. What are the notable trends driving market growth?
Consumer Electronics Segment to Dominate the Market Demand.
7. Are there any restraints impacting market growth?
; Lack of Reliable Methods for Assembling Circuits.
8. Can you provide examples of recent developments in the market?
N/A
9. What pricing options are available for accessing the report?
Pricing options include single-user, multi-user, and enterprise licenses priced at USD 4750, USD 5250, and USD 8750 respectively.
10. Is the market size provided in terms of value or volume?
The market size is provided in terms of value, measured in Million.
11. Are there any specific market keywords associated with the report?
Yes, the market keyword associated with the report is "Nanowires Market," which aids in identifying and referencing the specific market segment covered.
12. How do I determine which pricing option suits my needs best?
The pricing options vary based on user requirements and access needs. Individual users may opt for single-user licenses, while businesses requiring broader access may choose multi-user or enterprise licenses for cost-effective access to the report.
13. Are there any additional resources or data provided in the Nanowires Market report?
While the report offers comprehensive insights, it's advisable to review the specific contents or supplementary materials provided to ascertain if additional resources or data are available.
14. How can I stay updated on further developments or reports in the Nanowires Market?
To stay informed about further developments, trends, and reports in the Nanowires Market, consider subscribing to industry newsletters, following relevant companies and organizations, or regularly checking reputable industry news sources and publications.
Methodology
Step 1 - Identification of Relevant Samples Size from Population Database


Step 2 - Approaches for Defining Global Market Size (Value, Volume* & Price*)

Note*: In applicable scenarios
Step 3 - Data Sources
Primary Research
- Web Analytics
- Survey Reports
- Research Institute
- Latest Research Reports
- Opinion Leaders
Secondary Research
- Annual Reports
- White Paper
- Latest Press Release
- Industry Association
- Paid Database
- Investor Presentations

Step 4 - Data Triangulation
Involves using different sources of information in order to increase the validity of a study
These sources are likely to be stakeholders in a program - participants, other researchers, program staff, other community members, and so on.
Then we put all data in single framework & apply various statistical tools to find out the dynamic on the market.
During the analysis stage, feedback from the stakeholder groups would be compared to determine areas of agreement as well as areas of divergence