

Key Insights
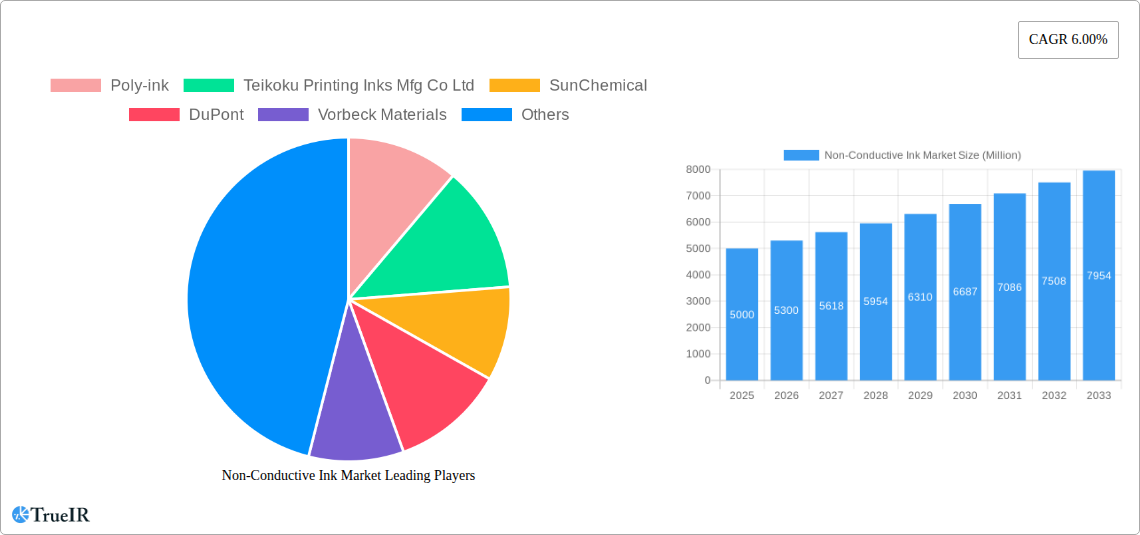
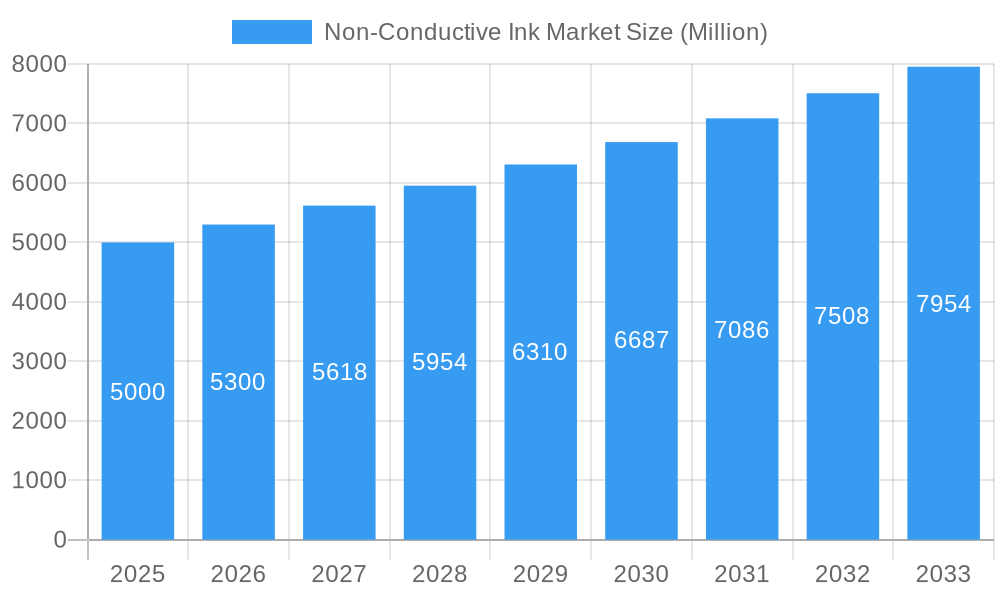
The non-conductive ink market, valued at approximately $5 billion in 2025, is projected to experience robust growth, driven by a Compound Annual Growth Rate (CAGR) of 6% from 2025 to 2033. This expansion is fueled by the increasing demand for advanced electronics and specialized applications across diverse sectors. Key drivers include the burgeoning photovoltaic (PV) panel industry, the continued miniaturization of printed circuit boards (PCBs), and the expansion of the LED lighting market. Growth within the substrate types is expected to be led by the acrylic segment due to its cost-effectiveness and versatility, while the glass substrate segment is poised for significant growth due to its superior properties in demanding applications. The application segments are experiencing varied growth patterns: photovoltaic panels are expected to show the strongest growth due to the global push toward renewable energy, while the printed circuit board and LED packaging segments will also contribute significantly. Geographic expansion is anticipated across all regions, particularly in rapidly developing economies within Asia-Pacific, driven by increasing manufacturing activities and infrastructure development in these areas. However, potential restraints include fluctuations in raw material prices and the emergence of alternative technologies.
Non-Conductive Ink Market Market Size (In Billion)
The competitive landscape features both established players like DuPont and SunChemical, and specialized companies such as Poly-ink and Vorbeck Materials. These companies are focusing on innovation and product diversification to meet evolving market needs, leading to a competitive yet dynamic market structure. The market is expected to witness strategic partnerships, mergers, and acquisitions, as companies seek to expand their market reach and enhance their technological capabilities. Companies are also focusing on developing sustainable and environmentally friendly inks to meet increasing regulatory requirements and the growing demand for environmentally responsible manufacturing practices. The forecast period (2025-2033) anticipates a steady increase in market size, underpinned by sustained growth in the key application areas and continued technological advancements in ink formulations.
Non-Conductive Ink Market Company Market Share
Non-Conductive Ink Market Report: A Comprehensive Analysis (2019-2033)
This dynamic report provides a detailed analysis of the Non-Conductive Ink market, offering invaluable insights for industry stakeholders. With a comprehensive study period spanning 2019-2033, including a base year of 2025 and a forecast period of 2025-2033, this report leverages extensive data from the historical period (2019-2024) to paint a clear picture of current market dynamics and future projections. The report covers key market segments, competitive landscapes, and growth drivers, making it an essential resource for strategic decision-making. The market is estimated to be valued at xx Million in 2025 and is projected to reach xx Million by 2033.
Non-Conductive Ink Market Market Structure & Competitive Landscape
The Non-Conductive Ink market exhibits a moderately concentrated structure, with key players holding significant market share. The Herfindahl-Hirschman Index (HHI) is estimated at xx, indicating a moderately competitive landscape. Innovation is a key driver, with companies constantly developing new ink formulations with improved properties like enhanced UV resistance, higher viscosity, and better adhesion to diverse substrates. Regulatory compliance, particularly regarding environmental regulations and material safety, significantly impacts market dynamics. Product substitutes, such as conductive adhesives in specific applications, pose a competitive challenge. The market is segmented by substrate type (Acrylic, Ceramic, Glass) and application (Photovoltaic Panels, Printed Circuit Board Panels, LED Packaging), driving specialized product development. M&A activity in the period 2019-2024 was moderate, with approximately xx deals recorded, primarily focused on expanding product portfolios and geographic reach. Larger players are increasingly focused on strategic partnerships and collaborations to enhance their technological capabilities and market penetration.
- Market Concentration: HHI estimated at xx
- Innovation Drivers: Improved UV resistance, viscosity, adhesion
- Regulatory Impacts: Environmental regulations, material safety standards
- Product Substitutes: Conductive adhesives
- End-User Segmentation: Photovoltaic, PCB, LED packaging industries
- M&A Trends: xx deals recorded between 2019-2024, focusing on portfolio expansion and geographic reach.
Non-Conductive Ink Market Market Trends & Opportunities
The Non-Conductive Ink market is experiencing robust growth, with a projected Compound Annual Growth Rate (CAGR) of xx% during the forecast period (2025-2033). This growth is fueled by several factors, including the increasing demand for advanced electronics and renewable energy technologies. The rising adoption of printed electronics and flexible displays is driving the demand for high-performance non-conductive inks. Technological advancements, such as the development of eco-friendly and sustainable inks, are also contributing to market growth. Consumer preference for durable, high-quality products and a growing environmental consciousness are driving the adoption of inks with improved performance and reduced environmental impact. Competitive dynamics are characterized by intense rivalry among established players and the emergence of innovative startups. Market penetration rates vary across different applications, with the highest penetration observed in the photovoltaic panel segment, currently at approximately xx%.
Dominant Markets & Segments in Non-Conductive Ink Market
The Asia-Pacific region currently dominates the Non-Conductive Ink market, driven by rapid economic growth, substantial investments in infrastructure, and a burgeoning electronics industry. China and Japan are the key contributors to this regional dominance. Within the segment breakdown:
- Substrate Type: The Acrylic substrate segment is currently leading due to its versatility and cost-effectiveness.
- Application: Photovoltaic panel applications represent the largest segment due to the expanding renewable energy sector.
Key Growth Drivers (Asia-Pacific):
- Rapid economic growth and industrialization.
- Significant investments in renewable energy infrastructure.
- Government support for technology advancements.
- Growing electronics manufacturing base.
Detailed analysis reveals that the strong growth in China's photovoltaic industry, coupled with favorable government policies promoting renewable energy, contributes significantly to the dominance of the Asia-Pacific region and the Photovoltaic Panel application segment. The market in North America and Europe is also showing significant growth, driven by technological advancements and increasing demand for high-precision electronics.
Non-Conductive Ink Market Product Analysis
Recent innovations in Non-Conductive Ink technology focus on enhancing performance characteristics like UV resistance, flexibility, and adhesion. These advancements cater to the increasing demand for durable and reliable inks across various applications, including flexible electronics and high-precision printing. The market sees ongoing competition based on cost-effectiveness, performance attributes, and environmental impact, influencing the selection of inks for diverse applications. New inks are being designed with specific properties for better integration into existing manufacturing processes, enhancing efficiency and reducing waste.
Key Drivers, Barriers & Challenges in Non-Conductive Ink Market
Key Drivers:
The rising demand for high-performance electronics, particularly in the renewable energy sector (e.g., solar panels) and the printed electronics industry, is a major driver. Technological advancements like nanotechnology and improved ink formulations offer enhanced properties. Government policies supporting renewable energy and sustainable manufacturing further accelerate market growth.
Key Challenges:
Stringent regulatory compliance requirements regarding chemical composition and environmental impact create challenges. Supply chain disruptions, especially concerning raw material sourcing, can impact production and pricing. Intense competition among existing players and the emergence of new entrants put pressure on profit margins. The estimated impact of supply chain disruptions on market growth in 2024 was approximately xx%.
Growth Drivers in the Non-Conductive Ink Market Market
Growth is driven primarily by increasing demand for electronic devices, expansion of renewable energy sectors (photovoltaic and LED), and ongoing technological advancements enhancing ink properties. Government initiatives supporting green technology and sustainable manufacturing further fuel growth.
Challenges Impacting Non-Conductive Ink Market Growth
Regulatory hurdles, especially concerning environmental compliance, pose significant challenges. Supply chain vulnerabilities and fluctuations in raw material prices impact production costs and profitability. Intense competition from established and emerging players creates pressure on pricing and market share.
Key Players Shaping the Non-Conductive Ink Market Market
- Poly-ink
- Teikoku Printing Inks Mfg Co Ltd
- SunChemical
- DuPont
- Vorbeck Materials
- Applied Ink Solutions
- Henkel Corporation
- Creative Materials Inc
- Nagase America LLC
- NovaCentrix
Significant Non-Conductive Ink Market Industry Milestones
- 2021 Q3: Poly-ink launched a new line of UV-resistant non-conductive inks for photovoltaic applications.
- 2022 Q1: SunChemical acquired a smaller ink manufacturer, expanding its product portfolio.
- 2023 Q2: New environmental regulations came into effect in the EU, impacting ink formulations.
Future Outlook for Non-Conductive Ink Market Market
The Non-Conductive Ink market is poised for continued growth, driven by the rising demand for advanced electronics, the expansion of renewable energy technologies, and ongoing technological advancements. Strategic partnerships and collaborations among key players will be crucial for achieving market leadership. The development of eco-friendly and sustainable inks will further enhance market potential. The increasing adoption of printed electronics and flexible displays presents significant opportunities for growth in the coming years.
Non-Conductive Ink Market Segmentation
-
1. Substrate Type
- 1.1. Acrylic
- 1.2. Ceramic
- 1.3. Glass
-
2. Application
- 2.1. Photovoltaic Panels
- 2.2. Printed Circuit Board Panels
- 2.3. LED Packaging
Non-Conductive Ink Market Segmentation By Geography
-
1. Asia Pacific
- 1.1. China
- 1.2. India
- 1.3. Japan
- 1.4. South Korea
- 1.5. Rest of Asia Pacific
-
2. North America
- 2.1. United States
- 2.2. Canada
- 2.3. Mexico
-
3. Europe
- 3.1. Germany
- 3.2. United Kingdom
- 3.3. France
- 3.4. Italy
- 3.5. Rest of Europe
-
4. South America
- 4.1. Brazil
- 4.2. Argentina
- 4.3. Rest of South America
-
5. Middle East and Africa
- 5.1. Saudi Arabia
- 5.2. South Africa
- 5.3. Rest of Middle East and Africa
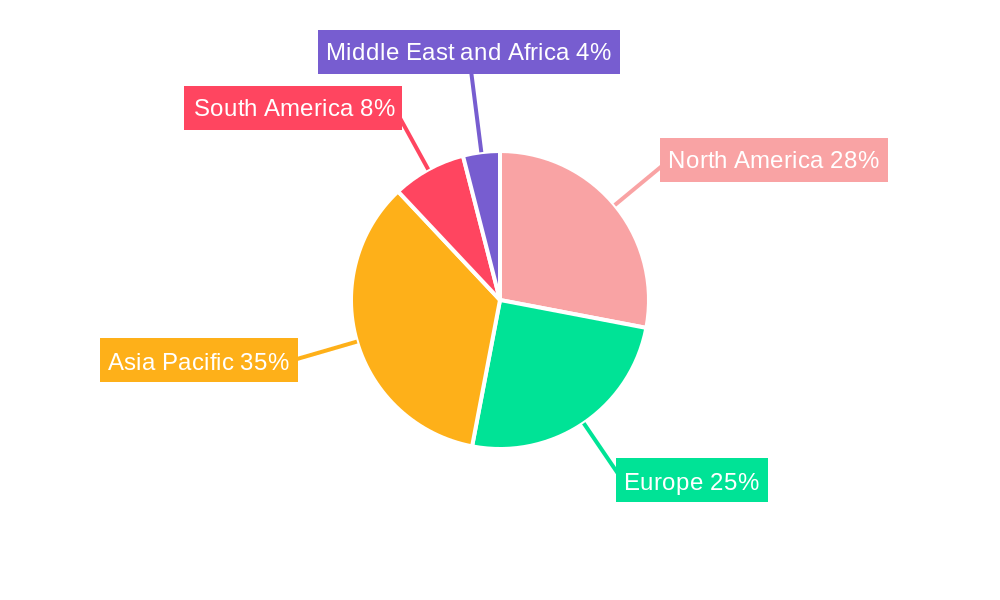
Non-Conductive Ink Market Regional Market Share
Geographic Coverage of Non-Conductive Ink Market
Non-Conductive Ink Market REPORT HIGHLIGHTS
| Aspects | Details |
|---|---|
| Study Period | 2020-2034 |
| Base Year | 2025 |
| Estimated Year | 2026 |
| Forecast Period | 2026-2034 |
| Historical Period | 2020-2025 |
| Growth Rate | CAGR of 6.00% from 2020-2034 |
| Segmentation |
|
Table of Contents
- 1. Introduction
- 1.1. Research Scope
- 1.2. Market Segmentation
- 1.3. Research Objective
- 1.4. Definitions and Assumptions
- 2. Executive Summary
- 2.1. Market Snapshot
- 3. Market Dynamics
- 3.1. Market Drivers
- 3.2. Market Restrains
- 3.3. Market Trends
- 3.4. Market Opportunities
- 4. Market Factor Analysis
- 4.1. Porters Five Forces
- 4.1.1. Bargaining Power of Suppliers
- 4.1.2. Bargaining Power of Buyers
- 4.1.3. Threat of New Entrants
- 4.1.4. Threat of Substitutes
- 4.1.5. Competitive Rivalry
- 4.2. PESTEL analysis
- 4.3. BCG Analysis
- 4.3.1. Stars (High Growth, High Market Share)
- 4.3.2. Cash Cows (Low Growth, High Market Share)
- 4.3.3. Question Mark (High Growth, Low Market Share)
- 4.3.4. Dogs (Low Growth, Low Market Share)
- 4.4. Ansoff Matrix Analysis
- 4.5. Supply Chain Analysis
- 4.6. Regulatory Landscape
- 4.7. Current Market Potential and Opportunity Assessment (TAM–SAM–SOM Framework)
- 4.8. TIR Analyst Note
- 4.1. Porters Five Forces
- 5. Market Analysis, Insights and Forecast 2021-2033
- 5.1. Market Analysis, Insights and Forecast - by Substrate Type
- 5.1.1. Acrylic
- 5.1.2. Ceramic
- 5.1.3. Glass
- 5.2. Market Analysis, Insights and Forecast - by Application
- 5.2.1. Photovoltaic Panels
- 5.2.2. Printed Circuit Board Panels
- 5.2.3. LED Packaging
- 5.3. Market Analysis, Insights and Forecast - by Region
- 5.3.1. Asia Pacific
- 5.3.2. North America
- 5.3.3. Europe
- 5.3.4. South America
- 5.3.5. Middle East and Africa
- 5.1. Market Analysis, Insights and Forecast - by Substrate Type
- 6. Global Non-Conductive Ink Market Analysis, Insights and Forecast, 2021-2033
- 6.1. Market Analysis, Insights and Forecast - by Substrate Type
- 6.1.1. Acrylic
- 6.1.2. Ceramic
- 6.1.3. Glass
- 6.2. Market Analysis, Insights and Forecast - by Application
- 6.2.1. Photovoltaic Panels
- 6.2.2. Printed Circuit Board Panels
- 6.2.3. LED Packaging
- 6.1. Market Analysis, Insights and Forecast - by Substrate Type
- 7. Asia Pacific Non-Conductive Ink Market Analysis, Insights and Forecast, 2020-2032
- 7.1. Market Analysis, Insights and Forecast - by Substrate Type
- 7.1.1. Acrylic
- 7.1.2. Ceramic
- 7.1.3. Glass
- 7.2. Market Analysis, Insights and Forecast - by Application
- 7.2.1. Photovoltaic Panels
- 7.2.2. Printed Circuit Board Panels
- 7.2.3. LED Packaging
- 7.1. Market Analysis, Insights and Forecast - by Substrate Type
- 8. North America Non-Conductive Ink Market Analysis, Insights and Forecast, 2020-2032
- 8.1. Market Analysis, Insights and Forecast - by Substrate Type
- 8.1.1. Acrylic
- 8.1.2. Ceramic
- 8.1.3. Glass
- 8.2. Market Analysis, Insights and Forecast - by Application
- 8.2.1. Photovoltaic Panels
- 8.2.2. Printed Circuit Board Panels
- 8.2.3. LED Packaging
- 8.1. Market Analysis, Insights and Forecast - by Substrate Type
- 9. Europe Non-Conductive Ink Market Analysis, Insights and Forecast, 2020-2032
- 9.1. Market Analysis, Insights and Forecast - by Substrate Type
- 9.1.1. Acrylic
- 9.1.2. Ceramic
- 9.1.3. Glass
- 9.2. Market Analysis, Insights and Forecast - by Application
- 9.2.1. Photovoltaic Panels
- 9.2.2. Printed Circuit Board Panels
- 9.2.3. LED Packaging
- 9.1. Market Analysis, Insights and Forecast - by Substrate Type
- 10. South America Non-Conductive Ink Market Analysis, Insights and Forecast, 2020-2032
- 10.1. Market Analysis, Insights and Forecast - by Substrate Type
- 10.1.1. Acrylic
- 10.1.2. Ceramic
- 10.1.3. Glass
- 10.2. Market Analysis, Insights and Forecast - by Application
- 10.2.1. Photovoltaic Panels
- 10.2.2. Printed Circuit Board Panels
- 10.2.3. LED Packaging
- 10.1. Market Analysis, Insights and Forecast - by Substrate Type
- 11. Middle East and Africa Non-Conductive Ink Market Analysis, Insights and Forecast, 2020-2032
- 11.1. Market Analysis, Insights and Forecast - by Substrate Type
- 11.1.1. Acrylic
- 11.1.2. Ceramic
- 11.1.3. Glass
- 11.2. Market Analysis, Insights and Forecast - by Application
- 11.2.1. Photovoltaic Panels
- 11.2.2. Printed Circuit Board Panels
- 11.2.3. LED Packaging
- 11.1. Market Analysis, Insights and Forecast - by Substrate Type
- 12. Competitive Analysis
- 12.1. Company Profiles
- 12.1.1 Poly-ink
- 12.1.1.1. Company Overview
- 12.1.1.2. Products
- 12.1.1.3. Company Financials
- 12.1.1.4. SWOT Analysis
- 12.1.2 Teikoku Printing Inks Mfg Co Ltd
- 12.1.2.1. Company Overview
- 12.1.2.2. Products
- 12.1.2.3. Company Financials
- 12.1.2.4. SWOT Analysis
- 12.1.3 SunChemical
- 12.1.3.1. Company Overview
- 12.1.3.2. Products
- 12.1.3.3. Company Financials
- 12.1.3.4. SWOT Analysis
- 12.1.4 DuPont
- 12.1.4.1. Company Overview
- 12.1.4.2. Products
- 12.1.4.3. Company Financials
- 12.1.4.4. SWOT Analysis
- 12.1.5 Vorbeck Materials
- 12.1.5.1. Company Overview
- 12.1.5.2. Products
- 12.1.5.3. Company Financials
- 12.1.5.4. SWOT Analysis
- 12.1.6 Applied Ink Solutions
- 12.1.6.1. Company Overview
- 12.1.6.2. Products
- 12.1.6.3. Company Financials
- 12.1.6.4. SWOT Analysis
- 12.1.7 Henkel Corporation
- 12.1.7.1. Company Overview
- 12.1.7.2. Products
- 12.1.7.3. Company Financials
- 12.1.7.4. SWOT Analysis
- 12.1.8 Creative Materials Inc
- 12.1.8.1. Company Overview
- 12.1.8.2. Products
- 12.1.8.3. Company Financials
- 12.1.8.4. SWOT Analysis
- 12.1.9 Nagase America LLC
- 12.1.9.1. Company Overview
- 12.1.9.2. Products
- 12.1.9.3. Company Financials
- 12.1.9.4. SWOT Analysis
- 12.1.10 NovaCentrix
- 12.1.10.1. Company Overview
- 12.1.10.2. Products
- 12.1.10.3. Company Financials
- 12.1.10.4. SWOT Analysis
- 12.1.1 Poly-ink
- 12.2. Market Entropy
- 12.2.1 Company's Key Areas Served
- 12.2.2 Recent Developments
- 12.3. Company Market Share Analysis 2025
- 12.3.1 Top 5 Companies Market Share Analysis
- 12.3.2 Top 3 Companies Market Share Analysis
- 12.4. List of Potential Customers
- 13. Research Methodology
List of Figures
- Figure 1: Global Non-Conductive Ink Market Revenue Breakdown (Million, %) by Region 2025 & 2033
- Figure 2: Global Non-Conductive Ink Market Volume Breakdown (K Tons, %) by Region 2025 & 2033
- Figure 3: Asia Pacific Non-Conductive Ink Market Revenue (Million), by Substrate Type 2025 & 2033
- Figure 4: Asia Pacific Non-Conductive Ink Market Volume (K Tons), by Substrate Type 2025 & 2033
- Figure 5: Asia Pacific Non-Conductive Ink Market Revenue Share (%), by Substrate Type 2025 & 2033
- Figure 6: Asia Pacific Non-Conductive Ink Market Volume Share (%), by Substrate Type 2025 & 2033
- Figure 7: Asia Pacific Non-Conductive Ink Market Revenue (Million), by Application 2025 & 2033
- Figure 8: Asia Pacific Non-Conductive Ink Market Volume (K Tons), by Application 2025 & 2033
- Figure 9: Asia Pacific Non-Conductive Ink Market Revenue Share (%), by Application 2025 & 2033
- Figure 10: Asia Pacific Non-Conductive Ink Market Volume Share (%), by Application 2025 & 2033
- Figure 11: Asia Pacific Non-Conductive Ink Market Revenue (Million), by Country 2025 & 2033
- Figure 12: Asia Pacific Non-Conductive Ink Market Volume (K Tons), by Country 2025 & 2033
- Figure 13: Asia Pacific Non-Conductive Ink Market Revenue Share (%), by Country 2025 & 2033
- Figure 14: Asia Pacific Non-Conductive Ink Market Volume Share (%), by Country 2025 & 2033
- Figure 15: North America Non-Conductive Ink Market Revenue (Million), by Substrate Type 2025 & 2033
- Figure 16: North America Non-Conductive Ink Market Volume (K Tons), by Substrate Type 2025 & 2033
- Figure 17: North America Non-Conductive Ink Market Revenue Share (%), by Substrate Type 2025 & 2033
- Figure 18: North America Non-Conductive Ink Market Volume Share (%), by Substrate Type 2025 & 2033
- Figure 19: North America Non-Conductive Ink Market Revenue (Million), by Application 2025 & 2033
- Figure 20: North America Non-Conductive Ink Market Volume (K Tons), by Application 2025 & 2033
- Figure 21: North America Non-Conductive Ink Market Revenue Share (%), by Application 2025 & 2033
- Figure 22: North America Non-Conductive Ink Market Volume Share (%), by Application 2025 & 2033
- Figure 23: North America Non-Conductive Ink Market Revenue (Million), by Country 2025 & 2033
- Figure 24: North America Non-Conductive Ink Market Volume (K Tons), by Country 2025 & 2033
- Figure 25: North America Non-Conductive Ink Market Revenue Share (%), by Country 2025 & 2033
- Figure 26: North America Non-Conductive Ink Market Volume Share (%), by Country 2025 & 2033
- Figure 27: Europe Non-Conductive Ink Market Revenue (Million), by Substrate Type 2025 & 2033
- Figure 28: Europe Non-Conductive Ink Market Volume (K Tons), by Substrate Type 2025 & 2033
- Figure 29: Europe Non-Conductive Ink Market Revenue Share (%), by Substrate Type 2025 & 2033
- Figure 30: Europe Non-Conductive Ink Market Volume Share (%), by Substrate Type 2025 & 2033
- Figure 31: Europe Non-Conductive Ink Market Revenue (Million), by Application 2025 & 2033
- Figure 32: Europe Non-Conductive Ink Market Volume (K Tons), by Application 2025 & 2033
- Figure 33: Europe Non-Conductive Ink Market Revenue Share (%), by Application 2025 & 2033
- Figure 34: Europe Non-Conductive Ink Market Volume Share (%), by Application 2025 & 2033
- Figure 35: Europe Non-Conductive Ink Market Revenue (Million), by Country 2025 & 2033
- Figure 36: Europe Non-Conductive Ink Market Volume (K Tons), by Country 2025 & 2033
- Figure 37: Europe Non-Conductive Ink Market Revenue Share (%), by Country 2025 & 2033
- Figure 38: Europe Non-Conductive Ink Market Volume Share (%), by Country 2025 & 2033
- Figure 39: South America Non-Conductive Ink Market Revenue (Million), by Substrate Type 2025 & 2033
- Figure 40: South America Non-Conductive Ink Market Volume (K Tons), by Substrate Type 2025 & 2033
- Figure 41: South America Non-Conductive Ink Market Revenue Share (%), by Substrate Type 2025 & 2033
- Figure 42: South America Non-Conductive Ink Market Volume Share (%), by Substrate Type 2025 & 2033
- Figure 43: South America Non-Conductive Ink Market Revenue (Million), by Application 2025 & 2033
- Figure 44: South America Non-Conductive Ink Market Volume (K Tons), by Application 2025 & 2033
- Figure 45: South America Non-Conductive Ink Market Revenue Share (%), by Application 2025 & 2033
- Figure 46: South America Non-Conductive Ink Market Volume Share (%), by Application 2025 & 2033
- Figure 47: South America Non-Conductive Ink Market Revenue (Million), by Country 2025 & 2033
- Figure 48: South America Non-Conductive Ink Market Volume (K Tons), by Country 2025 & 2033
- Figure 49: South America Non-Conductive Ink Market Revenue Share (%), by Country 2025 & 2033
- Figure 50: South America Non-Conductive Ink Market Volume Share (%), by Country 2025 & 2033
- Figure 51: Middle East and Africa Non-Conductive Ink Market Revenue (Million), by Substrate Type 2025 & 2033
- Figure 52: Middle East and Africa Non-Conductive Ink Market Volume (K Tons), by Substrate Type 2025 & 2033
- Figure 53: Middle East and Africa Non-Conductive Ink Market Revenue Share (%), by Substrate Type 2025 & 2033
- Figure 54: Middle East and Africa Non-Conductive Ink Market Volume Share (%), by Substrate Type 2025 & 2033
- Figure 55: Middle East and Africa Non-Conductive Ink Market Revenue (Million), by Application 2025 & 2033
- Figure 56: Middle East and Africa Non-Conductive Ink Market Volume (K Tons), by Application 2025 & 2033
- Figure 57: Middle East and Africa Non-Conductive Ink Market Revenue Share (%), by Application 2025 & 2033
- Figure 58: Middle East and Africa Non-Conductive Ink Market Volume Share (%), by Application 2025 & 2033
- Figure 59: Middle East and Africa Non-Conductive Ink Market Revenue (Million), by Country 2025 & 2033
- Figure 60: Middle East and Africa Non-Conductive Ink Market Volume (K Tons), by Country 2025 & 2033
- Figure 61: Middle East and Africa Non-Conductive Ink Market Revenue Share (%), by Country 2025 & 2033
- Figure 62: Middle East and Africa Non-Conductive Ink Market Volume Share (%), by Country 2025 & 2033
List of Tables
- Table 1: Global Non-Conductive Ink Market Revenue Million Forecast, by Substrate Type 2020 & 2033
- Table 2: Global Non-Conductive Ink Market Volume K Tons Forecast, by Substrate Type 2020 & 2033
- Table 3: Global Non-Conductive Ink Market Revenue Million Forecast, by Application 2020 & 2033
- Table 4: Global Non-Conductive Ink Market Volume K Tons Forecast, by Application 2020 & 2033
- Table 5: Global Non-Conductive Ink Market Revenue Million Forecast, by Region 2020 & 2033
- Table 6: Global Non-Conductive Ink Market Volume K Tons Forecast, by Region 2020 & 2033
- Table 7: Global Non-Conductive Ink Market Revenue Million Forecast, by Substrate Type 2020 & 2033
- Table 8: Global Non-Conductive Ink Market Volume K Tons Forecast, by Substrate Type 2020 & 2033
- Table 9: Global Non-Conductive Ink Market Revenue Million Forecast, by Application 2020 & 2033
- Table 10: Global Non-Conductive Ink Market Volume K Tons Forecast, by Application 2020 & 2033
- Table 11: Global Non-Conductive Ink Market Revenue Million Forecast, by Country 2020 & 2033
- Table 12: Global Non-Conductive Ink Market Volume K Tons Forecast, by Country 2020 & 2033
- Table 13: China Non-Conductive Ink Market Revenue (Million) Forecast, by Application 2020 & 2033
- Table 14: China Non-Conductive Ink Market Volume (K Tons) Forecast, by Application 2020 & 2033
- Table 15: India Non-Conductive Ink Market Revenue (Million) Forecast, by Application 2020 & 2033
- Table 16: India Non-Conductive Ink Market Volume (K Tons) Forecast, by Application 2020 & 2033
- Table 17: Japan Non-Conductive Ink Market Revenue (Million) Forecast, by Application 2020 & 2033
- Table 18: Japan Non-Conductive Ink Market Volume (K Tons) Forecast, by Application 2020 & 2033
- Table 19: South Korea Non-Conductive Ink Market Revenue (Million) Forecast, by Application 2020 & 2033
- Table 20: South Korea Non-Conductive Ink Market Volume (K Tons) Forecast, by Application 2020 & 2033
- Table 21: Rest of Asia Pacific Non-Conductive Ink Market Revenue (Million) Forecast, by Application 2020 & 2033
- Table 22: Rest of Asia Pacific Non-Conductive Ink Market Volume (K Tons) Forecast, by Application 2020 & 2033
- Table 23: Global Non-Conductive Ink Market Revenue Million Forecast, by Substrate Type 2020 & 2033
- Table 24: Global Non-Conductive Ink Market Volume K Tons Forecast, by Substrate Type 2020 & 2033
- Table 25: Global Non-Conductive Ink Market Revenue Million Forecast, by Application 2020 & 2033
- Table 26: Global Non-Conductive Ink Market Volume K Tons Forecast, by Application 2020 & 2033
- Table 27: Global Non-Conductive Ink Market Revenue Million Forecast, by Country 2020 & 2033
- Table 28: Global Non-Conductive Ink Market Volume K Tons Forecast, by Country 2020 & 2033
- Table 29: United States Non-Conductive Ink Market Revenue (Million) Forecast, by Application 2020 & 2033
- Table 30: United States Non-Conductive Ink Market Volume (K Tons) Forecast, by Application 2020 & 2033
- Table 31: Canada Non-Conductive Ink Market Revenue (Million) Forecast, by Application 2020 & 2033
- Table 32: Canada Non-Conductive Ink Market Volume (K Tons) Forecast, by Application 2020 & 2033
- Table 33: Mexico Non-Conductive Ink Market Revenue (Million) Forecast, by Application 2020 & 2033
- Table 34: Mexico Non-Conductive Ink Market Volume (K Tons) Forecast, by Application 2020 & 2033
- Table 35: Global Non-Conductive Ink Market Revenue Million Forecast, by Substrate Type 2020 & 2033
- Table 36: Global Non-Conductive Ink Market Volume K Tons Forecast, by Substrate Type 2020 & 2033
- Table 37: Global Non-Conductive Ink Market Revenue Million Forecast, by Application 2020 & 2033
- Table 38: Global Non-Conductive Ink Market Volume K Tons Forecast, by Application 2020 & 2033
- Table 39: Global Non-Conductive Ink Market Revenue Million Forecast, by Country 2020 & 2033
- Table 40: Global Non-Conductive Ink Market Volume K Tons Forecast, by Country 2020 & 2033
- Table 41: Germany Non-Conductive Ink Market Revenue (Million) Forecast, by Application 2020 & 2033
- Table 42: Germany Non-Conductive Ink Market Volume (K Tons) Forecast, by Application 2020 & 2033
- Table 43: United Kingdom Non-Conductive Ink Market Revenue (Million) Forecast, by Application 2020 & 2033
- Table 44: United Kingdom Non-Conductive Ink Market Volume (K Tons) Forecast, by Application 2020 & 2033
- Table 45: France Non-Conductive Ink Market Revenue (Million) Forecast, by Application 2020 & 2033
- Table 46: France Non-Conductive Ink Market Volume (K Tons) Forecast, by Application 2020 & 2033
- Table 47: Italy Non-Conductive Ink Market Revenue (Million) Forecast, by Application 2020 & 2033
- Table 48: Italy Non-Conductive Ink Market Volume (K Tons) Forecast, by Application 2020 & 2033
- Table 49: Rest of Europe Non-Conductive Ink Market Revenue (Million) Forecast, by Application 2020 & 2033
- Table 50: Rest of Europe Non-Conductive Ink Market Volume (K Tons) Forecast, by Application 2020 & 2033
- Table 51: Global Non-Conductive Ink Market Revenue Million Forecast, by Substrate Type 2020 & 2033
- Table 52: Global Non-Conductive Ink Market Volume K Tons Forecast, by Substrate Type 2020 & 2033
- Table 53: Global Non-Conductive Ink Market Revenue Million Forecast, by Application 2020 & 2033
- Table 54: Global Non-Conductive Ink Market Volume K Tons Forecast, by Application 2020 & 2033
- Table 55: Global Non-Conductive Ink Market Revenue Million Forecast, by Country 2020 & 2033
- Table 56: Global Non-Conductive Ink Market Volume K Tons Forecast, by Country 2020 & 2033
- Table 57: Brazil Non-Conductive Ink Market Revenue (Million) Forecast, by Application 2020 & 2033
- Table 58: Brazil Non-Conductive Ink Market Volume (K Tons) Forecast, by Application 2020 & 2033
- Table 59: Argentina Non-Conductive Ink Market Revenue (Million) Forecast, by Application 2020 & 2033
- Table 60: Argentina Non-Conductive Ink Market Volume (K Tons) Forecast, by Application 2020 & 2033
- Table 61: Rest of South America Non-Conductive Ink Market Revenue (Million) Forecast, by Application 2020 & 2033
- Table 62: Rest of South America Non-Conductive Ink Market Volume (K Tons) Forecast, by Application 2020 & 2033
- Table 63: Global Non-Conductive Ink Market Revenue Million Forecast, by Substrate Type 2020 & 2033
- Table 64: Global Non-Conductive Ink Market Volume K Tons Forecast, by Substrate Type 2020 & 2033
- Table 65: Global Non-Conductive Ink Market Revenue Million Forecast, by Application 2020 & 2033
- Table 66: Global Non-Conductive Ink Market Volume K Tons Forecast, by Application 2020 & 2033
- Table 67: Global Non-Conductive Ink Market Revenue Million Forecast, by Country 2020 & 2033
- Table 68: Global Non-Conductive Ink Market Volume K Tons Forecast, by Country 2020 & 2033
- Table 69: Saudi Arabia Non-Conductive Ink Market Revenue (Million) Forecast, by Application 2020 & 2033
- Table 70: Saudi Arabia Non-Conductive Ink Market Volume (K Tons) Forecast, by Application 2020 & 2033
- Table 71: South Africa Non-Conductive Ink Market Revenue (Million) Forecast, by Application 2020 & 2033
- Table 72: South Africa Non-Conductive Ink Market Volume (K Tons) Forecast, by Application 2020 & 2033
- Table 73: Rest of Middle East and Africa Non-Conductive Ink Market Revenue (Million) Forecast, by Application 2020 & 2033
- Table 74: Rest of Middle East and Africa Non-Conductive Ink Market Volume (K Tons) Forecast, by Application 2020 & 2033
Frequently Asked Questions
1. What is the projected Compound Annual Growth Rate (CAGR) of the Non-Conductive Ink Market?
The projected CAGR is approximately 6.00%.
2. Which companies are prominent players in the Non-Conductive Ink Market?
Key companies in the market include Poly-ink, Teikoku Printing Inks Mfg Co Ltd, SunChemical, DuPont, Vorbeck Materials, Applied Ink Solutions, Henkel Corporation, Creative Materials Inc, Nagase America LLC, NovaCentrix.
3. What are the main segments of the Non-Conductive Ink Market?
The market segments include Substrate Type, Application.
4. Can you provide details about the market size?
The market size is estimated to be USD XX Million as of 2022.
5. What are some drivers contributing to market growth?
; Increasing Demand for Printed Circuit Boards; Growing Electronic and Electrical Industry.
6. What are the notable trends driving market growth?
Increasing Demand for Printed Circuit Boards.
7. Are there any restraints impacting market growth?
; Fluctuation in Raw Material Pricing; Unfavorable Conditions Arising Due to COVID-19 Outbreak.
8. Can you provide examples of recent developments in the market?
N/A
9. What pricing options are available for accessing the report?
Pricing options include single-user, multi-user, and enterprise licenses priced at USD 4750, USD 5250, and USD 8750 respectively.
10. Is the market size provided in terms of value or volume?
The market size is provided in terms of value, measured in Million and volume, measured in K Tons.
11. Are there any specific market keywords associated with the report?
Yes, the market keyword associated with the report is "Non-Conductive Ink Market," which aids in identifying and referencing the specific market segment covered.
12. How do I determine which pricing option suits my needs best?
The pricing options vary based on user requirements and access needs. Individual users may opt for single-user licenses, while businesses requiring broader access may choose multi-user or enterprise licenses for cost-effective access to the report.
13. Are there any additional resources or data provided in the Non-Conductive Ink Market report?
While the report offers comprehensive insights, it's advisable to review the specific contents or supplementary materials provided to ascertain if additional resources or data are available.
14. How can I stay updated on further developments or reports in the Non-Conductive Ink Market?
To stay informed about further developments, trends, and reports in the Non-Conductive Ink Market, consider subscribing to industry newsletters, following relevant companies and organizations, or regularly checking reputable industry news sources and publications.
Methodology
Step 1 - Identification of Relevant Samples Size from Population Database


Step 2 - Approaches for Defining Global Market Size (Value, Volume* & Price*)

Note*: In applicable scenarios
Step 3 - Data Sources
Primary Research
- Web Analytics
- Survey Reports
- Research Institute
- Latest Research Reports
- Opinion Leaders
Secondary Research
- Annual Reports
- White Paper
- Latest Press Release
- Industry Association
- Paid Database
- Investor Presentations

Step 4 - Data Triangulation
Involves using different sources of information in order to increase the validity of a study
These sources are likely to be stakeholders in a program - participants, other researchers, program staff, other community members, and so on.
Then we put all data in single framework & apply various statistical tools to find out the dynamic on the market.
During the analysis stage, feedback from the stakeholder groups would be compared to determine areas of agreement as well as areas of divergence