

Key Insights
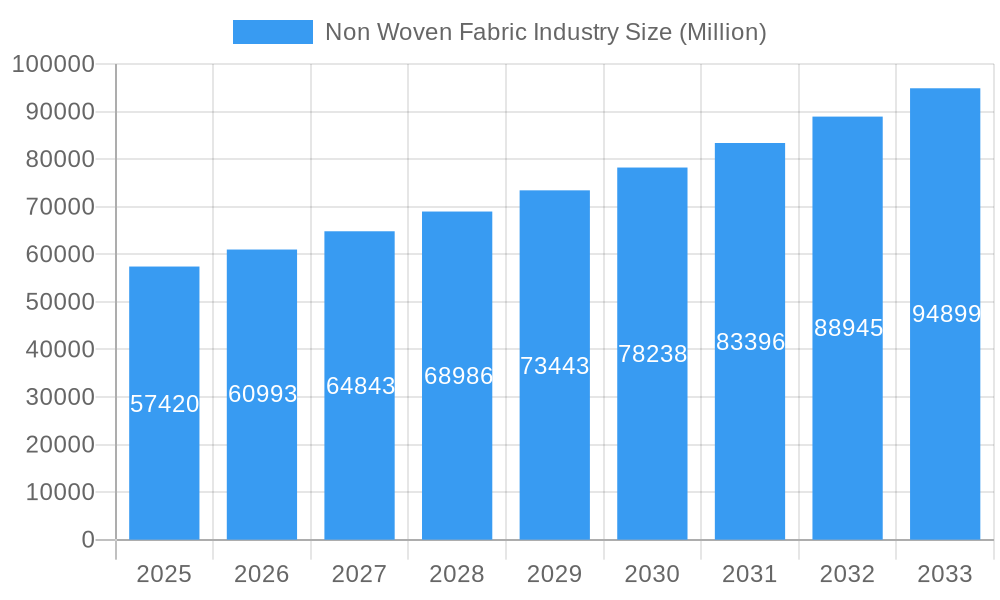
The non-woven fabric industry, currently valued at $57.42 billion in 2025, is projected to experience robust growth, exhibiting a compound annual growth rate (CAGR) of 6.11% from 2025 to 2033. This expansion is driven by several key factors. Increasing demand from diverse end-use sectors, including construction (for insulation and geotextiles), healthcare (for hygiene products and medical apparel), and automotive (for interior components and filtration systems), fuels market growth. Technological advancements in spun-bond, meltblown, and wet-laid technologies are leading to the development of innovative non-woven fabrics with enhanced properties like strength, breathability, and biodegradability. The rising popularity of sustainable and eco-friendly materials, such as those derived from recycled polyester and bio-based sources like cotton and rayon, is further contributing to industry expansion. However, challenges such as fluctuating raw material prices and concerns about environmental impact related to certain manufacturing processes act as potential restraints to growth. Polypropylene continues to dominate the materials segment due to its cost-effectiveness and versatility, although polyester and bio-based options are gaining traction. Geographically, North America and Asia Pacific represent major market regions, with China and the United States leading in consumption. The industry is characterized by a mix of large multinational corporations and smaller specialized manufacturers, fostering both competition and innovation.
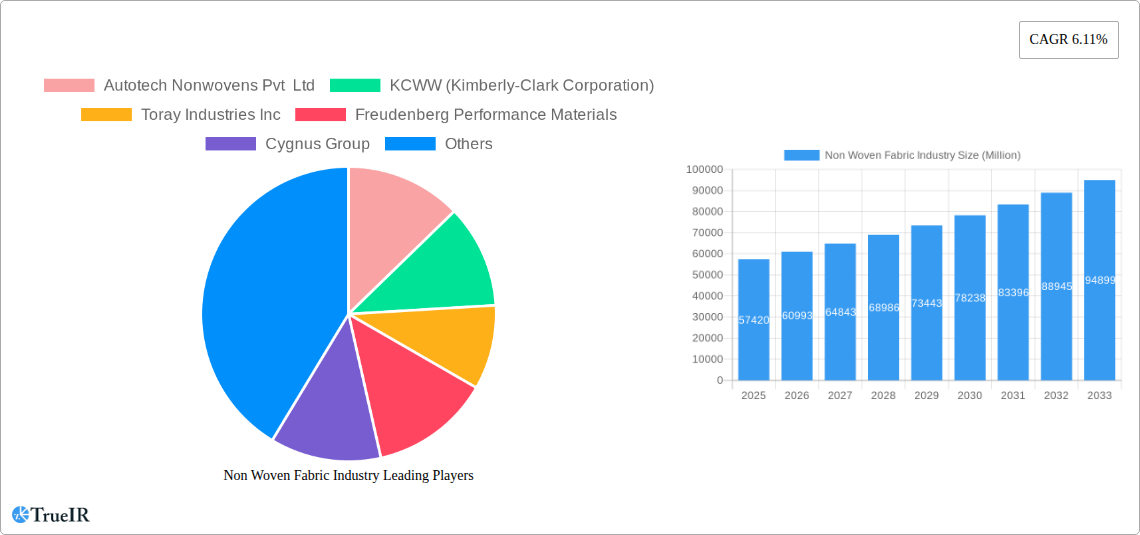
Non Woven Fabric Industry Market Size (In Billion)
The forecast period (2025-2033) will witness continued diversification within the non-woven fabric market. We anticipate growth in specialized applications such as advanced filtration systems for industrial and medical use, as well as increased adoption of non-wovens in sustainable packaging solutions. Regional growth will vary, with developing economies in Asia-Pacific likely experiencing faster expansion due to increasing infrastructure development and rising disposable incomes. The industry is likely to see strategic mergers and acquisitions as companies seek to expand their product portfolios and market reach. Further innovation in material science will continue to be a key driver, with a focus on developing high-performance, recyclable, and biodegradable non-woven fabrics to meet evolving consumer preferences and environmental regulations.
Non Woven Fabric Industry Company Market Share
Non Woven Fabric Industry Market Report: 2019-2033
This comprehensive report provides a detailed analysis of the Non Woven Fabric industry, encompassing market size, growth projections, competitive landscape, and future outlook. The study period covers 2019-2033, with a base year of 2025 and a forecast period of 2025-2033. The report leverages extensive primary and secondary research to deliver actionable insights for industry stakeholders, investors, and researchers. Expect a granular analysis of key segments including spunbond, meltblown, polypropylene, and polyester nonwovens across diverse end-use sectors like healthcare, construction, and automotive. This report projects a market valued at over $XX Million by 2033.
Non Woven Fabric Industry Market Structure & Competitive Landscape
The global nonwoven fabric industry is characterized by a dynamic and evolving market structure. While a few major enterprises command a significant portion of the market share, the landscape is also populated by numerous specialized and agile smaller companies that thrive in niche applications. The Herfindahl-Hirschman Index (HHI) is estimated to be around xx, suggesting a moderately concentrated market. However, the competitive intensity is amplified by continuous innovation, where companies are making substantial investments in Research and Development (R&D). This focus on R&D drives the creation of novel materials, advanced manufacturing processes, and expanded application possibilities. Key external forces shaping the industry include evolving regulatory frameworks, particularly those emphasizing environmental sustainability and material safety, which necessitate adaptive strategies. Furthermore, the threat of product substitution, primarily from sustainable natural fibers and other alternative materials, remains a significant consideration for established players. The industry also experiences a robust trend of mergers and acquisitions (M&A), as leading companies strategically consolidate their market positions and broaden their product portfolios. During the historical period from 2019 to 2024, M&A transactions valued at approximately xx Million USD were recorded, with projections indicating a continued upward trajectory in the forecast period.
- Market Concentration: A moderately concentrated market, with an estimated HHI of xx, demonstrating a balance between large players and smaller, specialized firms.
- Innovation Drivers: Significant R&D investments are at the forefront, focusing on developing groundbreaking materials, optimizing manufacturing processes, and exploring new end-use applications.
- Regulatory Impacts: Stringent environmental regulations and evolving material safety standards play a crucial role in shaping industry operations and product development.
- Product Substitutes: The increasing availability and adoption of natural fibers and other eco-friendly alternatives present a continuous challenge and opportunity for innovation.
- End-User Segmentation: The market is highly diversified across a multitude of sectors, each exhibiting unique growth patterns and demand drivers.
- M&A Trends: A prominent feature of the market, driven by strategic objectives of consolidation, market share expansion, and portfolio diversification.
Non Woven Fabric Industry Market Trends & Opportunities
The global nonwoven fabric market is experiencing robust growth, driven by increasing demand from diverse end-use industries. The market is projected to achieve a Compound Annual Growth Rate (CAGR) of xx% during the forecast period (2025-2033), reaching a value exceeding $XX Million. Technological advancements, particularly in meltblown and spunbond technologies, are leading to the development of high-performance nonwovens with enhanced properties. Consumer preferences are shifting towards sustainable and eco-friendly options, driving the demand for bio-based and recycled nonwovens. Intense competition among established players and new entrants necessitates continuous innovation and differentiation strategies. Market penetration rates vary significantly across different regions and end-use segments, reflecting variations in economic growth, infrastructure development, and regulatory environments. The increasing adoption of nonwovens in hygiene products, medical applications, and construction materials fuels market expansion. Emerging applications in advanced filtration, composite materials, and protective apparel offer substantial growth opportunities.
Dominant Markets & Segments in Non Woven Fabric Industry
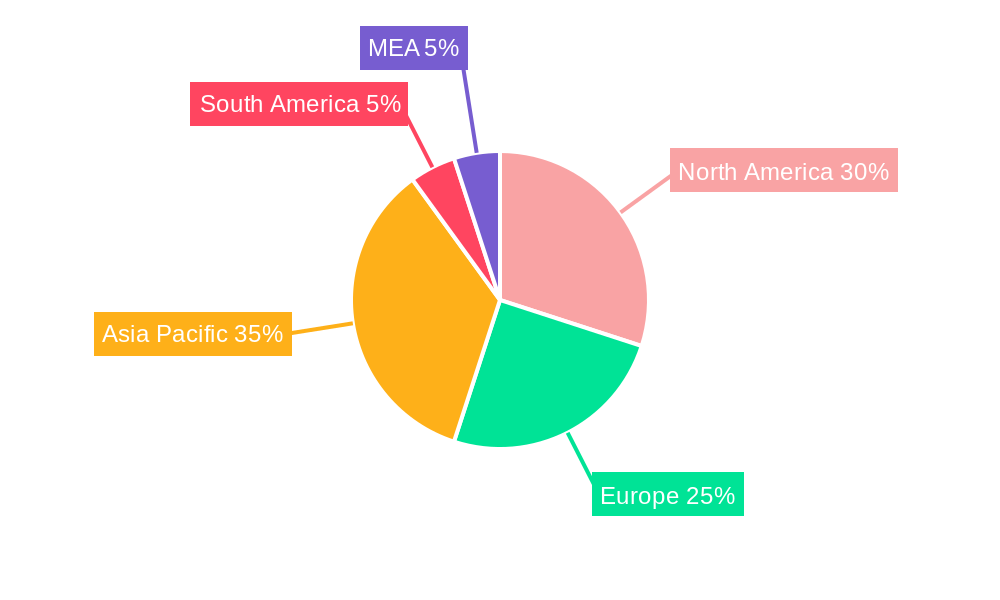
The Asia-Pacific region stands as the undisputed leader in the global nonwoven fabric market, largely propelled by robust industrial expansion and rapid urbanization. Within this powerhouse region, China and India are the primary consumers, significantly influencing global demand. Concurrently, North America and Europe are witnessing substantial market growth, fueled by substantial investments in critical sectors such as infrastructure development, advanced healthcare solutions, and the evolving automotive industry.
Leading Segments:
- Technology: The spunbond technology continues to hold the largest market share, closely followed by meltblown and wet-laid processes, each catering to distinct performance requirements.
- Material: Polypropylene remains the dominant material due to its exceptional cost-effectiveness and remarkable versatility across various applications. Polyester and polyethylene also maintain significant market presence.
- End-user Industry: The construction industry is currently the largest consumer of nonwoven fabrics, driven by their extensive use in geotextiles, roofing membranes, and insulation materials. The healthcare and automotive sectors are also substantial contributors to market demand.
Key Growth Drivers:
- Infrastructure Development: Ambitious large-scale infrastructure projects, particularly in emerging economies, are a significant catalyst for increased nonwoven fabric demand.
- Healthcare Advancements: Escalating global healthcare expenditure and a growing emphasis on hygiene products are consistently fueling market expansion in this critical sector.
- Automotive Innovation: The automotive industry's focus on lightweighting and advanced filtration systems is driving the adoption of high-performance nonwoven materials.
Non Woven Fabric Industry Product Analysis
The nonwoven fabric industry offers an expansive array of products meticulously engineered to meet the specific demands of diverse end-use applications. Current innovation trends are heavily centered on enhancing intrinsic material properties such as tensile strength, breathability, and biodegradability. Sophisticated advancements in fiber spinning techniques, bonding methodologies, and surface treatments are enabling a high degree of customization for nonwovens, allowing them to achieve precise performance benchmarks. Products that exhibit superior filtration efficiency, exceptional thermal insulation capabilities, and robust antimicrobial properties are experiencing a surge in market acceptance. The primary competitive differentiator in this market lies in the ability to deliver high-performance products at attractive price points, complemented by exceptional customer support and a resilient, efficient supply chain management system.
Key Drivers, Barriers & Challenges in Non Woven Fabric Industry
Key Drivers:
- Technological advancements: Development of innovative materials like bio-based nonwovens and improvements in manufacturing processes.
- Economic growth: Rising disposable income and increasing construction activities in developing nations.
- Favorable government policies: Incentives and subsidies promoting the adoption of sustainable materials.
Key Challenges:
- Supply chain disruptions: Fluctuations in raw material prices and geopolitical uncertainties impact production costs and delivery timelines.
- Regulatory hurdles: Compliance with stringent environmental regulations and safety standards.
- Intense competition: Pressure from established players and new entrants vying for market share. The impact of this competition has led to a xx% reduction in profit margins for some companies in the past year.
Growth Drivers in the Non Woven Fabric Industry Market
The nonwoven fabric market's growth trajectory is robust, propelled by increasing demand across a wide spectrum of industries. Technological innovations, particularly in meltblown and spunbond technologies, are consistently leading to the development of higher-performing nonwovens. The accelerating adoption of sustainable materials is a significant market booster, further supported by favorable government regulations that actively encourage the use of eco-friendly alternatives. The continuous growth of the global population and ongoing urbanization trends are driving a sustained increase in the demand for nonwovens across diverse applications, including essential sectors like healthcare, personal hygiene, and construction.
Challenges Impacting Non Woven Fabric Industry Growth
The industry faces challenges such as volatile raw material prices, fluctuations in energy costs, and intense competition. Strict environmental regulations and supply chain disruptions present significant hurdles. Meeting the ever-evolving demands for enhanced product performance and sustainability requires continuous investment in R&D and innovation.
Key Players Shaping the Non Woven Fabric Industry Market
- Autotech Nonwovens Pvt Ltd
- KCWW (Kimberly-Clark Corporation)
- Toray Industries Inc
- Freudenberg Performance Materials
- Cygnus Group
- TWE Group
- PFNonwovens Czech SRO
- Eximius Incorporation
- Glatfelter
- DuPont
- Ahlstrom-Munksj
- Fitesa
- Johns Manville
- Paramount Tech Fab Industries
- Berry Global Inc
Significant Non Woven Fabric Industry Industry Milestones
- June 2022: Asten Johnson announced the creation of its new division, AJ Nonwovens, aiming to increase production capacity and speed in the North American market. This reflects a strategic move to capitalize on the growing demand for nonwovens in the region.
- August 2022: Willacoochee Industrial Fabrics, Inc. (WINFAB) invested in a new state-of-the-art nonwoven geotextile manufacturing production line, indicating expansion in the geosynthetics market segment. This investment signals confidence in future market growth and increasing demand for high-quality geotextiles.
Future Outlook for Non Woven Fabric Industry Market
The nonwoven fabric industry is poised for continued growth, driven by several factors. Technological advancements, such as the development of biodegradable and recyclable materials, will play a significant role. Increasing demand from key end-use sectors, such as healthcare, automotive, and construction, will propel market expansion. Strategic acquisitions and partnerships will further shape the industry landscape. The focus on sustainability and eco-friendly practices will be crucial for long-term growth. The market holds significant potential, with opportunities for innovation and expansion across various geographic regions and applications.
Non Woven Fabric Industry Segmentation
-
1. Technology
- 1.1. Spun-bond
- 1.2. Wet-laid
- 1.3. Dry-laid
- 1.4. Other Technologies (Meltblown, and others)
-
2. Material
- 2.1. Polyester
- 2.2. Polypropylene
- 2.3. Polyethylene
- 2.4. Rayon (Viscose)
- 2.5. Other Materials (Cotton and other bio based)
-
3. End-user Industry
- 3.1. Construction
- 3.2. Textile
- 3.3. Healthcare
- 3.4. Automotive
- 3.5. Other En
Non Woven Fabric Industry Segmentation By Geography
-
1. Asia Pacific
- 1.1. China
- 1.2. India
- 1.3. Japan
- 1.4. South Korea
- 1.5. Malaysia
- 1.6. Thailand
- 1.7. Indonesia
- 1.8. Vietnam
- 1.9. Rest of Asia Pacific
-
2. North America
- 2.1. United States
- 2.2. Canada
- 2.3. Mexico
-
3. Europe
- 3.1. Germany
- 3.2. United Kingdom
- 3.3. France
- 3.4. Italy
- 3.5. Spain
- 3.6. Turkey
- 3.7. Russia
- 3.8. NORDIC Countries
- 3.9. Rest of Europe
-
4. South America
- 4.1. Brazil
- 4.2. Argentina
- 4.3. Colombia
- 4.4. Rest of South America
-
5. Middle East and Africa
- 5.1. Saudi Arabia
- 5.2. Nigeria
- 5.3. Qatar
- 5.4. Egypt
- 5.5. United Arab Emirates
- 5.6. South Africa
- 5.7. Rest of Middle East and Africa
Non Woven Fabric Industry Regional Market Share
Geographic Coverage of Non Woven Fabric Industry
Non Woven Fabric Industry REPORT HIGHLIGHTS
| Aspects | Details |
|---|---|
| Study Period | 2020-2034 |
| Base Year | 2025 |
| Estimated Year | 2026 |
| Forecast Period | 2026-2034 |
| Historical Period | 2020-2025 |
| Growth Rate | CAGR of 6.11% from 2020-2034 |
| Segmentation |
|
Table of Contents
- 1. Introduction
- 1.1. Research Scope
- 1.2. Market Segmentation
- 1.3. Research Objective
- 1.4. Definitions and Assumptions
- 2. Executive Summary
- 2.1. Market Snapshot
- 3. Market Dynamics
- 3.1. Market Drivers
- 3.2. Market Restrains
- 3.3. Market Trends
- 3.4. Market Opportunities
- 4. Market Factor Analysis
- 4.1. Porters Five Forces
- 4.1.1. Bargaining Power of Suppliers
- 4.1.2. Bargaining Power of Buyers
- 4.1.3. Threat of New Entrants
- 4.1.4. Threat of Substitutes
- 4.1.5. Competitive Rivalry
- 4.2. PESTEL analysis
- 4.3. BCG Analysis
- 4.3.1. Stars (High Growth, High Market Share)
- 4.3.2. Cash Cows (Low Growth, High Market Share)
- 4.3.3. Question Mark (High Growth, Low Market Share)
- 4.3.4. Dogs (Low Growth, Low Market Share)
- 4.4. Ansoff Matrix Analysis
- 4.5. Supply Chain Analysis
- 4.6. Regulatory Landscape
- 4.7. Current Market Potential and Opportunity Assessment (TAM–SAM–SOM Framework)
- 4.8. TIR Analyst Note
- 4.1. Porters Five Forces
- 5. Market Analysis, Insights and Forecast 2021-2033
- 5.1. Market Analysis, Insights and Forecast - by Technology
- 5.1.1. Spun-bond
- 5.1.2. Wet-laid
- 5.1.3. Dry-laid
- 5.1.4. Other Technologies (Meltblown, and others)
- 5.2. Market Analysis, Insights and Forecast - by Material
- 5.2.1. Polyester
- 5.2.2. Polypropylene
- 5.2.3. Polyethylene
- 5.2.4. Rayon (Viscose)
- 5.2.5. Other Materials (Cotton and other bio based)
- 5.3. Market Analysis, Insights and Forecast - by End-user Industry
- 5.3.1. Construction
- 5.3.2. Textile
- 5.3.3. Healthcare
- 5.3.4. Automotive
- 5.3.5. Other En
- 5.4. Market Analysis, Insights and Forecast - by Region
- 5.4.1. Asia Pacific
- 5.4.2. North America
- 5.4.3. Europe
- 5.4.4. South America
- 5.4.5. Middle East and Africa
- 5.1. Market Analysis, Insights and Forecast - by Technology
- 6. Global Non Woven Fabric Industry Analysis, Insights and Forecast, 2021-2033
- 6.1. Market Analysis, Insights and Forecast - by Technology
- 6.1.1. Spun-bond
- 6.1.2. Wet-laid
- 6.1.3. Dry-laid
- 6.1.4. Other Technologies (Meltblown, and others)
- 6.2. Market Analysis, Insights and Forecast - by Material
- 6.2.1. Polyester
- 6.2.2. Polypropylene
- 6.2.3. Polyethylene
- 6.2.4. Rayon (Viscose)
- 6.2.5. Other Materials (Cotton and other bio based)
- 6.3. Market Analysis, Insights and Forecast - by End-user Industry
- 6.3.1. Construction
- 6.3.2. Textile
- 6.3.3. Healthcare
- 6.3.4. Automotive
- 6.3.5. Other En
- 6.1. Market Analysis, Insights and Forecast - by Technology
- 7. Asia Pacific Non Woven Fabric Industry Analysis, Insights and Forecast, 2020-2032
- 7.1. Market Analysis, Insights and Forecast - by Technology
- 7.1.1. Spun-bond
- 7.1.2. Wet-laid
- 7.1.3. Dry-laid
- 7.1.4. Other Technologies (Meltblown, and others)
- 7.2. Market Analysis, Insights and Forecast - by Material
- 7.2.1. Polyester
- 7.2.2. Polypropylene
- 7.2.3. Polyethylene
- 7.2.4. Rayon (Viscose)
- 7.2.5. Other Materials (Cotton and other bio based)
- 7.3. Market Analysis, Insights and Forecast - by End-user Industry
- 7.3.1. Construction
- 7.3.2. Textile
- 7.3.3. Healthcare
- 7.3.4. Automotive
- 7.3.5. Other En
- 7.1. Market Analysis, Insights and Forecast - by Technology
- 8. North America Non Woven Fabric Industry Analysis, Insights and Forecast, 2020-2032
- 8.1. Market Analysis, Insights and Forecast - by Technology
- 8.1.1. Spun-bond
- 8.1.2. Wet-laid
- 8.1.3. Dry-laid
- 8.1.4. Other Technologies (Meltblown, and others)
- 8.2. Market Analysis, Insights and Forecast - by Material
- 8.2.1. Polyester
- 8.2.2. Polypropylene
- 8.2.3. Polyethylene
- 8.2.4. Rayon (Viscose)
- 8.2.5. Other Materials (Cotton and other bio based)
- 8.3. Market Analysis, Insights and Forecast - by End-user Industry
- 8.3.1. Construction
- 8.3.2. Textile
- 8.3.3. Healthcare
- 8.3.4. Automotive
- 8.3.5. Other En
- 8.1. Market Analysis, Insights and Forecast - by Technology
- 9. Europe Non Woven Fabric Industry Analysis, Insights and Forecast, 2020-2032
- 9.1. Market Analysis, Insights and Forecast - by Technology
- 9.1.1. Spun-bond
- 9.1.2. Wet-laid
- 9.1.3. Dry-laid
- 9.1.4. Other Technologies (Meltblown, and others)
- 9.2. Market Analysis, Insights and Forecast - by Material
- 9.2.1. Polyester
- 9.2.2. Polypropylene
- 9.2.3. Polyethylene
- 9.2.4. Rayon (Viscose)
- 9.2.5. Other Materials (Cotton and other bio based)
- 9.3. Market Analysis, Insights and Forecast - by End-user Industry
- 9.3.1. Construction
- 9.3.2. Textile
- 9.3.3. Healthcare
- 9.3.4. Automotive
- 9.3.5. Other En
- 9.1. Market Analysis, Insights and Forecast - by Technology
- 10. South America Non Woven Fabric Industry Analysis, Insights and Forecast, 2020-2032
- 10.1. Market Analysis, Insights and Forecast - by Technology
- 10.1.1. Spun-bond
- 10.1.2. Wet-laid
- 10.1.3. Dry-laid
- 10.1.4. Other Technologies (Meltblown, and others)
- 10.2. Market Analysis, Insights and Forecast - by Material
- 10.2.1. Polyester
- 10.2.2. Polypropylene
- 10.2.3. Polyethylene
- 10.2.4. Rayon (Viscose)
- 10.2.5. Other Materials (Cotton and other bio based)
- 10.3. Market Analysis, Insights and Forecast - by End-user Industry
- 10.3.1. Construction
- 10.3.2. Textile
- 10.3.3. Healthcare
- 10.3.4. Automotive
- 10.3.5. Other En
- 10.1. Market Analysis, Insights and Forecast - by Technology
- 11. Middle East and Africa Non Woven Fabric Industry Analysis, Insights and Forecast, 2020-2032
- 11.1. Market Analysis, Insights and Forecast - by Technology
- 11.1.1. Spun-bond
- 11.1.2. Wet-laid
- 11.1.3. Dry-laid
- 11.1.4. Other Technologies (Meltblown, and others)
- 11.2. Market Analysis, Insights and Forecast - by Material
- 11.2.1. Polyester
- 11.2.2. Polypropylene
- 11.2.3. Polyethylene
- 11.2.4. Rayon (Viscose)
- 11.2.5. Other Materials (Cotton and other bio based)
- 11.3. Market Analysis, Insights and Forecast - by End-user Industry
- 11.3.1. Construction
- 11.3.2. Textile
- 11.3.3. Healthcare
- 11.3.4. Automotive
- 11.3.5. Other En
- 11.1. Market Analysis, Insights and Forecast - by Technology
- 12. Competitive Analysis
- 12.1. Company Profiles
- 12.1.1 Autotech Nonwovens Pvt Ltd
- 12.1.1.1. Company Overview
- 12.1.1.2. Products
- 12.1.1.3. Company Financials
- 12.1.1.4. SWOT Analysis
- 12.1.2 KCWW (Kimberly-Clark Corporation)
- 12.1.2.1. Company Overview
- 12.1.2.2. Products
- 12.1.2.3. Company Financials
- 12.1.2.4. SWOT Analysis
- 12.1.3 Toray Industries Inc
- 12.1.3.1. Company Overview
- 12.1.3.2. Products
- 12.1.3.3. Company Financials
- 12.1.3.4. SWOT Analysis
- 12.1.4 Freudenberg Performance Materials
- 12.1.4.1. Company Overview
- 12.1.4.2. Products
- 12.1.4.3. Company Financials
- 12.1.4.4. SWOT Analysis
- 12.1.5 Cygnus Group
- 12.1.5.1. Company Overview
- 12.1.5.2. Products
- 12.1.5.3. Company Financials
- 12.1.5.4. SWOT Analysis
- 12.1.6 TWE Group*List Not Exhaustive
- 12.1.6.1. Company Overview
- 12.1.6.2. Products
- 12.1.6.3. Company Financials
- 12.1.6.4. SWOT Analysis
- 12.1.7 PFNonwovens Czech SRO
- 12.1.7.1. Company Overview
- 12.1.7.2. Products
- 12.1.7.3. Company Financials
- 12.1.7.4. SWOT Analysis
- 12.1.8 Eximius Incorporation
- 12.1.8.1. Company Overview
- 12.1.8.2. Products
- 12.1.8.3. Company Financials
- 12.1.8.4. SWOT Analysis
- 12.1.9 Glatfelter
- 12.1.9.1. Company Overview
- 12.1.9.2. Products
- 12.1.9.3. Company Financials
- 12.1.9.4. SWOT Analysis
- 12.1.10 DuPont
- 12.1.10.1. Company Overview
- 12.1.10.2. Products
- 12.1.10.3. Company Financials
- 12.1.10.4. SWOT Analysis
- 12.1.11 Ahlstrom-Munksj
- 12.1.11.1. Company Overview
- 12.1.11.2. Products
- 12.1.11.3. Company Financials
- 12.1.11.4. SWOT Analysis
- 12.1.12 Fitesa
- 12.1.12.1. Company Overview
- 12.1.12.2. Products
- 12.1.12.3. Company Financials
- 12.1.12.4. SWOT Analysis
- 12.1.13 Johns Manville
- 12.1.13.1. Company Overview
- 12.1.13.2. Products
- 12.1.13.3. Company Financials
- 12.1.13.4. SWOT Analysis
- 12.1.14 Paramount Tech Fab Industries
- 12.1.14.1. Company Overview
- 12.1.14.2. Products
- 12.1.14.3. Company Financials
- 12.1.14.4. SWOT Analysis
- 12.1.15 Berry Global Inc
- 12.1.15.1. Company Overview
- 12.1.15.2. Products
- 12.1.15.3. Company Financials
- 12.1.15.4. SWOT Analysis
- 12.1.1 Autotech Nonwovens Pvt Ltd
- 12.2. Market Entropy
- 12.2.1 Company's Key Areas Served
- 12.2.2 Recent Developments
- 12.3. Company Market Share Analysis 2025
- 12.3.1 Top 5 Companies Market Share Analysis
- 12.3.2 Top 3 Companies Market Share Analysis
- 12.4. List of Potential Customers
- 13. Research Methodology
List of Figures
- Figure 1: Global Non Woven Fabric Industry Revenue Breakdown (Million, %) by Region 2025 & 2033
- Figure 2: Global Non Woven Fabric Industry Volume Breakdown (K Tons, %) by Region 2025 & 2033
- Figure 3: Asia Pacific Non Woven Fabric Industry Revenue (Million), by Technology 2025 & 2033
- Figure 4: Asia Pacific Non Woven Fabric Industry Volume (K Tons), by Technology 2025 & 2033
- Figure 5: Asia Pacific Non Woven Fabric Industry Revenue Share (%), by Technology 2025 & 2033
- Figure 6: Asia Pacific Non Woven Fabric Industry Volume Share (%), by Technology 2025 & 2033
- Figure 7: Asia Pacific Non Woven Fabric Industry Revenue (Million), by Material 2025 & 2033
- Figure 8: Asia Pacific Non Woven Fabric Industry Volume (K Tons), by Material 2025 & 2033
- Figure 9: Asia Pacific Non Woven Fabric Industry Revenue Share (%), by Material 2025 & 2033
- Figure 10: Asia Pacific Non Woven Fabric Industry Volume Share (%), by Material 2025 & 2033
- Figure 11: Asia Pacific Non Woven Fabric Industry Revenue (Million), by End-user Industry 2025 & 2033
- Figure 12: Asia Pacific Non Woven Fabric Industry Volume (K Tons), by End-user Industry 2025 & 2033
- Figure 13: Asia Pacific Non Woven Fabric Industry Revenue Share (%), by End-user Industry 2025 & 2033
- Figure 14: Asia Pacific Non Woven Fabric Industry Volume Share (%), by End-user Industry 2025 & 2033
- Figure 15: Asia Pacific Non Woven Fabric Industry Revenue (Million), by Country 2025 & 2033
- Figure 16: Asia Pacific Non Woven Fabric Industry Volume (K Tons), by Country 2025 & 2033
- Figure 17: Asia Pacific Non Woven Fabric Industry Revenue Share (%), by Country 2025 & 2033
- Figure 18: Asia Pacific Non Woven Fabric Industry Volume Share (%), by Country 2025 & 2033
- Figure 19: North America Non Woven Fabric Industry Revenue (Million), by Technology 2025 & 2033
- Figure 20: North America Non Woven Fabric Industry Volume (K Tons), by Technology 2025 & 2033
- Figure 21: North America Non Woven Fabric Industry Revenue Share (%), by Technology 2025 & 2033
- Figure 22: North America Non Woven Fabric Industry Volume Share (%), by Technology 2025 & 2033
- Figure 23: North America Non Woven Fabric Industry Revenue (Million), by Material 2025 & 2033
- Figure 24: North America Non Woven Fabric Industry Volume (K Tons), by Material 2025 & 2033
- Figure 25: North America Non Woven Fabric Industry Revenue Share (%), by Material 2025 & 2033
- Figure 26: North America Non Woven Fabric Industry Volume Share (%), by Material 2025 & 2033
- Figure 27: North America Non Woven Fabric Industry Revenue (Million), by End-user Industry 2025 & 2033
- Figure 28: North America Non Woven Fabric Industry Volume (K Tons), by End-user Industry 2025 & 2033
- Figure 29: North America Non Woven Fabric Industry Revenue Share (%), by End-user Industry 2025 & 2033
- Figure 30: North America Non Woven Fabric Industry Volume Share (%), by End-user Industry 2025 & 2033
- Figure 31: North America Non Woven Fabric Industry Revenue (Million), by Country 2025 & 2033
- Figure 32: North America Non Woven Fabric Industry Volume (K Tons), by Country 2025 & 2033
- Figure 33: North America Non Woven Fabric Industry Revenue Share (%), by Country 2025 & 2033
- Figure 34: North America Non Woven Fabric Industry Volume Share (%), by Country 2025 & 2033
- Figure 35: Europe Non Woven Fabric Industry Revenue (Million), by Technology 2025 & 2033
- Figure 36: Europe Non Woven Fabric Industry Volume (K Tons), by Technology 2025 & 2033
- Figure 37: Europe Non Woven Fabric Industry Revenue Share (%), by Technology 2025 & 2033
- Figure 38: Europe Non Woven Fabric Industry Volume Share (%), by Technology 2025 & 2033
- Figure 39: Europe Non Woven Fabric Industry Revenue (Million), by Material 2025 & 2033
- Figure 40: Europe Non Woven Fabric Industry Volume (K Tons), by Material 2025 & 2033
- Figure 41: Europe Non Woven Fabric Industry Revenue Share (%), by Material 2025 & 2033
- Figure 42: Europe Non Woven Fabric Industry Volume Share (%), by Material 2025 & 2033
- Figure 43: Europe Non Woven Fabric Industry Revenue (Million), by End-user Industry 2025 & 2033
- Figure 44: Europe Non Woven Fabric Industry Volume (K Tons), by End-user Industry 2025 & 2033
- Figure 45: Europe Non Woven Fabric Industry Revenue Share (%), by End-user Industry 2025 & 2033
- Figure 46: Europe Non Woven Fabric Industry Volume Share (%), by End-user Industry 2025 & 2033
- Figure 47: Europe Non Woven Fabric Industry Revenue (Million), by Country 2025 & 2033
- Figure 48: Europe Non Woven Fabric Industry Volume (K Tons), by Country 2025 & 2033
- Figure 49: Europe Non Woven Fabric Industry Revenue Share (%), by Country 2025 & 2033
- Figure 50: Europe Non Woven Fabric Industry Volume Share (%), by Country 2025 & 2033
- Figure 51: South America Non Woven Fabric Industry Revenue (Million), by Technology 2025 & 2033
- Figure 52: South America Non Woven Fabric Industry Volume (K Tons), by Technology 2025 & 2033
- Figure 53: South America Non Woven Fabric Industry Revenue Share (%), by Technology 2025 & 2033
- Figure 54: South America Non Woven Fabric Industry Volume Share (%), by Technology 2025 & 2033
- Figure 55: South America Non Woven Fabric Industry Revenue (Million), by Material 2025 & 2033
- Figure 56: South America Non Woven Fabric Industry Volume (K Tons), by Material 2025 & 2033
- Figure 57: South America Non Woven Fabric Industry Revenue Share (%), by Material 2025 & 2033
- Figure 58: South America Non Woven Fabric Industry Volume Share (%), by Material 2025 & 2033
- Figure 59: South America Non Woven Fabric Industry Revenue (Million), by End-user Industry 2025 & 2033
- Figure 60: South America Non Woven Fabric Industry Volume (K Tons), by End-user Industry 2025 & 2033
- Figure 61: South America Non Woven Fabric Industry Revenue Share (%), by End-user Industry 2025 & 2033
- Figure 62: South America Non Woven Fabric Industry Volume Share (%), by End-user Industry 2025 & 2033
- Figure 63: South America Non Woven Fabric Industry Revenue (Million), by Country 2025 & 2033
- Figure 64: South America Non Woven Fabric Industry Volume (K Tons), by Country 2025 & 2033
- Figure 65: South America Non Woven Fabric Industry Revenue Share (%), by Country 2025 & 2033
- Figure 66: South America Non Woven Fabric Industry Volume Share (%), by Country 2025 & 2033
- Figure 67: Middle East and Africa Non Woven Fabric Industry Revenue (Million), by Technology 2025 & 2033
- Figure 68: Middle East and Africa Non Woven Fabric Industry Volume (K Tons), by Technology 2025 & 2033
- Figure 69: Middle East and Africa Non Woven Fabric Industry Revenue Share (%), by Technology 2025 & 2033
- Figure 70: Middle East and Africa Non Woven Fabric Industry Volume Share (%), by Technology 2025 & 2033
- Figure 71: Middle East and Africa Non Woven Fabric Industry Revenue (Million), by Material 2025 & 2033
- Figure 72: Middle East and Africa Non Woven Fabric Industry Volume (K Tons), by Material 2025 & 2033
- Figure 73: Middle East and Africa Non Woven Fabric Industry Revenue Share (%), by Material 2025 & 2033
- Figure 74: Middle East and Africa Non Woven Fabric Industry Volume Share (%), by Material 2025 & 2033
- Figure 75: Middle East and Africa Non Woven Fabric Industry Revenue (Million), by End-user Industry 2025 & 2033
- Figure 76: Middle East and Africa Non Woven Fabric Industry Volume (K Tons), by End-user Industry 2025 & 2033
- Figure 77: Middle East and Africa Non Woven Fabric Industry Revenue Share (%), by End-user Industry 2025 & 2033
- Figure 78: Middle East and Africa Non Woven Fabric Industry Volume Share (%), by End-user Industry 2025 & 2033
- Figure 79: Middle East and Africa Non Woven Fabric Industry Revenue (Million), by Country 2025 & 2033
- Figure 80: Middle East and Africa Non Woven Fabric Industry Volume (K Tons), by Country 2025 & 2033
- Figure 81: Middle East and Africa Non Woven Fabric Industry Revenue Share (%), by Country 2025 & 2033
- Figure 82: Middle East and Africa Non Woven Fabric Industry Volume Share (%), by Country 2025 & 2033
List of Tables
- Table 1: Global Non Woven Fabric Industry Revenue Million Forecast, by Technology 2020 & 2033
- Table 2: Global Non Woven Fabric Industry Volume K Tons Forecast, by Technology 2020 & 2033
- Table 3: Global Non Woven Fabric Industry Revenue Million Forecast, by Material 2020 & 2033
- Table 4: Global Non Woven Fabric Industry Volume K Tons Forecast, by Material 2020 & 2033
- Table 5: Global Non Woven Fabric Industry Revenue Million Forecast, by End-user Industry 2020 & 2033
- Table 6: Global Non Woven Fabric Industry Volume K Tons Forecast, by End-user Industry 2020 & 2033
- Table 7: Global Non Woven Fabric Industry Revenue Million Forecast, by Region 2020 & 2033
- Table 8: Global Non Woven Fabric Industry Volume K Tons Forecast, by Region 2020 & 2033
- Table 9: Global Non Woven Fabric Industry Revenue Million Forecast, by Technology 2020 & 2033
- Table 10: Global Non Woven Fabric Industry Volume K Tons Forecast, by Technology 2020 & 2033
- Table 11: Global Non Woven Fabric Industry Revenue Million Forecast, by Material 2020 & 2033
- Table 12: Global Non Woven Fabric Industry Volume K Tons Forecast, by Material 2020 & 2033
- Table 13: Global Non Woven Fabric Industry Revenue Million Forecast, by End-user Industry 2020 & 2033
- Table 14: Global Non Woven Fabric Industry Volume K Tons Forecast, by End-user Industry 2020 & 2033
- Table 15: Global Non Woven Fabric Industry Revenue Million Forecast, by Country 2020 & 2033
- Table 16: Global Non Woven Fabric Industry Volume K Tons Forecast, by Country 2020 & 2033
- Table 17: China Non Woven Fabric Industry Revenue (Million) Forecast, by Application 2020 & 2033
- Table 18: China Non Woven Fabric Industry Volume (K Tons) Forecast, by Application 2020 & 2033
- Table 19: India Non Woven Fabric Industry Revenue (Million) Forecast, by Application 2020 & 2033
- Table 20: India Non Woven Fabric Industry Volume (K Tons) Forecast, by Application 2020 & 2033
- Table 21: Japan Non Woven Fabric Industry Revenue (Million) Forecast, by Application 2020 & 2033
- Table 22: Japan Non Woven Fabric Industry Volume (K Tons) Forecast, by Application 2020 & 2033
- Table 23: South Korea Non Woven Fabric Industry Revenue (Million) Forecast, by Application 2020 & 2033
- Table 24: South Korea Non Woven Fabric Industry Volume (K Tons) Forecast, by Application 2020 & 2033
- Table 25: Malaysia Non Woven Fabric Industry Revenue (Million) Forecast, by Application 2020 & 2033
- Table 26: Malaysia Non Woven Fabric Industry Volume (K Tons) Forecast, by Application 2020 & 2033
- Table 27: Thailand Non Woven Fabric Industry Revenue (Million) Forecast, by Application 2020 & 2033
- Table 28: Thailand Non Woven Fabric Industry Volume (K Tons) Forecast, by Application 2020 & 2033
- Table 29: Indonesia Non Woven Fabric Industry Revenue (Million) Forecast, by Application 2020 & 2033
- Table 30: Indonesia Non Woven Fabric Industry Volume (K Tons) Forecast, by Application 2020 & 2033
- Table 31: Vietnam Non Woven Fabric Industry Revenue (Million) Forecast, by Application 2020 & 2033
- Table 32: Vietnam Non Woven Fabric Industry Volume (K Tons) Forecast, by Application 2020 & 2033
- Table 33: Rest of Asia Pacific Non Woven Fabric Industry Revenue (Million) Forecast, by Application 2020 & 2033
- Table 34: Rest of Asia Pacific Non Woven Fabric Industry Volume (K Tons) Forecast, by Application 2020 & 2033
- Table 35: Global Non Woven Fabric Industry Revenue Million Forecast, by Technology 2020 & 2033
- Table 36: Global Non Woven Fabric Industry Volume K Tons Forecast, by Technology 2020 & 2033
- Table 37: Global Non Woven Fabric Industry Revenue Million Forecast, by Material 2020 & 2033
- Table 38: Global Non Woven Fabric Industry Volume K Tons Forecast, by Material 2020 & 2033
- Table 39: Global Non Woven Fabric Industry Revenue Million Forecast, by End-user Industry 2020 & 2033
- Table 40: Global Non Woven Fabric Industry Volume K Tons Forecast, by End-user Industry 2020 & 2033
- Table 41: Global Non Woven Fabric Industry Revenue Million Forecast, by Country 2020 & 2033
- Table 42: Global Non Woven Fabric Industry Volume K Tons Forecast, by Country 2020 & 2033
- Table 43: United States Non Woven Fabric Industry Revenue (Million) Forecast, by Application 2020 & 2033
- Table 44: United States Non Woven Fabric Industry Volume (K Tons) Forecast, by Application 2020 & 2033
- Table 45: Canada Non Woven Fabric Industry Revenue (Million) Forecast, by Application 2020 & 2033
- Table 46: Canada Non Woven Fabric Industry Volume (K Tons) Forecast, by Application 2020 & 2033
- Table 47: Mexico Non Woven Fabric Industry Revenue (Million) Forecast, by Application 2020 & 2033
- Table 48: Mexico Non Woven Fabric Industry Volume (K Tons) Forecast, by Application 2020 & 2033
- Table 49: Global Non Woven Fabric Industry Revenue Million Forecast, by Technology 2020 & 2033
- Table 50: Global Non Woven Fabric Industry Volume K Tons Forecast, by Technology 2020 & 2033
- Table 51: Global Non Woven Fabric Industry Revenue Million Forecast, by Material 2020 & 2033
- Table 52: Global Non Woven Fabric Industry Volume K Tons Forecast, by Material 2020 & 2033
- Table 53: Global Non Woven Fabric Industry Revenue Million Forecast, by End-user Industry 2020 & 2033
- Table 54: Global Non Woven Fabric Industry Volume K Tons Forecast, by End-user Industry 2020 & 2033
- Table 55: Global Non Woven Fabric Industry Revenue Million Forecast, by Country 2020 & 2033
- Table 56: Global Non Woven Fabric Industry Volume K Tons Forecast, by Country 2020 & 2033
- Table 57: Germany Non Woven Fabric Industry Revenue (Million) Forecast, by Application 2020 & 2033
- Table 58: Germany Non Woven Fabric Industry Volume (K Tons) Forecast, by Application 2020 & 2033
- Table 59: United Kingdom Non Woven Fabric Industry Revenue (Million) Forecast, by Application 2020 & 2033
- Table 60: United Kingdom Non Woven Fabric Industry Volume (K Tons) Forecast, by Application 2020 & 2033
- Table 61: France Non Woven Fabric Industry Revenue (Million) Forecast, by Application 2020 & 2033
- Table 62: France Non Woven Fabric Industry Volume (K Tons) Forecast, by Application 2020 & 2033
- Table 63: Italy Non Woven Fabric Industry Revenue (Million) Forecast, by Application 2020 & 2033
- Table 64: Italy Non Woven Fabric Industry Volume (K Tons) Forecast, by Application 2020 & 2033
- Table 65: Spain Non Woven Fabric Industry Revenue (Million) Forecast, by Application 2020 & 2033
- Table 66: Spain Non Woven Fabric Industry Volume (K Tons) Forecast, by Application 2020 & 2033
- Table 67: Turkey Non Woven Fabric Industry Revenue (Million) Forecast, by Application 2020 & 2033
- Table 68: Turkey Non Woven Fabric Industry Volume (K Tons) Forecast, by Application 2020 & 2033
- Table 69: Russia Non Woven Fabric Industry Revenue (Million) Forecast, by Application 2020 & 2033
- Table 70: Russia Non Woven Fabric Industry Volume (K Tons) Forecast, by Application 2020 & 2033
- Table 71: NORDIC Countries Non Woven Fabric Industry Revenue (Million) Forecast, by Application 2020 & 2033
- Table 72: NORDIC Countries Non Woven Fabric Industry Volume (K Tons) Forecast, by Application 2020 & 2033
- Table 73: Rest of Europe Non Woven Fabric Industry Revenue (Million) Forecast, by Application 2020 & 2033
- Table 74: Rest of Europe Non Woven Fabric Industry Volume (K Tons) Forecast, by Application 2020 & 2033
- Table 75: Global Non Woven Fabric Industry Revenue Million Forecast, by Technology 2020 & 2033
- Table 76: Global Non Woven Fabric Industry Volume K Tons Forecast, by Technology 2020 & 2033
- Table 77: Global Non Woven Fabric Industry Revenue Million Forecast, by Material 2020 & 2033
- Table 78: Global Non Woven Fabric Industry Volume K Tons Forecast, by Material 2020 & 2033
- Table 79: Global Non Woven Fabric Industry Revenue Million Forecast, by End-user Industry 2020 & 2033
- Table 80: Global Non Woven Fabric Industry Volume K Tons Forecast, by End-user Industry 2020 & 2033
- Table 81: Global Non Woven Fabric Industry Revenue Million Forecast, by Country 2020 & 2033
- Table 82: Global Non Woven Fabric Industry Volume K Tons Forecast, by Country 2020 & 2033
- Table 83: Brazil Non Woven Fabric Industry Revenue (Million) Forecast, by Application 2020 & 2033
- Table 84: Brazil Non Woven Fabric Industry Volume (K Tons) Forecast, by Application 2020 & 2033
- Table 85: Argentina Non Woven Fabric Industry Revenue (Million) Forecast, by Application 2020 & 2033
- Table 86: Argentina Non Woven Fabric Industry Volume (K Tons) Forecast, by Application 2020 & 2033
- Table 87: Colombia Non Woven Fabric Industry Revenue (Million) Forecast, by Application 2020 & 2033
- Table 88: Colombia Non Woven Fabric Industry Volume (K Tons) Forecast, by Application 2020 & 2033
- Table 89: Rest of South America Non Woven Fabric Industry Revenue (Million) Forecast, by Application 2020 & 2033
- Table 90: Rest of South America Non Woven Fabric Industry Volume (K Tons) Forecast, by Application 2020 & 2033
- Table 91: Global Non Woven Fabric Industry Revenue Million Forecast, by Technology 2020 & 2033
- Table 92: Global Non Woven Fabric Industry Volume K Tons Forecast, by Technology 2020 & 2033
- Table 93: Global Non Woven Fabric Industry Revenue Million Forecast, by Material 2020 & 2033
- Table 94: Global Non Woven Fabric Industry Volume K Tons Forecast, by Material 2020 & 2033
- Table 95: Global Non Woven Fabric Industry Revenue Million Forecast, by End-user Industry 2020 & 2033
- Table 96: Global Non Woven Fabric Industry Volume K Tons Forecast, by End-user Industry 2020 & 2033
- Table 97: Global Non Woven Fabric Industry Revenue Million Forecast, by Country 2020 & 2033
- Table 98: Global Non Woven Fabric Industry Volume K Tons Forecast, by Country 2020 & 2033
- Table 99: Saudi Arabia Non Woven Fabric Industry Revenue (Million) Forecast, by Application 2020 & 2033
- Table 100: Saudi Arabia Non Woven Fabric Industry Volume (K Tons) Forecast, by Application 2020 & 2033
- Table 101: Nigeria Non Woven Fabric Industry Revenue (Million) Forecast, by Application 2020 & 2033
- Table 102: Nigeria Non Woven Fabric Industry Volume (K Tons) Forecast, by Application 2020 & 2033
- Table 103: Qatar Non Woven Fabric Industry Revenue (Million) Forecast, by Application 2020 & 2033
- Table 104: Qatar Non Woven Fabric Industry Volume (K Tons) Forecast, by Application 2020 & 2033
- Table 105: Egypt Non Woven Fabric Industry Revenue (Million) Forecast, by Application 2020 & 2033
- Table 106: Egypt Non Woven Fabric Industry Volume (K Tons) Forecast, by Application 2020 & 2033
- Table 107: United Arab Emirates Non Woven Fabric Industry Revenue (Million) Forecast, by Application 2020 & 2033
- Table 108: United Arab Emirates Non Woven Fabric Industry Volume (K Tons) Forecast, by Application 2020 & 2033
- Table 109: South Africa Non Woven Fabric Industry Revenue (Million) Forecast, by Application 2020 & 2033
- Table 110: South Africa Non Woven Fabric Industry Volume (K Tons) Forecast, by Application 2020 & 2033
- Table 111: Rest of Middle East and Africa Non Woven Fabric Industry Revenue (Million) Forecast, by Application 2020 & 2033
- Table 112: Rest of Middle East and Africa Non Woven Fabric Industry Volume (K Tons) Forecast, by Application 2020 & 2033
Frequently Asked Questions
1. What is the projected Compound Annual Growth Rate (CAGR) of the Non Woven Fabric Industry?
The projected CAGR is approximately 6.11%.
2. Which companies are prominent players in the Non Woven Fabric Industry?
Key companies in the market include Autotech Nonwovens Pvt Ltd, KCWW (Kimberly-Clark Corporation), Toray Industries Inc, Freudenberg Performance Materials, Cygnus Group, TWE Group*List Not Exhaustive, PFNonwovens Czech SRO, Eximius Incorporation, Glatfelter, DuPont, Ahlstrom-Munksj, Fitesa, Johns Manville, Paramount Tech Fab Industries, Berry Global Inc.
3. What are the main segments of the Non Woven Fabric Industry?
The market segments include Technology, Material, End-user Industry.
4. Can you provide details about the market size?
The market size is estimated to be USD 57.42 Million as of 2022.
5. What are some drivers contributing to market growth?
Increasing Application in the Healthcare Industry; Growing Demand for Electric Vehicles; Other Drivers.
6. What are the notable trends driving market growth?
Increasing Demand from the Healthcare Industry.
7. Are there any restraints impacting market growth?
Low Durability and Strength of Fabric; Other Restraints.
8. Can you provide examples of recent developments in the market?
August 2022: Willacoochee Industrial Fabrics, Inc. (WINFAB), one of the leading manufacturers of geosynthetic and erosion control products in the United States, announced its investment into a new state-of-the-art nonwoven geotextile manufacturing production line in Nashville, GA. The production line was anticipated to begin operation by the second quarter of 2023.
9. What pricing options are available for accessing the report?
Pricing options include single-user, multi-user, and enterprise licenses priced at USD 4750, USD 5250, and USD 8750 respectively.
10. Is the market size provided in terms of value or volume?
The market size is provided in terms of value, measured in Million and volume, measured in K Tons.
11. Are there any specific market keywords associated with the report?
Yes, the market keyword associated with the report is "Non Woven Fabric Industry," which aids in identifying and referencing the specific market segment covered.
12. How do I determine which pricing option suits my needs best?
The pricing options vary based on user requirements and access needs. Individual users may opt for single-user licenses, while businesses requiring broader access may choose multi-user or enterprise licenses for cost-effective access to the report.
13. Are there any additional resources or data provided in the Non Woven Fabric Industry report?
While the report offers comprehensive insights, it's advisable to review the specific contents or supplementary materials provided to ascertain if additional resources or data are available.
14. How can I stay updated on further developments or reports in the Non Woven Fabric Industry?
To stay informed about further developments, trends, and reports in the Non Woven Fabric Industry, consider subscribing to industry newsletters, following relevant companies and organizations, or regularly checking reputable industry news sources and publications.
Methodology
Step 1 - Identification of Relevant Samples Size from Population Database


Step 2 - Approaches for Defining Global Market Size (Value, Volume* & Price*)

Note*: In applicable scenarios
Step 3 - Data Sources
Primary Research
- Web Analytics
- Survey Reports
- Research Institute
- Latest Research Reports
- Opinion Leaders
Secondary Research
- Annual Reports
- White Paper
- Latest Press Release
- Industry Association
- Paid Database
- Investor Presentations

Step 4 - Data Triangulation
Involves using different sources of information in order to increase the validity of a study
These sources are likely to be stakeholders in a program - participants, other researchers, program staff, other community members, and so on.
Then we put all data in single framework & apply various statistical tools to find out the dynamic on the market.
During the analysis stage, feedback from the stakeholder groups would be compared to determine areas of agreement as well as areas of divergence