

Key Insights
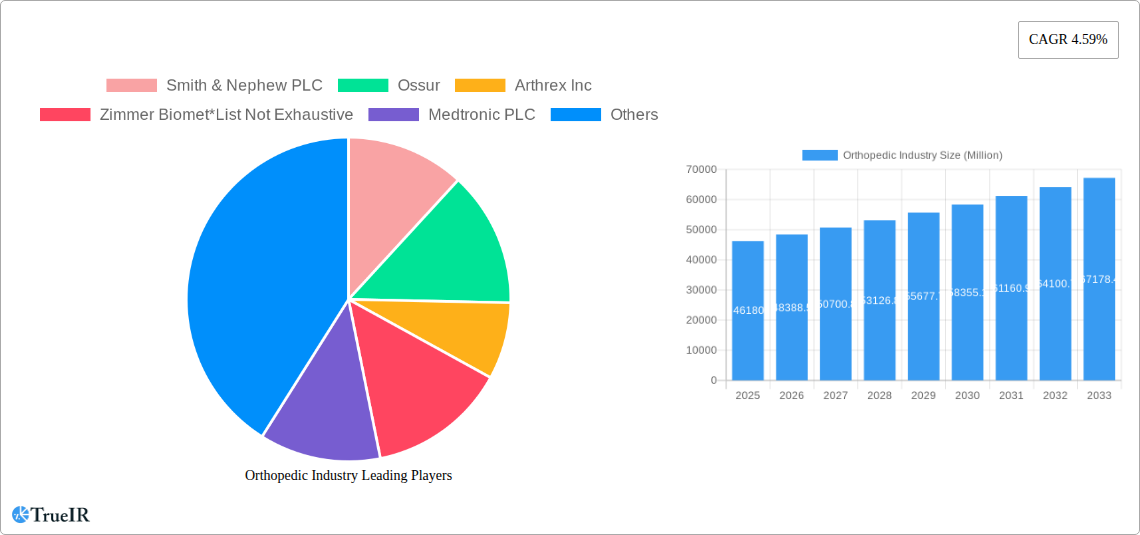
The global orthopedic devices market, valued at $46.18 billion in 2025, is projected to experience robust growth, driven by several key factors. An aging global population, increasing prevalence of osteoarthritis and other musculoskeletal disorders, and rising disposable incomes in developing economies are significantly boosting demand for orthopedic implants and related procedures. Technological advancements, such as minimally invasive surgical techniques and the development of biocompatible materials, are further enhancing market growth. The market is segmented by application, with hip, knee, and spine orthopedic devices representing significant segments, reflecting the high incidence of related conditions. Hip and knee replacements, in particular, are experiencing considerable growth due to increased effectiveness and longer lifespans of these procedures. Trauma fixation devices also contribute substantially to market revenue, driven by increasing road accidents and sports injuries. While the market faces constraints such as high procedure costs and potential complications associated with surgeries, the overall outlook remains positive due to the aforementioned drivers and ongoing research and development in the field. Competitive landscape analysis suggests a mix of large multinational corporations and specialized companies, all vying for market share through innovation and strategic partnerships.
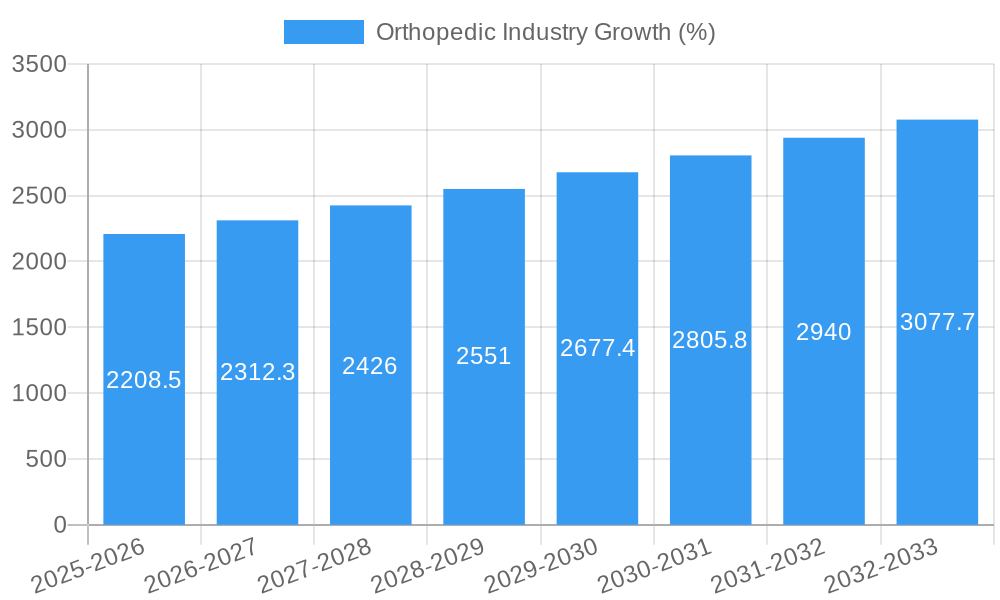
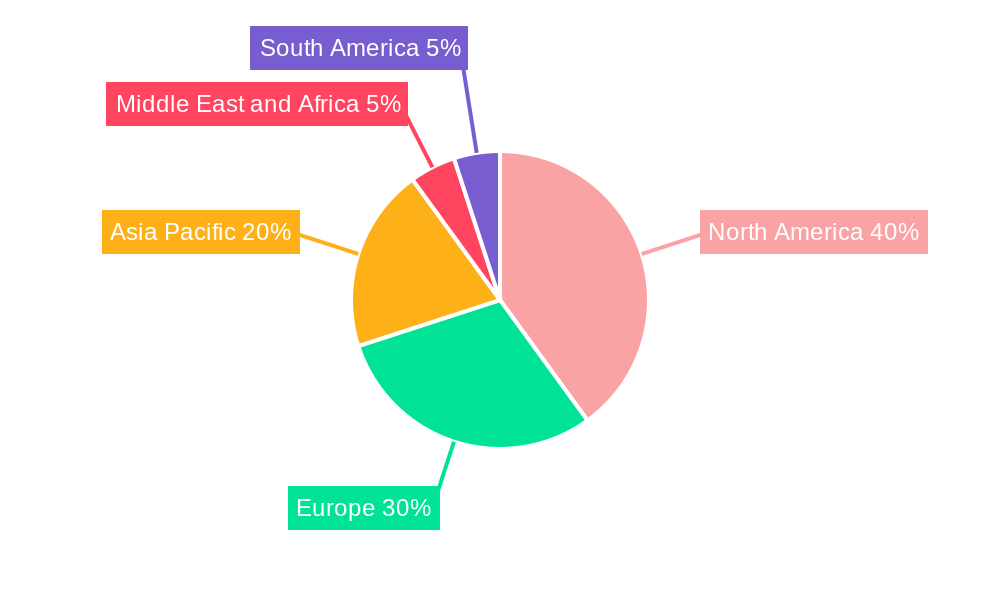
The forecast period of 2025-2033 anticipates a continued expansion of the orthopedic devices market, fueled by a consistent CAGR of 4.59%. This growth will be geographically diverse, with North America and Europe maintaining significant market shares due to established healthcare infrastructure and higher adoption rates. However, rapidly developing economies in Asia Pacific and other regions are expected to witness substantial growth as healthcare access improves and awareness around orthopedic treatments increases. The market will likely see a shift toward value-based healthcare models, influencing the adoption of cost-effective solutions. Furthermore, increasing emphasis on personalized medicine and the integration of digital technologies (e.g., telehealth, AI-driven diagnostics) will reshape the market landscape. This necessitates strategic adaptation from manufacturers to meet evolving patient needs and regulatory requirements.
Orthopedic Industry Market Report: 2019-2033
This comprehensive report provides a detailed analysis of the global orthopedic industry, projecting a market value exceeding $XXX Million by 2033. The report covers the period from 2019 to 2033, with a base year of 2025 and a forecast period from 2025 to 2033. It leverages extensive data from the historical period (2019-2024) to provide actionable insights for industry stakeholders. Key players analyzed include Smith & Nephew PLC, Ossur, Arthrex Inc, Zimmer Biomet, Medtronic PLC, CTL Amedica, Globus Medical, Enovis Corporation, Johnson & Johnson Inc, Stryker Corporation, Boston Scientific Corporation, ATEC Spine Inc, B Braun SE, and NuVasive Inc. (Note: This list is not exhaustive).
Orthopedic Industry Market Structure & Competitive Landscape
The orthopedic industry is characterized by a moderately concentrated market structure, with a few large multinational corporations holding significant market share. However, the presence of numerous smaller, specialized companies, particularly in niche segments like dental orthopedics, contributes to a dynamic competitive landscape. The industry's Herfindahl-Hirschman Index (HHI) is estimated at xx, suggesting a moderately concentrated market. Innovation is a key driver, with companies constantly developing new materials, technologies, and minimally invasive surgical techniques. Regulatory approvals and reimbursement policies significantly impact market entry and product success. The availability of substitute treatments (e.g., physical therapy) and the rising adoption of digital health solutions present ongoing challenges. End-user segmentation includes hospitals, ambulatory surgical centers, and clinics.
- Market Concentration: Moderately concentrated, with a HHI of xx.
- Innovation Drivers: Advancements in biomaterials, minimally invasive surgery, 3D printing, and robotics.
- Regulatory Impacts: Stringent regulatory approvals (e.g., FDA, CE mark) impact market entry and product lifecycle.
- Product Substitutes: Physical therapy, non-surgical treatments, and alternative medical approaches.
- End-User Segmentation: Hospitals, ambulatory surgical centers, and specialized orthopedic clinics.
- M&A Trends: A moderate number of mergers and acquisitions (M&A) occur annually, driven by consolidation and access to new technologies and markets (estimated volume of xx deals annually).
Orthopedic Industry Market Trends & Opportunities
The global orthopedic market is experiencing robust growth, driven by several factors. The aging global population and rising prevalence of musculoskeletal disorders are primary drivers. Technological advancements, such as minimally invasive surgical techniques and improved implant materials, are increasing the demand for advanced orthopedic solutions. The shift towards value-based healthcare is also impacting market dynamics, favoring cost-effective and efficient treatments.
Market size is expected to reach $XXX Million by 2033, exhibiting a Compound Annual Growth Rate (CAGR) of xx% during the forecast period. Market penetration rates for specific products vary significantly, with higher penetration in developed markets and substantial growth potential in emerging economies. This growth is further fueled by increased awareness regarding orthopedic conditions, rising disposable incomes in developing countries, improved healthcare infrastructure, and supportive government initiatives. Competitive dynamics remain intense, with major players focusing on product innovation, strategic partnerships, and expansion into new markets.
Dominant Markets & Segments in Orthopedic Industry
The North American market currently holds the largest share of the global orthopedic market, driven by factors such as advanced healthcare infrastructure, high adoption rates of new technologies, and favorable regulatory environments. However, regions such as Asia-Pacific are poised for rapid growth due to rising healthcare expenditure, aging population, and growing awareness of orthopedic conditions. Within the application segments, knee and hip orthopedic devices dominate the market, accounting for the largest share of revenue.
- Leading Region: North America
- Leading Segment: Knee Orthopedic Devices
Key Growth Drivers (North America):
- Advanced healthcare infrastructure and technological adoption
- High prevalence of musculoskeletal disorders
- Favorable reimbursement policies
- Strong R&D investments
Key Growth Drivers (Asia-Pacific):
- Rising healthcare expenditure
- Rapidly aging population
- Increased healthcare awareness
- Government initiatives to improve healthcare infrastructure
Orthopedic Industry Product Analysis
The orthopedic industry is characterized by continuous product innovation, focusing on improved biocompatibility, enhanced durability, and minimally invasive surgical techniques. Technological advancements such as 3D printing, robotic-assisted surgery, and advanced materials are leading to the development of more effective and personalized orthopedic implants and devices. These innovations offer superior performance, reduced recovery times, and improved patient outcomes, contributing to the market's overall growth. The competitive landscape is defined by the ability to offer innovative, high-quality products that meet the evolving needs of surgeons and patients.
Key Drivers, Barriers & Challenges in Orthopedic Industry
Key Drivers:
- Aging global population leading to increased incidence of musculoskeletal disorders.
- Technological advancements resulting in improved implant designs and surgical techniques.
- Rising healthcare expenditure and increased access to healthcare in developing economies.
Challenges and Restraints:
- High cost of orthopedic procedures and implants can limit accessibility, particularly in low and middle-income countries. (Estimated impact: xx Million patients annually lack access).
- Stringent regulatory requirements and lengthy approval processes.
- Potential for adverse events and implant failures can impact market confidence.
- Intense competition among established players.
Growth Drivers in the Orthopedic Industry Market
The orthopedic industry's growth is fueled by an aging population, technological advancements like minimally invasive surgery and 3D printing, rising healthcare spending globally, and increased awareness of musculoskeletal conditions. Government initiatives promoting healthcare infrastructure also play a significant role, along with the development of new biomaterials enhancing implant longevity and biocompatibility.
Challenges Impacting Orthopedic Industry Growth
Significant challenges include high procedure costs limiting access, particularly in low-income nations; stringent regulatory approvals; and the risk of adverse events and implant failures, potentially hindering market acceptance. The highly competitive landscape also presents ongoing challenges. The supply chain's vulnerability to disruptions, as seen recently, adds further complexity.
Key Players Shaping the Orthopedic Industry Market
- Smith & Nephew PLC
- Ossur
- Arthrex Inc
- Zimmer Biomet
- Medtronic PLC
- CTL Amedica
- Globus Medical
- Enovis Corporation
- Johnson & Johnson Inc
- Stryker Corporation
- Boston Scientific Corporation
- ATEC Spine Inc
- B Braun SE
- NuVasive Inc
Significant Orthopedic Industry Milestones
- October 2023: Enovis acquires Limacorporate S.p.A., expanding its product portfolio and market presence.
- January 2023: Orthofix Medical Inc. launches the Mariner Deformity Pedicle Screw System, improving surgical efficiency.
- March 2022: Exactech, Inc. launches the Equinoxe Humeral Reconstruction Prosthesis in Europe, addressing a significant unmet need.
Future Outlook for Orthopedic Industry Market
The orthopedic industry is poised for continued growth, driven by an aging population, technological innovations, and expanding access to healthcare. Strategic partnerships, product diversification, and expansion into emerging markets will be crucial for success. The increasing focus on value-based care and personalized medicine will further shape market dynamics. The market is expected to witness a robust expansion in the coming years, presenting significant opportunities for established players and new entrants alike.
Orthopedic Industry Segmentation
-
1. Application
- 1.1. Hip Orthopedic Devices
- 1.2. Knee Orthopedic Devices
- 1.3. Spine Orthopedic Devices
- 1.4. Trauma Fixation Devices
- 1.5. Dental Orthopedic Devices
- 1.6. Other Applications
Orthopedic Industry Segmentation By Geography
-
1. North America
- 1.1. United States
- 1.2. Canada
- 1.3. Mexico
-
2. Europe
- 2.1. Germany
- 2.2. United Kingdom
- 2.3. France
- 2.4. Italy
- 2.5. Spain
- 2.6. Rest of Europe
-
3. Asia Pacific
- 3.1. China
- 3.2. Japan
- 3.3. India
- 3.4. Australia
- 3.5. South Korea
- 3.6. Rest of Asia Pacific
-
4. Middle East and Africa
- 4.1. GCC
- 4.2. South Africa
- 4.3. Rest of Middle East and Africa
-
5. South America
- 5.1. Brazil
- 5.2. Argentina
- 5.3. Rest of South America
Orthopedic Industry REPORT HIGHLIGHTS
| Aspects | Details |
|---|---|
| Study Period | 2019-2033 |
| Base Year | 2024 |
| Estimated Year | 2025 |
| Forecast Period | 2025-2033 |
| Historical Period | 2019-2024 |
| Growth Rate | CAGR of 4.59% from 2019-2033 |
| Segmentation |
|
Table of Contents
- 1. Introduction
- 1.1. Research Scope
- 1.2. Market Segmentation
- 1.3. Research Methodology
- 1.4. Definitions and Assumptions
- 2. Executive Summary
- 2.1. Introduction
- 3. Market Dynamics
- 3.1. Introduction
- 3.2. Market Drivers
- 3.2.1 Increasing Number of Large Joint Reconstruction Surgeries; Growing Burden of Orthopedic Disorders
- 3.2.2 Trauma
- 3.2.3 and Accidents Cases; Development of Bioabsorbable and Titanium Implants
- 3.3. Market Restrains
- 3.3.1. Stringent Regulatory Scenario; Poor Reimbursement Scenario and Lack of Skilled Surgeons
- 3.4. Market Trends
- 3.4.1. Spine Orthopedic Devices Segment Holds the Largest Share in the Market
- 4. Market Factor Analysis
- 4.1. Porters Five Forces
- 4.2. Supply/Value Chain
- 4.3. PESTEL analysis
- 4.4. Market Entropy
- 4.5. Patent/Trademark Analysis
- 5. Global Orthopedic Industry Analysis, Insights and Forecast, 2019-2031
- 5.1. Market Analysis, Insights and Forecast - by Application
- 5.1.1. Hip Orthopedic Devices
- 5.1.2. Knee Orthopedic Devices
- 5.1.3. Spine Orthopedic Devices
- 5.1.4. Trauma Fixation Devices
- 5.1.5. Dental Orthopedic Devices
- 5.1.6. Other Applications
- 5.2. Market Analysis, Insights and Forecast - by Region
- 5.2.1. North America
- 5.2.2. Europe
- 5.2.3. Asia Pacific
- 5.2.4. Middle East and Africa
- 5.2.5. South America
- 5.1. Market Analysis, Insights and Forecast - by Application
- 6. North America Orthopedic Industry Analysis, Insights and Forecast, 2019-2031
- 6.1. Market Analysis, Insights and Forecast - by Application
- 6.1.1. Hip Orthopedic Devices
- 6.1.2. Knee Orthopedic Devices
- 6.1.3. Spine Orthopedic Devices
- 6.1.4. Trauma Fixation Devices
- 6.1.5. Dental Orthopedic Devices
- 6.1.6. Other Applications
- 6.1. Market Analysis, Insights and Forecast - by Application
- 7. Europe Orthopedic Industry Analysis, Insights and Forecast, 2019-2031
- 7.1. Market Analysis, Insights and Forecast - by Application
- 7.1.1. Hip Orthopedic Devices
- 7.1.2. Knee Orthopedic Devices
- 7.1.3. Spine Orthopedic Devices
- 7.1.4. Trauma Fixation Devices
- 7.1.5. Dental Orthopedic Devices
- 7.1.6. Other Applications
- 7.1. Market Analysis, Insights and Forecast - by Application
- 8. Asia Pacific Orthopedic Industry Analysis, Insights and Forecast, 2019-2031
- 8.1. Market Analysis, Insights and Forecast - by Application
- 8.1.1. Hip Orthopedic Devices
- 8.1.2. Knee Orthopedic Devices
- 8.1.3. Spine Orthopedic Devices
- 8.1.4. Trauma Fixation Devices
- 8.1.5. Dental Orthopedic Devices
- 8.1.6. Other Applications
- 8.1. Market Analysis, Insights and Forecast - by Application
- 9. Middle East and Africa Orthopedic Industry Analysis, Insights and Forecast, 2019-2031
- 9.1. Market Analysis, Insights and Forecast - by Application
- 9.1.1. Hip Orthopedic Devices
- 9.1.2. Knee Orthopedic Devices
- 9.1.3. Spine Orthopedic Devices
- 9.1.4. Trauma Fixation Devices
- 9.1.5. Dental Orthopedic Devices
- 9.1.6. Other Applications
- 9.1. Market Analysis, Insights and Forecast - by Application
- 10. South America Orthopedic Industry Analysis, Insights and Forecast, 2019-2031
- 10.1. Market Analysis, Insights and Forecast - by Application
- 10.1.1. Hip Orthopedic Devices
- 10.1.2. Knee Orthopedic Devices
- 10.1.3. Spine Orthopedic Devices
- 10.1.4. Trauma Fixation Devices
- 10.1.5. Dental Orthopedic Devices
- 10.1.6. Other Applications
- 10.1. Market Analysis, Insights and Forecast - by Application
- 11. North America Orthopedic Industry Analysis, Insights and Forecast, 2019-2031
- 11.1. Market Analysis, Insights and Forecast - By Country/Sub-region
- 11.1.1 United States
- 11.1.2 Canada
- 11.1.3 Mexico
- 12. Europe Orthopedic Industry Analysis, Insights and Forecast, 2019-2031
- 12.1. Market Analysis, Insights and Forecast - By Country/Sub-region
- 12.1.1 Germany
- 12.1.2 United Kingdom
- 12.1.3 France
- 12.1.4 Italy
- 12.1.5 Spain
- 12.1.6 Rest of Europe
- 13. Asia Pacific Orthopedic Industry Analysis, Insights and Forecast, 2019-2031
- 13.1. Market Analysis, Insights and Forecast - By Country/Sub-region
- 13.1.1 China
- 13.1.2 Japan
- 13.1.3 India
- 13.1.4 Australia
- 13.1.5 South Korea
- 13.1.6 Rest of Asia Pacific
- 14. Middle East and Africa Orthopedic Industry Analysis, Insights and Forecast, 2019-2031
- 14.1. Market Analysis, Insights and Forecast - By Country/Sub-region
- 14.1.1 GCC
- 14.1.2 South Africa
- 14.1.3 Rest of Middle East and Africa
- 15. South America Orthopedic Industry Analysis, Insights and Forecast, 2019-2031
- 15.1. Market Analysis, Insights and Forecast - By Country/Sub-region
- 15.1.1 Brazil
- 15.1.2 Argentina
- 15.1.3 Rest of South America
- 16. Competitive Analysis
- 16.1. Global Market Share Analysis 2024
- 16.2. Company Profiles
- 16.2.1 Smith & Nephew PLC
- 16.2.1.1. Overview
- 16.2.1.2. Products
- 16.2.1.3. SWOT Analysis
- 16.2.1.4. Recent Developments
- 16.2.1.5. Financials (Based on Availability)
- 16.2.2 Ossur
- 16.2.2.1. Overview
- 16.2.2.2. Products
- 16.2.2.3. SWOT Analysis
- 16.2.2.4. Recent Developments
- 16.2.2.5. Financials (Based on Availability)
- 16.2.3 Arthrex Inc
- 16.2.3.1. Overview
- 16.2.3.2. Products
- 16.2.3.3. SWOT Analysis
- 16.2.3.4. Recent Developments
- 16.2.3.5. Financials (Based on Availability)
- 16.2.4 Zimmer Biomet*List Not Exhaustive
- 16.2.4.1. Overview
- 16.2.4.2. Products
- 16.2.4.3. SWOT Analysis
- 16.2.4.4. Recent Developments
- 16.2.4.5. Financials (Based on Availability)
- 16.2.5 Medtronic PLC
- 16.2.5.1. Overview
- 16.2.5.2. Products
- 16.2.5.3. SWOT Analysis
- 16.2.5.4. Recent Developments
- 16.2.5.5. Financials (Based on Availability)
- 16.2.6 CTL Amedica
- 16.2.6.1. Overview
- 16.2.6.2. Products
- 16.2.6.3. SWOT Analysis
- 16.2.6.4. Recent Developments
- 16.2.6.5. Financials (Based on Availability)
- 16.2.7 Globus Medical
- 16.2.7.1. Overview
- 16.2.7.2. Products
- 16.2.7.3. SWOT Analysis
- 16.2.7.4. Recent Developments
- 16.2.7.5. Financials (Based on Availability)
- 16.2.8 Enovis Corporation
- 16.2.8.1. Overview
- 16.2.8.2. Products
- 16.2.8.3. SWOT Analysis
- 16.2.8.4. Recent Developments
- 16.2.8.5. Financials (Based on Availability)
- 16.2.9 Johnson & Johnson Inc
- 16.2.9.1. Overview
- 16.2.9.2. Products
- 16.2.9.3. SWOT Analysis
- 16.2.9.4. Recent Developments
- 16.2.9.5. Financials (Based on Availability)
- 16.2.10 Stryker Corporation
- 16.2.10.1. Overview
- 16.2.10.2. Products
- 16.2.10.3. SWOT Analysis
- 16.2.10.4. Recent Developments
- 16.2.10.5. Financials (Based on Availability)
- 16.2.11 Boston Scientific Corporation
- 16.2.11.1. Overview
- 16.2.11.2. Products
- 16.2.11.3. SWOT Analysis
- 16.2.11.4. Recent Developments
- 16.2.11.5. Financials (Based on Availability)
- 16.2.12 ATEC Spine Inc
- 16.2.12.1. Overview
- 16.2.12.2. Products
- 16.2.12.3. SWOT Analysis
- 16.2.12.4. Recent Developments
- 16.2.12.5. Financials (Based on Availability)
- 16.2.13 B Braun SE
- 16.2.13.1. Overview
- 16.2.13.2. Products
- 16.2.13.3. SWOT Analysis
- 16.2.13.4. Recent Developments
- 16.2.13.5. Financials (Based on Availability)
- 16.2.14 NuVasive Inc
- 16.2.14.1. Overview
- 16.2.14.2. Products
- 16.2.14.3. SWOT Analysis
- 16.2.14.4. Recent Developments
- 16.2.14.5. Financials (Based on Availability)
- 16.2.1 Smith & Nephew PLC
List of Figures
- Figure 1: Global Orthopedic Industry Revenue Breakdown (Million, %) by Region 2024 & 2032
- Figure 2: North America Orthopedic Industry Revenue (Million), by Country 2024 & 2032
- Figure 3: North America Orthopedic Industry Revenue Share (%), by Country 2024 & 2032
- Figure 4: Europe Orthopedic Industry Revenue (Million), by Country 2024 & 2032
- Figure 5: Europe Orthopedic Industry Revenue Share (%), by Country 2024 & 2032
- Figure 6: Asia Pacific Orthopedic Industry Revenue (Million), by Country 2024 & 2032
- Figure 7: Asia Pacific Orthopedic Industry Revenue Share (%), by Country 2024 & 2032
- Figure 8: Middle East and Africa Orthopedic Industry Revenue (Million), by Country 2024 & 2032
- Figure 9: Middle East and Africa Orthopedic Industry Revenue Share (%), by Country 2024 & 2032
- Figure 10: South America Orthopedic Industry Revenue (Million), by Country 2024 & 2032
- Figure 11: South America Orthopedic Industry Revenue Share (%), by Country 2024 & 2032
- Figure 12: North America Orthopedic Industry Revenue (Million), by Application 2024 & 2032
- Figure 13: North America Orthopedic Industry Revenue Share (%), by Application 2024 & 2032
- Figure 14: North America Orthopedic Industry Revenue (Million), by Country 2024 & 2032
- Figure 15: North America Orthopedic Industry Revenue Share (%), by Country 2024 & 2032
- Figure 16: Europe Orthopedic Industry Revenue (Million), by Application 2024 & 2032
- Figure 17: Europe Orthopedic Industry Revenue Share (%), by Application 2024 & 2032
- Figure 18: Europe Orthopedic Industry Revenue (Million), by Country 2024 & 2032
- Figure 19: Europe Orthopedic Industry Revenue Share (%), by Country 2024 & 2032
- Figure 20: Asia Pacific Orthopedic Industry Revenue (Million), by Application 2024 & 2032
- Figure 21: Asia Pacific Orthopedic Industry Revenue Share (%), by Application 2024 & 2032
- Figure 22: Asia Pacific Orthopedic Industry Revenue (Million), by Country 2024 & 2032
- Figure 23: Asia Pacific Orthopedic Industry Revenue Share (%), by Country 2024 & 2032
- Figure 24: Middle East and Africa Orthopedic Industry Revenue (Million), by Application 2024 & 2032
- Figure 25: Middle East and Africa Orthopedic Industry Revenue Share (%), by Application 2024 & 2032
- Figure 26: Middle East and Africa Orthopedic Industry Revenue (Million), by Country 2024 & 2032
- Figure 27: Middle East and Africa Orthopedic Industry Revenue Share (%), by Country 2024 & 2032
- Figure 28: South America Orthopedic Industry Revenue (Million), by Application 2024 & 2032
- Figure 29: South America Orthopedic Industry Revenue Share (%), by Application 2024 & 2032
- Figure 30: South America Orthopedic Industry Revenue (Million), by Country 2024 & 2032
- Figure 31: South America Orthopedic Industry Revenue Share (%), by Country 2024 & 2032
List of Tables
- Table 1: Global Orthopedic Industry Revenue Million Forecast, by Region 2019 & 2032
- Table 2: Global Orthopedic Industry Revenue Million Forecast, by Application 2019 & 2032
- Table 3: Global Orthopedic Industry Revenue Million Forecast, by Region 2019 & 2032
- Table 4: Global Orthopedic Industry Revenue Million Forecast, by Country 2019 & 2032
- Table 5: United States Orthopedic Industry Revenue (Million) Forecast, by Application 2019 & 2032
- Table 6: Canada Orthopedic Industry Revenue (Million) Forecast, by Application 2019 & 2032
- Table 7: Mexico Orthopedic Industry Revenue (Million) Forecast, by Application 2019 & 2032
- Table 8: Global Orthopedic Industry Revenue Million Forecast, by Country 2019 & 2032
- Table 9: Germany Orthopedic Industry Revenue (Million) Forecast, by Application 2019 & 2032
- Table 10: United Kingdom Orthopedic Industry Revenue (Million) Forecast, by Application 2019 & 2032
- Table 11: France Orthopedic Industry Revenue (Million) Forecast, by Application 2019 & 2032
- Table 12: Italy Orthopedic Industry Revenue (Million) Forecast, by Application 2019 & 2032
- Table 13: Spain Orthopedic Industry Revenue (Million) Forecast, by Application 2019 & 2032
- Table 14: Rest of Europe Orthopedic Industry Revenue (Million) Forecast, by Application 2019 & 2032
- Table 15: Global Orthopedic Industry Revenue Million Forecast, by Country 2019 & 2032
- Table 16: China Orthopedic Industry Revenue (Million) Forecast, by Application 2019 & 2032
- Table 17: Japan Orthopedic Industry Revenue (Million) Forecast, by Application 2019 & 2032
- Table 18: India Orthopedic Industry Revenue (Million) Forecast, by Application 2019 & 2032
- Table 19: Australia Orthopedic Industry Revenue (Million) Forecast, by Application 2019 & 2032
- Table 20: South Korea Orthopedic Industry Revenue (Million) Forecast, by Application 2019 & 2032
- Table 21: Rest of Asia Pacific Orthopedic Industry Revenue (Million) Forecast, by Application 2019 & 2032
- Table 22: Global Orthopedic Industry Revenue Million Forecast, by Country 2019 & 2032
- Table 23: GCC Orthopedic Industry Revenue (Million) Forecast, by Application 2019 & 2032
- Table 24: South Africa Orthopedic Industry Revenue (Million) Forecast, by Application 2019 & 2032
- Table 25: Rest of Middle East and Africa Orthopedic Industry Revenue (Million) Forecast, by Application 2019 & 2032
- Table 26: Global Orthopedic Industry Revenue Million Forecast, by Country 2019 & 2032
- Table 27: Brazil Orthopedic Industry Revenue (Million) Forecast, by Application 2019 & 2032
- Table 28: Argentina Orthopedic Industry Revenue (Million) Forecast, by Application 2019 & 2032
- Table 29: Rest of South America Orthopedic Industry Revenue (Million) Forecast, by Application 2019 & 2032
- Table 30: Global Orthopedic Industry Revenue Million Forecast, by Application 2019 & 2032
- Table 31: Global Orthopedic Industry Revenue Million Forecast, by Country 2019 & 2032
- Table 32: United States Orthopedic Industry Revenue (Million) Forecast, by Application 2019 & 2032
- Table 33: Canada Orthopedic Industry Revenue (Million) Forecast, by Application 2019 & 2032
- Table 34: Mexico Orthopedic Industry Revenue (Million) Forecast, by Application 2019 & 2032
- Table 35: Global Orthopedic Industry Revenue Million Forecast, by Application 2019 & 2032
- Table 36: Global Orthopedic Industry Revenue Million Forecast, by Country 2019 & 2032
- Table 37: Germany Orthopedic Industry Revenue (Million) Forecast, by Application 2019 & 2032
- Table 38: United Kingdom Orthopedic Industry Revenue (Million) Forecast, by Application 2019 & 2032
- Table 39: France Orthopedic Industry Revenue (Million) Forecast, by Application 2019 & 2032
- Table 40: Italy Orthopedic Industry Revenue (Million) Forecast, by Application 2019 & 2032
- Table 41: Spain Orthopedic Industry Revenue (Million) Forecast, by Application 2019 & 2032
- Table 42: Rest of Europe Orthopedic Industry Revenue (Million) Forecast, by Application 2019 & 2032
- Table 43: Global Orthopedic Industry Revenue Million Forecast, by Application 2019 & 2032
- Table 44: Global Orthopedic Industry Revenue Million Forecast, by Country 2019 & 2032
- Table 45: China Orthopedic Industry Revenue (Million) Forecast, by Application 2019 & 2032
- Table 46: Japan Orthopedic Industry Revenue (Million) Forecast, by Application 2019 & 2032
- Table 47: India Orthopedic Industry Revenue (Million) Forecast, by Application 2019 & 2032
- Table 48: Australia Orthopedic Industry Revenue (Million) Forecast, by Application 2019 & 2032
- Table 49: South Korea Orthopedic Industry Revenue (Million) Forecast, by Application 2019 & 2032
- Table 50: Rest of Asia Pacific Orthopedic Industry Revenue (Million) Forecast, by Application 2019 & 2032
- Table 51: Global Orthopedic Industry Revenue Million Forecast, by Application 2019 & 2032
- Table 52: Global Orthopedic Industry Revenue Million Forecast, by Country 2019 & 2032
- Table 53: GCC Orthopedic Industry Revenue (Million) Forecast, by Application 2019 & 2032
- Table 54: South Africa Orthopedic Industry Revenue (Million) Forecast, by Application 2019 & 2032
- Table 55: Rest of Middle East and Africa Orthopedic Industry Revenue (Million) Forecast, by Application 2019 & 2032
- Table 56: Global Orthopedic Industry Revenue Million Forecast, by Application 2019 & 2032
- Table 57: Global Orthopedic Industry Revenue Million Forecast, by Country 2019 & 2032
- Table 58: Brazil Orthopedic Industry Revenue (Million) Forecast, by Application 2019 & 2032
- Table 59: Argentina Orthopedic Industry Revenue (Million) Forecast, by Application 2019 & 2032
- Table 60: Rest of South America Orthopedic Industry Revenue (Million) Forecast, by Application 2019 & 2032
Frequently Asked Questions
1. What is the projected Compound Annual Growth Rate (CAGR) of the Orthopedic Industry?
The projected CAGR is approximately 4.59%.
2. Which companies are prominent players in the Orthopedic Industry?
Key companies in the market include Smith & Nephew PLC, Ossur, Arthrex Inc, Zimmer Biomet*List Not Exhaustive, Medtronic PLC, CTL Amedica, Globus Medical, Enovis Corporation, Johnson & Johnson Inc, Stryker Corporation, Boston Scientific Corporation, ATEC Spine Inc, B Braun SE, NuVasive Inc.
3. What are the main segments of the Orthopedic Industry?
The market segments include Application.
4. Can you provide details about the market size?
The market size is estimated to be USD 46.18 Million as of 2022.
5. What are some drivers contributing to market growth?
Increasing Number of Large Joint Reconstruction Surgeries; Growing Burden of Orthopedic Disorders. Trauma. and Accidents Cases; Development of Bioabsorbable and Titanium Implants.
6. What are the notable trends driving market growth?
Spine Orthopedic Devices Segment Holds the Largest Share in the Market.
7. Are there any restraints impacting market growth?
Stringent Regulatory Scenario; Poor Reimbursement Scenario and Lack of Skilled Surgeons.
8. Can you provide examples of recent developments in the market?
In October 2023, Enovis, a United States-based medical technology company focused on orthopedics, acquired Italian orthopedic player Limacorporate S.p.A. This Italian company specializes in manufacturing implants used in shoulder, knee, elbow, and hip surgeries.
9. What pricing options are available for accessing the report?
Pricing options include single-user, multi-user, and enterprise licenses priced at USD 4750, USD 5250, and USD 8750 respectively.
10. Is the market size provided in terms of value or volume?
The market size is provided in terms of value, measured in Million.
11. Are there any specific market keywords associated with the report?
Yes, the market keyword associated with the report is "Orthopedic Industry," which aids in identifying and referencing the specific market segment covered.
12. How do I determine which pricing option suits my needs best?
The pricing options vary based on user requirements and access needs. Individual users may opt for single-user licenses, while businesses requiring broader access may choose multi-user or enterprise licenses for cost-effective access to the report.
13. Are there any additional resources or data provided in the Orthopedic Industry report?
While the report offers comprehensive insights, it's advisable to review the specific contents or supplementary materials provided to ascertain if additional resources or data are available.
14. How can I stay updated on further developments or reports in the Orthopedic Industry?
To stay informed about further developments, trends, and reports in the Orthopedic Industry, consider subscribing to industry newsletters, following relevant companies and organizations, or regularly checking reputable industry news sources and publications.
Methodology
Step 1 - Identification of Relevant Samples Size from Population Database


Step 2 - Approaches for Defining Global Market Size (Value, Volume* & Price*)

Note*: In applicable scenarios
Step 3 - Data Sources
Primary Research
- Web Analytics
- Survey Reports
- Research Institute
- Latest Research Reports
- Opinion Leaders
Secondary Research
- Annual Reports
- White Paper
- Latest Press Release
- Industry Association
- Paid Database
- Investor Presentations

Step 4 - Data Triangulation
Involves using different sources of information in order to increase the validity of a study
These sources are likely to be stakeholders in a program - participants, other researchers, program staff, other community members, and so on.
Then we put all data in single framework & apply various statistical tools to find out the dynamic on the market.
During the analysis stage, feedback from the stakeholder groups would be compared to determine areas of agreement as well as areas of divergence
