

Key Insights
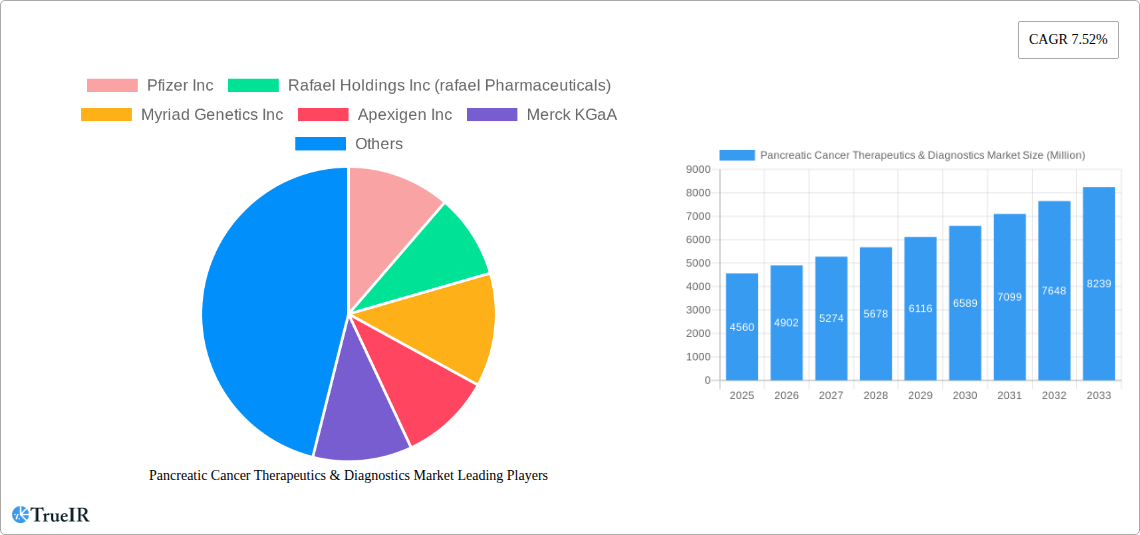
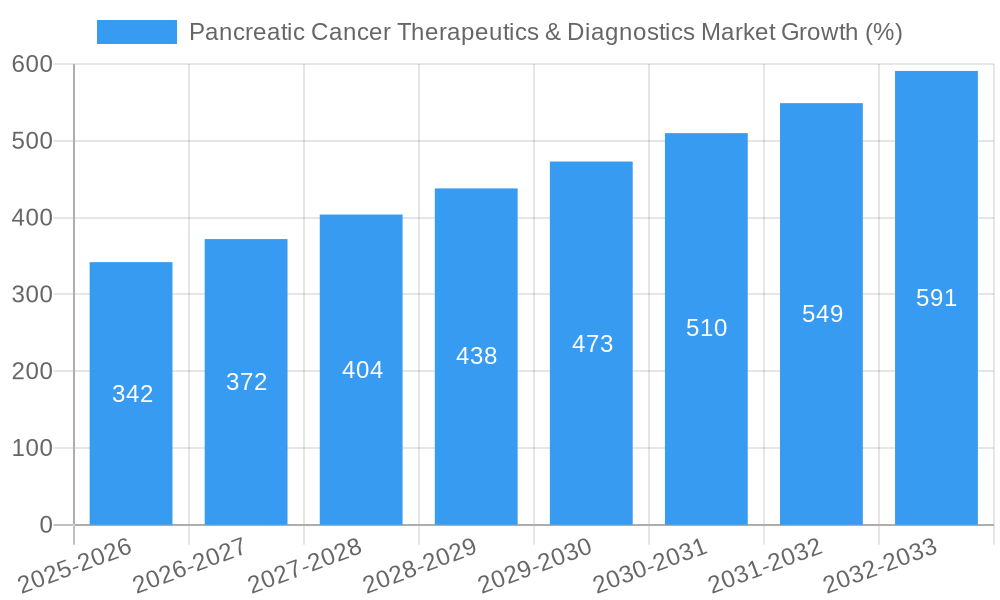
The pancreatic cancer therapeutics and diagnostics market is experiencing robust growth, driven by rising incidence rates of pancreatic cancer globally, increasing awareness about early detection methods, and advancements in targeted therapies and diagnostic technologies. The market size in 2025 is estimated at $4.56 billion, exhibiting a Compound Annual Growth Rate (CAGR) of 7.52% from 2025 to 2033. This growth is fueled by several key factors. Firstly, the development of novel immunotherapies, targeted therapies, and improved chemotherapy regimens is significantly enhancing treatment outcomes and extending patient survival. Secondly, the adoption of advanced diagnostic techniques, such as endoscopic ultrasound (EUS), multidetector computed tomography (MDCT), and circulating tumor DNA (ctDNA) analysis, allows for earlier and more accurate diagnosis, leading to timely intervention and improved treatment efficacy. Furthermore, ongoing research and development efforts focused on personalized medicine and biomarker identification are further contributing to market expansion. While challenges remain, such as the aggressive nature of pancreatic cancer and the limited treatment options in advanced stages, the overall market trajectory indicates a positive outlook with considerable growth potential in the coming years.
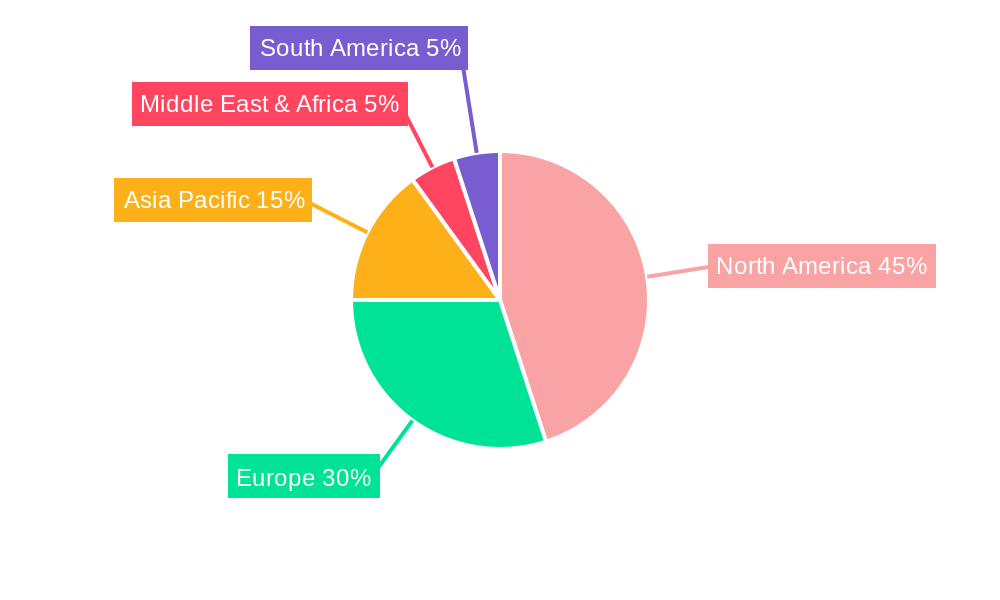
The geographic distribution of the market reflects the prevalence of pancreatic cancer across different regions. North America currently holds a significant market share, owing to advanced healthcare infrastructure, high healthcare expenditure, and a substantial patient population. However, the Asia-Pacific region is projected to witness significant growth during the forecast period, driven by increasing healthcare awareness, rising disposable incomes, and expanding healthcare infrastructure in emerging economies like India and China. Europe also presents a substantial market, with ongoing investments in research and development and the adoption of innovative treatment modalities. Continued market expansion will be shaped by factors including regulatory approvals for new therapies, reimbursement policies, and the accessibility of diagnostic technologies across various geographical regions. The competitive landscape is characterized by a mix of established pharmaceutical companies and emerging biotechnology firms actively engaged in developing and commercializing innovative solutions for pancreatic cancer treatment and diagnostics.
Pancreatic Cancer Therapeutics & Diagnostics Market: A Comprehensive Report (2019-2033)
This dynamic report offers a detailed analysis of the Pancreatic Cancer Therapeutics & Diagnostics Market, providing invaluable insights for stakeholders across the industry. Leveraging extensive research and data covering the period from 2019 to 2033 (base year 2025, forecast period 2025-2033), this report dissects market trends, competitive landscapes, and future projections. The global market size in 2025 is estimated at xx Million, with a projected CAGR of xx% from 2025 to 2033. This report is essential for understanding growth opportunities and navigating the complexities of this rapidly evolving sector.
Pancreatic Cancer Therapeutics & Diagnostics Market Market Structure & Competitive Landscape
The pancreatic cancer therapeutics and diagnostics market exhibits a moderately concentrated structure, with a few major players holding significant market share. The Herfindahl-Hirschman Index (HHI) for 2025 is estimated at xx, indicating a moderately concentrated market. This concentration is driven by substantial investments in R&D, the high cost of drug development and approval, and the complexities of bringing innovative diagnostics to market.
Innovation Drivers: Significant investment in immunotherapy, targeted therapies, and advanced diagnostic technologies are major drivers of market growth. The pursuit of personalized medicine, allowing for tailored treatments based on individual genetic profiles, is also a significant force.
Regulatory Impacts: Stringent regulatory approvals, particularly for novel therapeutics, create barriers to entry, but also ensure safety and efficacy. The FDA’s accelerated approval pathways can however expedite the entry of promising new treatments into the market.
Product Substitutes: While there are no direct substitutes for specific pancreatic cancer treatments, alternatives such as surgery, radiation therapy and supportive care impact the market share of targeted therapies.
End-User Segmentation: The market is segmented based on the end-users, primarily hospitals, cancer centers, diagnostic laboratories and research institutions. Hospitals and cancer centers represent the largest segment.
M&A Trends: The market has witnessed a moderate number of mergers and acquisitions (M&As) in the recent past. The total deal value for M&As from 2019-2024 is estimated to be xx Million. These deals reflect a strategic pursuit of innovative technologies and broader market access.
Pancreatic Cancer Therapeutics & Diagnostics Market Market Trends & Opportunities
The pancreatic cancer therapeutics and diagnostics market is experiencing robust growth, driven by several key trends. The increasing incidence of pancreatic cancer globally, coupled with an aging population, is a primary growth driver. Technological advancements in areas like liquid biopsies, next-generation sequencing, and targeted therapies are significantly enhancing diagnostics and treatment options. Furthermore, the rising adoption of minimally invasive surgical techniques, increasing awareness among patients, and growing healthcare expenditure all contribute to market expansion. The market demonstrates significant opportunities in personalized medicine, where treatment plans are tailored to an individual's genetic makeup, leading to enhanced efficacy and reduced adverse effects. The rising prevalence of advanced-stage pancreatic cancer, along with unmet needs in early detection and effective treatment strategies, fuels demand for innovative solutions. Competitive dynamics are characterized by strong R&D efforts, strategic collaborations, and an ongoing influx of new therapies and diagnostic tools.
Dominant Markets & Segments in Pancreatic Cancer Therapeutics & Diagnostics Market
The North American region holds the largest market share in the pancreatic cancer therapeutics and diagnostics market, driven by factors such as high healthcare expenditure, advanced healthcare infrastructure, and a significant number of research institutions. Within North America, the United States represents the dominant market.
Key Growth Drivers for North America:
- High Healthcare Expenditure: Extensive healthcare spending fuels the adoption of advanced treatments and diagnostics.
- Strong Research and Development Infrastructure: A robust ecosystem of research institutions and pharmaceutical companies drives innovation.
- Favorable Regulatory Environment: The relatively streamlined regulatory process in the US facilitates the launch of new products.
- High Awareness and Early Detection Programs: Increasing awareness campaigns and proactive screening programs contribute to early diagnosis.
Europe is the second largest market, with significant growth potential driven by increasing government initiatives to improve cancer care and rising adoption of advanced diagnostic and therapeutic tools.
By Treatment: Targeted therapy and chemotherapy segments dominate the treatment market.
By Diagnostics: Imaging techniques (CT scans, MRI) and biomarker assays (CA 19-9) currently dominate the diagnostic segment, with rapid growth predicted for newer technologies such as liquid biopsies.
Pancreatic Cancer Therapeutics & Diagnostics Market Product Analysis
Technological advancements have led to the introduction of several innovative therapies and diagnostics, including targeted therapies like Abraxane and Gemcitabine, immunotherapy agents like Pembrolizumab and Nivolumab, and advanced imaging techniques such as endoscopic ultrasound and multi-detector CT scans. These products offer improved efficacy, reduced toxicity, and better diagnostic accuracy. The market is witnessing a shift towards personalized medicine, with products tailored to specific genetic profiles and molecular subtypes of pancreatic cancer, leading to better patient outcomes and an improved market fit.
Key Drivers, Barriers & Challenges in Pancreatic Cancer Therapeutics & Diagnostics Market
Key Drivers:
Technological advancements in therapies and diagnostics, rising incidence of pancreatic cancer, increased healthcare spending, and growing government initiatives are key growth drivers. The development of more effective targeted therapies and immunotherapies, coupled with improvements in early detection technologies, has significantly fueled market expansion.
Challenges:
High cost of treatments and diagnostics, limited treatment options for advanced-stage disease, and stringent regulatory requirements pose major challenges. The high failure rate of clinical trials for pancreatic cancer drugs adds further complexity, and supply chain disruptions can impact the timely delivery of essential medications and diagnostic tools. The complexities associated with the development of new therapies for this aggressive cancer have also contributed to challenges.
Growth Drivers in the Pancreatic Cancer Therapeutics & Diagnostics Market Market
The market is driven by factors such as increasing prevalence of pancreatic cancer globally, technological innovations in treatment and diagnostics, rising healthcare spending, favorable regulatory environments in certain regions, and growing awareness among patients.
Challenges Impacting Pancreatic Cancer Therapeutics & Diagnostics Market Growth
High drug prices, complex regulatory hurdles, reimbursement challenges, the need for improved early detection methods, and the inherent challenges in developing effective treatments for this deadly disease are major restraints on market growth. Supply chain disruptions, particularly during periods of global crisis, may cause shortages and impact the availability of essential therapies and diagnostic tools.
Key Players Shaping the Pancreatic Cancer Therapeutics & Diagnostics Market Market
- Pfizer Inc
- Rafael Holdings Inc (rafael Pharmaceuticals)
- Myriad Genetics Inc
- Apexigen Inc
- Merck KGaA
- Immunovia AB
- Novartis AG
- Amgen Inc
- Viatris Inc
- AstraZeneca PLC
- Canon Inc (canon Medical Systems Corporation)
- FUJIFILM Holdings Corporation
- F Hoffmann-La Roche AG
- Boston Scientific Corporation
- Bristol-Myers Squibb Company
Significant Pancreatic Cancer Therapeutics & Diagnostics Market Industry Milestones
- 2020: FDA approval of a new targeted therapy for pancreatic cancer.
- 2021: Launch of a novel diagnostic biomarker test improving early detection rates.
- 2022: Significant investment in R&D by major pharmaceutical companies focusing on immunotherapy for pancreatic cancer.
- 2023: Major merger between two companies in the pancreatic cancer diagnostics space.
Future Outlook for Pancreatic Cancer Therapeutics & Diagnostics Market Market
The future of the pancreatic cancer therapeutics and diagnostics market is promising, driven by continuous innovation in targeted therapies, immunotherapies, and advanced diagnostics. The increasing focus on personalized medicine, along with the development of more effective combination therapies, holds significant potential for improved patient outcomes. The market is expected to witness a steady increase in the adoption of liquid biopsies and other minimally invasive diagnostic techniques. Strategic collaborations and partnerships between pharmaceutical companies and research institutions will play a crucial role in accelerating the development and commercialization of innovative solutions for pancreatic cancer.
Pancreatic Cancer Therapeutics & Diagnostics Market Segmentation
-
1. Type
- 1.1. Targeted Therapies
- 1.2. Chemotherapy
- 1.3. Surgery
- 1.4. Other Treatments
-
2. Diagnostics
- 2.1. Imaging
- 2.2. Biopsy
- 2.3. Endoscopic Ultrasound
- 2.4. Other Diagnostics
Pancreatic Cancer Therapeutics & Diagnostics Market Segmentation By Geography
-
1. North America
- 1.1. United States
- 1.2. Canada
- 1.3. Mexico
-
2. Europe
- 2.1. United Kingdom
- 2.2. Germany
- 2.3. France
- 2.4. Italy
- 2.5. Spain
- 2.6. Rest of Europe
-
3. Asia Pacific
- 3.1. China
- 3.2. Japan
- 3.3. India
- 3.4. Australia
- 3.5. South Korea
- 3.6. Rest of Asia Pacific
-
4. Middle East and Africa
- 4.1. GCC
- 4.2. South Africa
- 4.3. Rest of Middle East and Africa
-
5. South America
- 5.1. Brazil
- 5.2. Argentina
- 5.3. Rest of South America
Pancreatic Cancer Therapeutics & Diagnostics Market REPORT HIGHLIGHTS
| Aspects | Details |
|---|---|
| Study Period | 2019-2033 |
| Base Year | 2024 |
| Estimated Year | 2025 |
| Forecast Period | 2025-2033 |
| Historical Period | 2019-2024 |
| Growth Rate | CAGR of 7.52% from 2019-2033 |
| Segmentation |
|
Table of Contents
- 1. Introduction
- 1.1. Research Scope
- 1.2. Market Segmentation
- 1.3. Research Methodology
- 1.4. Definitions and Assumptions
- 2. Executive Summary
- 2.1. Introduction
- 3. Market Dynamics
- 3.1. Introduction
- 3.2. Market Drivers
- 3.2.1 Increasing Incidence and Prevalence of Pancreatic Cancer; Advancements in Molecular Biology
- 3.2.2 Development of Drugs
- 3.2.3 and Diagnostic Technology
- 3.3. Market Restrains
- 3.3.1. High Costs Associated with Diagnosis and Treatments; Stringent Regularity Guidelines
- 3.4. Market Trends
- 3.4.1. The Chemotherapy Segment is Expected to Witness a Major Share in the Studied Market Over the Forecast Period
- 4. Market Factor Analysis
- 4.1. Porters Five Forces
- 4.2. Supply/Value Chain
- 4.3. PESTEL analysis
- 4.4. Market Entropy
- 4.5. Patent/Trademark Analysis
- 5. Global Pancreatic Cancer Therapeutics & Diagnostics Market Analysis, Insights and Forecast, 2019-2031
- 5.1. Market Analysis, Insights and Forecast - by Type
- 5.1.1. Targeted Therapies
- 5.1.2. Chemotherapy
- 5.1.3. Surgery
- 5.1.4. Other Treatments
- 5.2. Market Analysis, Insights and Forecast - by Diagnostics
- 5.2.1. Imaging
- 5.2.2. Biopsy
- 5.2.3. Endoscopic Ultrasound
- 5.2.4. Other Diagnostics
- 5.3. Market Analysis, Insights and Forecast - by Region
- 5.3.1. North America
- 5.3.2. Europe
- 5.3.3. Asia Pacific
- 5.3.4. Middle East and Africa
- 5.3.5. South America
- 5.1. Market Analysis, Insights and Forecast - by Type
- 6. North America Pancreatic Cancer Therapeutics & Diagnostics Market Analysis, Insights and Forecast, 2019-2031
- 6.1. Market Analysis, Insights and Forecast - by Type
- 6.1.1. Targeted Therapies
- 6.1.2. Chemotherapy
- 6.1.3. Surgery
- 6.1.4. Other Treatments
- 6.2. Market Analysis, Insights and Forecast - by Diagnostics
- 6.2.1. Imaging
- 6.2.2. Biopsy
- 6.2.3. Endoscopic Ultrasound
- 6.2.4. Other Diagnostics
- 6.1. Market Analysis, Insights and Forecast - by Type
- 7. Europe Pancreatic Cancer Therapeutics & Diagnostics Market Analysis, Insights and Forecast, 2019-2031
- 7.1. Market Analysis, Insights and Forecast - by Type
- 7.1.1. Targeted Therapies
- 7.1.2. Chemotherapy
- 7.1.3. Surgery
- 7.1.4. Other Treatments
- 7.2. Market Analysis, Insights and Forecast - by Diagnostics
- 7.2.1. Imaging
- 7.2.2. Biopsy
- 7.2.3. Endoscopic Ultrasound
- 7.2.4. Other Diagnostics
- 7.1. Market Analysis, Insights and Forecast - by Type
- 8. Asia Pacific Pancreatic Cancer Therapeutics & Diagnostics Market Analysis, Insights and Forecast, 2019-2031
- 8.1. Market Analysis, Insights and Forecast - by Type
- 8.1.1. Targeted Therapies
- 8.1.2. Chemotherapy
- 8.1.3. Surgery
- 8.1.4. Other Treatments
- 8.2. Market Analysis, Insights and Forecast - by Diagnostics
- 8.2.1. Imaging
- 8.2.2. Biopsy
- 8.2.3. Endoscopic Ultrasound
- 8.2.4. Other Diagnostics
- 8.1. Market Analysis, Insights and Forecast - by Type
- 9. Middle East and Africa Pancreatic Cancer Therapeutics & Diagnostics Market Analysis, Insights and Forecast, 2019-2031
- 9.1. Market Analysis, Insights and Forecast - by Type
- 9.1.1. Targeted Therapies
- 9.1.2. Chemotherapy
- 9.1.3. Surgery
- 9.1.4. Other Treatments
- 9.2. Market Analysis, Insights and Forecast - by Diagnostics
- 9.2.1. Imaging
- 9.2.2. Biopsy
- 9.2.3. Endoscopic Ultrasound
- 9.2.4. Other Diagnostics
- 9.1. Market Analysis, Insights and Forecast - by Type
- 10. South America Pancreatic Cancer Therapeutics & Diagnostics Market Analysis, Insights and Forecast, 2019-2031
- 10.1. Market Analysis, Insights and Forecast - by Type
- 10.1.1. Targeted Therapies
- 10.1.2. Chemotherapy
- 10.1.3. Surgery
- 10.1.4. Other Treatments
- 10.2. Market Analysis, Insights and Forecast - by Diagnostics
- 10.2.1. Imaging
- 10.2.2. Biopsy
- 10.2.3. Endoscopic Ultrasound
- 10.2.4. Other Diagnostics
- 10.1. Market Analysis, Insights and Forecast - by Type
- 11. North America Pancreatic Cancer Therapeutics & Diagnostics Market Analysis, Insights and Forecast, 2019-2031
- 11.1. Market Analysis, Insights and Forecast - By Country/Sub-region
- 11.1.1 United States
- 11.1.2 Canada
- 11.1.3 Mexico
- 12. Europe Pancreatic Cancer Therapeutics & Diagnostics Market Analysis, Insights and Forecast, 2019-2031
- 12.1. Market Analysis, Insights and Forecast - By Country/Sub-region
- 12.1.1 United Kingdom
- 12.1.2 Germany
- 12.1.3 France
- 12.1.4 Italy
- 12.1.5 Spain
- 12.1.6 Rest of Europe
- 13. Asia Pacific Pancreatic Cancer Therapeutics & Diagnostics Market Analysis, Insights and Forecast, 2019-2031
- 13.1. Market Analysis, Insights and Forecast - By Country/Sub-region
- 13.1.1 China
- 13.1.2 Japan
- 13.1.3 India
- 13.1.4 Australia
- 13.1.5 South Korea
- 13.1.6 Rest of Asia Pacific
- 14. Middle East and Africa Pancreatic Cancer Therapeutics & Diagnostics Market Analysis, Insights and Forecast, 2019-2031
- 14.1. Market Analysis, Insights and Forecast - By Country/Sub-region
- 14.1.1 GCC
- 14.1.2 South Africa
- 14.1.3 Rest of Middle East and Africa
- 15. South America Pancreatic Cancer Therapeutics & Diagnostics Market Analysis, Insights and Forecast, 2019-2031
- 15.1. Market Analysis, Insights and Forecast - By Country/Sub-region
- 15.1.1 Brazil
- 15.1.2 Argentina
- 15.1.3 Rest of South America
- 16. Competitive Analysis
- 16.1. Global Market Share Analysis 2024
- 16.2. Company Profiles
- 16.2.1 Pfizer Inc
- 16.2.1.1. Overview
- 16.2.1.2. Products
- 16.2.1.3. SWOT Analysis
- 16.2.1.4. Recent Developments
- 16.2.1.5. Financials (Based on Availability)
- 16.2.2 Rafael Holdings Inc (rafael Pharmaceuticals)
- 16.2.2.1. Overview
- 16.2.2.2. Products
- 16.2.2.3. SWOT Analysis
- 16.2.2.4. Recent Developments
- 16.2.2.5. Financials (Based on Availability)
- 16.2.3 Myriad Genetics Inc
- 16.2.3.1. Overview
- 16.2.3.2. Products
- 16.2.3.3. SWOT Analysis
- 16.2.3.4. Recent Developments
- 16.2.3.5. Financials (Based on Availability)
- 16.2.4 Apexigen Inc
- 16.2.4.1. Overview
- 16.2.4.2. Products
- 16.2.4.3. SWOT Analysis
- 16.2.4.4. Recent Developments
- 16.2.4.5. Financials (Based on Availability)
- 16.2.5 Merck KGaA
- 16.2.5.1. Overview
- 16.2.5.2. Products
- 16.2.5.3. SWOT Analysis
- 16.2.5.4. Recent Developments
- 16.2.5.5. Financials (Based on Availability)
- 16.2.6 Immunovia AB
- 16.2.6.1. Overview
- 16.2.6.2. Products
- 16.2.6.3. SWOT Analysis
- 16.2.6.4. Recent Developments
- 16.2.6.5. Financials (Based on Availability)
- 16.2.7 Novartis AG
- 16.2.7.1. Overview
- 16.2.7.2. Products
- 16.2.7.3. SWOT Analysis
- 16.2.7.4. Recent Developments
- 16.2.7.5. Financials (Based on Availability)
- 16.2.8 Amgen Inc
- 16.2.8.1. Overview
- 16.2.8.2. Products
- 16.2.8.3. SWOT Analysis
- 16.2.8.4. Recent Developments
- 16.2.8.5. Financials (Based on Availability)
- 16.2.9 Viatris Inc
- 16.2.9.1. Overview
- 16.2.9.2. Products
- 16.2.9.3. SWOT Analysis
- 16.2.9.4. Recent Developments
- 16.2.9.5. Financials (Based on Availability)
- 16.2.10 AstraZeneca PLC
- 16.2.10.1. Overview
- 16.2.10.2. Products
- 16.2.10.3. SWOT Analysis
- 16.2.10.4. Recent Developments
- 16.2.10.5. Financials (Based on Availability)
- 16.2.11 Canon Inc (canon Medical Systems Corporation)
- 16.2.11.1. Overview
- 16.2.11.2. Products
- 16.2.11.3. SWOT Analysis
- 16.2.11.4. Recent Developments
- 16.2.11.5. Financials (Based on Availability)
- 16.2.12 FUJIFILM Holdings Corporation
- 16.2.12.1. Overview
- 16.2.12.2. Products
- 16.2.12.3. SWOT Analysis
- 16.2.12.4. Recent Developments
- 16.2.12.5. Financials (Based on Availability)
- 16.2.13 F Hoffmann-La Roche AG
- 16.2.13.1. Overview
- 16.2.13.2. Products
- 16.2.13.3. SWOT Analysis
- 16.2.13.4. Recent Developments
- 16.2.13.5. Financials (Based on Availability)
- 16.2.14 Boston Scientific Corporation
- 16.2.14.1. Overview
- 16.2.14.2. Products
- 16.2.14.3. SWOT Analysis
- 16.2.14.4. Recent Developments
- 16.2.14.5. Financials (Based on Availability)
- 16.2.15 Bristol-Myers Squibb Company
- 16.2.15.1. Overview
- 16.2.15.2. Products
- 16.2.15.3. SWOT Analysis
- 16.2.15.4. Recent Developments
- 16.2.15.5. Financials (Based on Availability)
- 16.2.1 Pfizer Inc
List of Figures
- Figure 1: Global Pancreatic Cancer Therapeutics & Diagnostics Market Revenue Breakdown (Million, %) by Region 2024 & 2032
- Figure 2: Global Pancreatic Cancer Therapeutics & Diagnostics Market Volume Breakdown (K Unit, %) by Region 2024 & 2032
- Figure 3: North America Pancreatic Cancer Therapeutics & Diagnostics Market Revenue (Million), by Country 2024 & 2032
- Figure 4: North America Pancreatic Cancer Therapeutics & Diagnostics Market Volume (K Unit), by Country 2024 & 2032
- Figure 5: North America Pancreatic Cancer Therapeutics & Diagnostics Market Revenue Share (%), by Country 2024 & 2032
- Figure 6: North America Pancreatic Cancer Therapeutics & Diagnostics Market Volume Share (%), by Country 2024 & 2032
- Figure 7: Europe Pancreatic Cancer Therapeutics & Diagnostics Market Revenue (Million), by Country 2024 & 2032
- Figure 8: Europe Pancreatic Cancer Therapeutics & Diagnostics Market Volume (K Unit), by Country 2024 & 2032
- Figure 9: Europe Pancreatic Cancer Therapeutics & Diagnostics Market Revenue Share (%), by Country 2024 & 2032
- Figure 10: Europe Pancreatic Cancer Therapeutics & Diagnostics Market Volume Share (%), by Country 2024 & 2032
- Figure 11: Asia Pacific Pancreatic Cancer Therapeutics & Diagnostics Market Revenue (Million), by Country 2024 & 2032
- Figure 12: Asia Pacific Pancreatic Cancer Therapeutics & Diagnostics Market Volume (K Unit), by Country 2024 & 2032
- Figure 13: Asia Pacific Pancreatic Cancer Therapeutics & Diagnostics Market Revenue Share (%), by Country 2024 & 2032
- Figure 14: Asia Pacific Pancreatic Cancer Therapeutics & Diagnostics Market Volume Share (%), by Country 2024 & 2032
- Figure 15: Middle East and Africa Pancreatic Cancer Therapeutics & Diagnostics Market Revenue (Million), by Country 2024 & 2032
- Figure 16: Middle East and Africa Pancreatic Cancer Therapeutics & Diagnostics Market Volume (K Unit), by Country 2024 & 2032
- Figure 17: Middle East and Africa Pancreatic Cancer Therapeutics & Diagnostics Market Revenue Share (%), by Country 2024 & 2032
- Figure 18: Middle East and Africa Pancreatic Cancer Therapeutics & Diagnostics Market Volume Share (%), by Country 2024 & 2032
- Figure 19: South America Pancreatic Cancer Therapeutics & Diagnostics Market Revenue (Million), by Country 2024 & 2032
- Figure 20: South America Pancreatic Cancer Therapeutics & Diagnostics Market Volume (K Unit), by Country 2024 & 2032
- Figure 21: South America Pancreatic Cancer Therapeutics & Diagnostics Market Revenue Share (%), by Country 2024 & 2032
- Figure 22: South America Pancreatic Cancer Therapeutics & Diagnostics Market Volume Share (%), by Country 2024 & 2032
- Figure 23: North America Pancreatic Cancer Therapeutics & Diagnostics Market Revenue (Million), by Type 2024 & 2032
- Figure 24: North America Pancreatic Cancer Therapeutics & Diagnostics Market Volume (K Unit), by Type 2024 & 2032
- Figure 25: North America Pancreatic Cancer Therapeutics & Diagnostics Market Revenue Share (%), by Type 2024 & 2032
- Figure 26: North America Pancreatic Cancer Therapeutics & Diagnostics Market Volume Share (%), by Type 2024 & 2032
- Figure 27: North America Pancreatic Cancer Therapeutics & Diagnostics Market Revenue (Million), by Diagnostics 2024 & 2032
- Figure 28: North America Pancreatic Cancer Therapeutics & Diagnostics Market Volume (K Unit), by Diagnostics 2024 & 2032
- Figure 29: North America Pancreatic Cancer Therapeutics & Diagnostics Market Revenue Share (%), by Diagnostics 2024 & 2032
- Figure 30: North America Pancreatic Cancer Therapeutics & Diagnostics Market Volume Share (%), by Diagnostics 2024 & 2032
- Figure 31: North America Pancreatic Cancer Therapeutics & Diagnostics Market Revenue (Million), by Country 2024 & 2032
- Figure 32: North America Pancreatic Cancer Therapeutics & Diagnostics Market Volume (K Unit), by Country 2024 & 2032
- Figure 33: North America Pancreatic Cancer Therapeutics & Diagnostics Market Revenue Share (%), by Country 2024 & 2032
- Figure 34: North America Pancreatic Cancer Therapeutics & Diagnostics Market Volume Share (%), by Country 2024 & 2032
- Figure 35: Europe Pancreatic Cancer Therapeutics & Diagnostics Market Revenue (Million), by Type 2024 & 2032
- Figure 36: Europe Pancreatic Cancer Therapeutics & Diagnostics Market Volume (K Unit), by Type 2024 & 2032
- Figure 37: Europe Pancreatic Cancer Therapeutics & Diagnostics Market Revenue Share (%), by Type 2024 & 2032
- Figure 38: Europe Pancreatic Cancer Therapeutics & Diagnostics Market Volume Share (%), by Type 2024 & 2032
- Figure 39: Europe Pancreatic Cancer Therapeutics & Diagnostics Market Revenue (Million), by Diagnostics 2024 & 2032
- Figure 40: Europe Pancreatic Cancer Therapeutics & Diagnostics Market Volume (K Unit), by Diagnostics 2024 & 2032
- Figure 41: Europe Pancreatic Cancer Therapeutics & Diagnostics Market Revenue Share (%), by Diagnostics 2024 & 2032
- Figure 42: Europe Pancreatic Cancer Therapeutics & Diagnostics Market Volume Share (%), by Diagnostics 2024 & 2032
- Figure 43: Europe Pancreatic Cancer Therapeutics & Diagnostics Market Revenue (Million), by Country 2024 & 2032
- Figure 44: Europe Pancreatic Cancer Therapeutics & Diagnostics Market Volume (K Unit), by Country 2024 & 2032
- Figure 45: Europe Pancreatic Cancer Therapeutics & Diagnostics Market Revenue Share (%), by Country 2024 & 2032
- Figure 46: Europe Pancreatic Cancer Therapeutics & Diagnostics Market Volume Share (%), by Country 2024 & 2032
- Figure 47: Asia Pacific Pancreatic Cancer Therapeutics & Diagnostics Market Revenue (Million), by Type 2024 & 2032
- Figure 48: Asia Pacific Pancreatic Cancer Therapeutics & Diagnostics Market Volume (K Unit), by Type 2024 & 2032
- Figure 49: Asia Pacific Pancreatic Cancer Therapeutics & Diagnostics Market Revenue Share (%), by Type 2024 & 2032
- Figure 50: Asia Pacific Pancreatic Cancer Therapeutics & Diagnostics Market Volume Share (%), by Type 2024 & 2032
- Figure 51: Asia Pacific Pancreatic Cancer Therapeutics & Diagnostics Market Revenue (Million), by Diagnostics 2024 & 2032
- Figure 52: Asia Pacific Pancreatic Cancer Therapeutics & Diagnostics Market Volume (K Unit), by Diagnostics 2024 & 2032
- Figure 53: Asia Pacific Pancreatic Cancer Therapeutics & Diagnostics Market Revenue Share (%), by Diagnostics 2024 & 2032
- Figure 54: Asia Pacific Pancreatic Cancer Therapeutics & Diagnostics Market Volume Share (%), by Diagnostics 2024 & 2032
- Figure 55: Asia Pacific Pancreatic Cancer Therapeutics & Diagnostics Market Revenue (Million), by Country 2024 & 2032
- Figure 56: Asia Pacific Pancreatic Cancer Therapeutics & Diagnostics Market Volume (K Unit), by Country 2024 & 2032
- Figure 57: Asia Pacific Pancreatic Cancer Therapeutics & Diagnostics Market Revenue Share (%), by Country 2024 & 2032
- Figure 58: Asia Pacific Pancreatic Cancer Therapeutics & Diagnostics Market Volume Share (%), by Country 2024 & 2032
- Figure 59: Middle East and Africa Pancreatic Cancer Therapeutics & Diagnostics Market Revenue (Million), by Type 2024 & 2032
- Figure 60: Middle East and Africa Pancreatic Cancer Therapeutics & Diagnostics Market Volume (K Unit), by Type 2024 & 2032
- Figure 61: Middle East and Africa Pancreatic Cancer Therapeutics & Diagnostics Market Revenue Share (%), by Type 2024 & 2032
- Figure 62: Middle East and Africa Pancreatic Cancer Therapeutics & Diagnostics Market Volume Share (%), by Type 2024 & 2032
- Figure 63: Middle East and Africa Pancreatic Cancer Therapeutics & Diagnostics Market Revenue (Million), by Diagnostics 2024 & 2032
- Figure 64: Middle East and Africa Pancreatic Cancer Therapeutics & Diagnostics Market Volume (K Unit), by Diagnostics 2024 & 2032
- Figure 65: Middle East and Africa Pancreatic Cancer Therapeutics & Diagnostics Market Revenue Share (%), by Diagnostics 2024 & 2032
- Figure 66: Middle East and Africa Pancreatic Cancer Therapeutics & Diagnostics Market Volume Share (%), by Diagnostics 2024 & 2032
- Figure 67: Middle East and Africa Pancreatic Cancer Therapeutics & Diagnostics Market Revenue (Million), by Country 2024 & 2032
- Figure 68: Middle East and Africa Pancreatic Cancer Therapeutics & Diagnostics Market Volume (K Unit), by Country 2024 & 2032
- Figure 69: Middle East and Africa Pancreatic Cancer Therapeutics & Diagnostics Market Revenue Share (%), by Country 2024 & 2032
- Figure 70: Middle East and Africa Pancreatic Cancer Therapeutics & Diagnostics Market Volume Share (%), by Country 2024 & 2032
- Figure 71: South America Pancreatic Cancer Therapeutics & Diagnostics Market Revenue (Million), by Type 2024 & 2032
- Figure 72: South America Pancreatic Cancer Therapeutics & Diagnostics Market Volume (K Unit), by Type 2024 & 2032
- Figure 73: South America Pancreatic Cancer Therapeutics & Diagnostics Market Revenue Share (%), by Type 2024 & 2032
- Figure 74: South America Pancreatic Cancer Therapeutics & Diagnostics Market Volume Share (%), by Type 2024 & 2032
- Figure 75: South America Pancreatic Cancer Therapeutics & Diagnostics Market Revenue (Million), by Diagnostics 2024 & 2032
- Figure 76: South America Pancreatic Cancer Therapeutics & Diagnostics Market Volume (K Unit), by Diagnostics 2024 & 2032
- Figure 77: South America Pancreatic Cancer Therapeutics & Diagnostics Market Revenue Share (%), by Diagnostics 2024 & 2032
- Figure 78: South America Pancreatic Cancer Therapeutics & Diagnostics Market Volume Share (%), by Diagnostics 2024 & 2032
- Figure 79: South America Pancreatic Cancer Therapeutics & Diagnostics Market Revenue (Million), by Country 2024 & 2032
- Figure 80: South America Pancreatic Cancer Therapeutics & Diagnostics Market Volume (K Unit), by Country 2024 & 2032
- Figure 81: South America Pancreatic Cancer Therapeutics & Diagnostics Market Revenue Share (%), by Country 2024 & 2032
- Figure 82: South America Pancreatic Cancer Therapeutics & Diagnostics Market Volume Share (%), by Country 2024 & 2032
List of Tables
- Table 1: Global Pancreatic Cancer Therapeutics & Diagnostics Market Revenue Million Forecast, by Region 2019 & 2032
- Table 2: Global Pancreatic Cancer Therapeutics & Diagnostics Market Volume K Unit Forecast, by Region 2019 & 2032
- Table 3: Global Pancreatic Cancer Therapeutics & Diagnostics Market Revenue Million Forecast, by Type 2019 & 2032
- Table 4: Global Pancreatic Cancer Therapeutics & Diagnostics Market Volume K Unit Forecast, by Type 2019 & 2032
- Table 5: Global Pancreatic Cancer Therapeutics & Diagnostics Market Revenue Million Forecast, by Diagnostics 2019 & 2032
- Table 6: Global Pancreatic Cancer Therapeutics & Diagnostics Market Volume K Unit Forecast, by Diagnostics 2019 & 2032
- Table 7: Global Pancreatic Cancer Therapeutics & Diagnostics Market Revenue Million Forecast, by Region 2019 & 2032
- Table 8: Global Pancreatic Cancer Therapeutics & Diagnostics Market Volume K Unit Forecast, by Region 2019 & 2032
- Table 9: Global Pancreatic Cancer Therapeutics & Diagnostics Market Revenue Million Forecast, by Country 2019 & 2032
- Table 10: Global Pancreatic Cancer Therapeutics & Diagnostics Market Volume K Unit Forecast, by Country 2019 & 2032
- Table 11: United States Pancreatic Cancer Therapeutics & Diagnostics Market Revenue (Million) Forecast, by Application 2019 & 2032
- Table 12: United States Pancreatic Cancer Therapeutics & Diagnostics Market Volume (K Unit) Forecast, by Application 2019 & 2032
- Table 13: Canada Pancreatic Cancer Therapeutics & Diagnostics Market Revenue (Million) Forecast, by Application 2019 & 2032
- Table 14: Canada Pancreatic Cancer Therapeutics & Diagnostics Market Volume (K Unit) Forecast, by Application 2019 & 2032
- Table 15: Mexico Pancreatic Cancer Therapeutics & Diagnostics Market Revenue (Million) Forecast, by Application 2019 & 2032
- Table 16: Mexico Pancreatic Cancer Therapeutics & Diagnostics Market Volume (K Unit) Forecast, by Application 2019 & 2032
- Table 17: Global Pancreatic Cancer Therapeutics & Diagnostics Market Revenue Million Forecast, by Country 2019 & 2032
- Table 18: Global Pancreatic Cancer Therapeutics & Diagnostics Market Volume K Unit Forecast, by Country 2019 & 2032
- Table 19: United Kingdom Pancreatic Cancer Therapeutics & Diagnostics Market Revenue (Million) Forecast, by Application 2019 & 2032
- Table 20: United Kingdom Pancreatic Cancer Therapeutics & Diagnostics Market Volume (K Unit) Forecast, by Application 2019 & 2032
- Table 21: Germany Pancreatic Cancer Therapeutics & Diagnostics Market Revenue (Million) Forecast, by Application 2019 & 2032
- Table 22: Germany Pancreatic Cancer Therapeutics & Diagnostics Market Volume (K Unit) Forecast, by Application 2019 & 2032
- Table 23: France Pancreatic Cancer Therapeutics & Diagnostics Market Revenue (Million) Forecast, by Application 2019 & 2032
- Table 24: France Pancreatic Cancer Therapeutics & Diagnostics Market Volume (K Unit) Forecast, by Application 2019 & 2032
- Table 25: Italy Pancreatic Cancer Therapeutics & Diagnostics Market Revenue (Million) Forecast, by Application 2019 & 2032
- Table 26: Italy Pancreatic Cancer Therapeutics & Diagnostics Market Volume (K Unit) Forecast, by Application 2019 & 2032
- Table 27: Spain Pancreatic Cancer Therapeutics & Diagnostics Market Revenue (Million) Forecast, by Application 2019 & 2032
- Table 28: Spain Pancreatic Cancer Therapeutics & Diagnostics Market Volume (K Unit) Forecast, by Application 2019 & 2032
- Table 29: Rest of Europe Pancreatic Cancer Therapeutics & Diagnostics Market Revenue (Million) Forecast, by Application 2019 & 2032
- Table 30: Rest of Europe Pancreatic Cancer Therapeutics & Diagnostics Market Volume (K Unit) Forecast, by Application 2019 & 2032
- Table 31: Global Pancreatic Cancer Therapeutics & Diagnostics Market Revenue Million Forecast, by Country 2019 & 2032
- Table 32: Global Pancreatic Cancer Therapeutics & Diagnostics Market Volume K Unit Forecast, by Country 2019 & 2032
- Table 33: China Pancreatic Cancer Therapeutics & Diagnostics Market Revenue (Million) Forecast, by Application 2019 & 2032
- Table 34: China Pancreatic Cancer Therapeutics & Diagnostics Market Volume (K Unit) Forecast, by Application 2019 & 2032
- Table 35: Japan Pancreatic Cancer Therapeutics & Diagnostics Market Revenue (Million) Forecast, by Application 2019 & 2032
- Table 36: Japan Pancreatic Cancer Therapeutics & Diagnostics Market Volume (K Unit) Forecast, by Application 2019 & 2032
- Table 37: India Pancreatic Cancer Therapeutics & Diagnostics Market Revenue (Million) Forecast, by Application 2019 & 2032
- Table 38: India Pancreatic Cancer Therapeutics & Diagnostics Market Volume (K Unit) Forecast, by Application 2019 & 2032
- Table 39: Australia Pancreatic Cancer Therapeutics & Diagnostics Market Revenue (Million) Forecast, by Application 2019 & 2032
- Table 40: Australia Pancreatic Cancer Therapeutics & Diagnostics Market Volume (K Unit) Forecast, by Application 2019 & 2032
- Table 41: South Korea Pancreatic Cancer Therapeutics & Diagnostics Market Revenue (Million) Forecast, by Application 2019 & 2032
- Table 42: South Korea Pancreatic Cancer Therapeutics & Diagnostics Market Volume (K Unit) Forecast, by Application 2019 & 2032
- Table 43: Rest of Asia Pacific Pancreatic Cancer Therapeutics & Diagnostics Market Revenue (Million) Forecast, by Application 2019 & 2032
- Table 44: Rest of Asia Pacific Pancreatic Cancer Therapeutics & Diagnostics Market Volume (K Unit) Forecast, by Application 2019 & 2032
- Table 45: Global Pancreatic Cancer Therapeutics & Diagnostics Market Revenue Million Forecast, by Country 2019 & 2032
- Table 46: Global Pancreatic Cancer Therapeutics & Diagnostics Market Volume K Unit Forecast, by Country 2019 & 2032
- Table 47: GCC Pancreatic Cancer Therapeutics & Diagnostics Market Revenue (Million) Forecast, by Application 2019 & 2032
- Table 48: GCC Pancreatic Cancer Therapeutics & Diagnostics Market Volume (K Unit) Forecast, by Application 2019 & 2032
- Table 49: South Africa Pancreatic Cancer Therapeutics & Diagnostics Market Revenue (Million) Forecast, by Application 2019 & 2032
- Table 50: South Africa Pancreatic Cancer Therapeutics & Diagnostics Market Volume (K Unit) Forecast, by Application 2019 & 2032
- Table 51: Rest of Middle East and Africa Pancreatic Cancer Therapeutics & Diagnostics Market Revenue (Million) Forecast, by Application 2019 & 2032
- Table 52: Rest of Middle East and Africa Pancreatic Cancer Therapeutics & Diagnostics Market Volume (K Unit) Forecast, by Application 2019 & 2032
- Table 53: Global Pancreatic Cancer Therapeutics & Diagnostics Market Revenue Million Forecast, by Country 2019 & 2032
- Table 54: Global Pancreatic Cancer Therapeutics & Diagnostics Market Volume K Unit Forecast, by Country 2019 & 2032
- Table 55: Brazil Pancreatic Cancer Therapeutics & Diagnostics Market Revenue (Million) Forecast, by Application 2019 & 2032
- Table 56: Brazil Pancreatic Cancer Therapeutics & Diagnostics Market Volume (K Unit) Forecast, by Application 2019 & 2032
- Table 57: Argentina Pancreatic Cancer Therapeutics & Diagnostics Market Revenue (Million) Forecast, by Application 2019 & 2032
- Table 58: Argentina Pancreatic Cancer Therapeutics & Diagnostics Market Volume (K Unit) Forecast, by Application 2019 & 2032
- Table 59: Rest of South America Pancreatic Cancer Therapeutics & Diagnostics Market Revenue (Million) Forecast, by Application 2019 & 2032
- Table 60: Rest of South America Pancreatic Cancer Therapeutics & Diagnostics Market Volume (K Unit) Forecast, by Application 2019 & 2032
- Table 61: Global Pancreatic Cancer Therapeutics & Diagnostics Market Revenue Million Forecast, by Type 2019 & 2032
- Table 62: Global Pancreatic Cancer Therapeutics & Diagnostics Market Volume K Unit Forecast, by Type 2019 & 2032
- Table 63: Global Pancreatic Cancer Therapeutics & Diagnostics Market Revenue Million Forecast, by Diagnostics 2019 & 2032
- Table 64: Global Pancreatic Cancer Therapeutics & Diagnostics Market Volume K Unit Forecast, by Diagnostics 2019 & 2032
- Table 65: Global Pancreatic Cancer Therapeutics & Diagnostics Market Revenue Million Forecast, by Country 2019 & 2032
- Table 66: Global Pancreatic Cancer Therapeutics & Diagnostics Market Volume K Unit Forecast, by Country 2019 & 2032
- Table 67: United States Pancreatic Cancer Therapeutics & Diagnostics Market Revenue (Million) Forecast, by Application 2019 & 2032
- Table 68: United States Pancreatic Cancer Therapeutics & Diagnostics Market Volume (K Unit) Forecast, by Application 2019 & 2032
- Table 69: Canada Pancreatic Cancer Therapeutics & Diagnostics Market Revenue (Million) Forecast, by Application 2019 & 2032
- Table 70: Canada Pancreatic Cancer Therapeutics & Diagnostics Market Volume (K Unit) Forecast, by Application 2019 & 2032
- Table 71: Mexico Pancreatic Cancer Therapeutics & Diagnostics Market Revenue (Million) Forecast, by Application 2019 & 2032
- Table 72: Mexico Pancreatic Cancer Therapeutics & Diagnostics Market Volume (K Unit) Forecast, by Application 2019 & 2032
- Table 73: Global Pancreatic Cancer Therapeutics & Diagnostics Market Revenue Million Forecast, by Type 2019 & 2032
- Table 74: Global Pancreatic Cancer Therapeutics & Diagnostics Market Volume K Unit Forecast, by Type 2019 & 2032
- Table 75: Global Pancreatic Cancer Therapeutics & Diagnostics Market Revenue Million Forecast, by Diagnostics 2019 & 2032
- Table 76: Global Pancreatic Cancer Therapeutics & Diagnostics Market Volume K Unit Forecast, by Diagnostics 2019 & 2032
- Table 77: Global Pancreatic Cancer Therapeutics & Diagnostics Market Revenue Million Forecast, by Country 2019 & 2032
- Table 78: Global Pancreatic Cancer Therapeutics & Diagnostics Market Volume K Unit Forecast, by Country 2019 & 2032
- Table 79: United Kingdom Pancreatic Cancer Therapeutics & Diagnostics Market Revenue (Million) Forecast, by Application 2019 & 2032
- Table 80: United Kingdom Pancreatic Cancer Therapeutics & Diagnostics Market Volume (K Unit) Forecast, by Application 2019 & 2032
- Table 81: Germany Pancreatic Cancer Therapeutics & Diagnostics Market Revenue (Million) Forecast, by Application 2019 & 2032
- Table 82: Germany Pancreatic Cancer Therapeutics & Diagnostics Market Volume (K Unit) Forecast, by Application 2019 & 2032
- Table 83: France Pancreatic Cancer Therapeutics & Diagnostics Market Revenue (Million) Forecast, by Application 2019 & 2032
- Table 84: France Pancreatic Cancer Therapeutics & Diagnostics Market Volume (K Unit) Forecast, by Application 2019 & 2032
- Table 85: Italy Pancreatic Cancer Therapeutics & Diagnostics Market Revenue (Million) Forecast, by Application 2019 & 2032
- Table 86: Italy Pancreatic Cancer Therapeutics & Diagnostics Market Volume (K Unit) Forecast, by Application 2019 & 2032
- Table 87: Spain Pancreatic Cancer Therapeutics & Diagnostics Market Revenue (Million) Forecast, by Application 2019 & 2032
- Table 88: Spain Pancreatic Cancer Therapeutics & Diagnostics Market Volume (K Unit) Forecast, by Application 2019 & 2032
- Table 89: Rest of Europe Pancreatic Cancer Therapeutics & Diagnostics Market Revenue (Million) Forecast, by Application 2019 & 2032
- Table 90: Rest of Europe Pancreatic Cancer Therapeutics & Diagnostics Market Volume (K Unit) Forecast, by Application 2019 & 2032
- Table 91: Global Pancreatic Cancer Therapeutics & Diagnostics Market Revenue Million Forecast, by Type 2019 & 2032
- Table 92: Global Pancreatic Cancer Therapeutics & Diagnostics Market Volume K Unit Forecast, by Type 2019 & 2032
- Table 93: Global Pancreatic Cancer Therapeutics & Diagnostics Market Revenue Million Forecast, by Diagnostics 2019 & 2032
- Table 94: Global Pancreatic Cancer Therapeutics & Diagnostics Market Volume K Unit Forecast, by Diagnostics 2019 & 2032
- Table 95: Global Pancreatic Cancer Therapeutics & Diagnostics Market Revenue Million Forecast, by Country 2019 & 2032
- Table 96: Global Pancreatic Cancer Therapeutics & Diagnostics Market Volume K Unit Forecast, by Country 2019 & 2032
- Table 97: China Pancreatic Cancer Therapeutics & Diagnostics Market Revenue (Million) Forecast, by Application 2019 & 2032
- Table 98: China Pancreatic Cancer Therapeutics & Diagnostics Market Volume (K Unit) Forecast, by Application 2019 & 2032
- Table 99: Japan Pancreatic Cancer Therapeutics & Diagnostics Market Revenue (Million) Forecast, by Application 2019 & 2032
- Table 100: Japan Pancreatic Cancer Therapeutics & Diagnostics Market Volume (K Unit) Forecast, by Application 2019 & 2032
- Table 101: India Pancreatic Cancer Therapeutics & Diagnostics Market Revenue (Million) Forecast, by Application 2019 & 2032
- Table 102: India Pancreatic Cancer Therapeutics & Diagnostics Market Volume (K Unit) Forecast, by Application 2019 & 2032
- Table 103: Australia Pancreatic Cancer Therapeutics & Diagnostics Market Revenue (Million) Forecast, by Application 2019 & 2032
- Table 104: Australia Pancreatic Cancer Therapeutics & Diagnostics Market Volume (K Unit) Forecast, by Application 2019 & 2032
- Table 105: South Korea Pancreatic Cancer Therapeutics & Diagnostics Market Revenue (Million) Forecast, by Application 2019 & 2032
- Table 106: South Korea Pancreatic Cancer Therapeutics & Diagnostics Market Volume (K Unit) Forecast, by Application 2019 & 2032
- Table 107: Rest of Asia Pacific Pancreatic Cancer Therapeutics & Diagnostics Market Revenue (Million) Forecast, by Application 2019 & 2032
- Table 108: Rest of Asia Pacific Pancreatic Cancer Therapeutics & Diagnostics Market Volume (K Unit) Forecast, by Application 2019 & 2032
- Table 109: Global Pancreatic Cancer Therapeutics & Diagnostics Market Revenue Million Forecast, by Type 2019 & 2032
- Table 110: Global Pancreatic Cancer Therapeutics & Diagnostics Market Volume K Unit Forecast, by Type 2019 & 2032
- Table 111: Global Pancreatic Cancer Therapeutics & Diagnostics Market Revenue Million Forecast, by Diagnostics 2019 & 2032
- Table 112: Global Pancreatic Cancer Therapeutics & Diagnostics Market Volume K Unit Forecast, by Diagnostics 2019 & 2032
- Table 113: Global Pancreatic Cancer Therapeutics & Diagnostics Market Revenue Million Forecast, by Country 2019 & 2032
- Table 114: Global Pancreatic Cancer Therapeutics & Diagnostics Market Volume K Unit Forecast, by Country 2019 & 2032
- Table 115: GCC Pancreatic Cancer Therapeutics & Diagnostics Market Revenue (Million) Forecast, by Application 2019 & 2032
- Table 116: GCC Pancreatic Cancer Therapeutics & Diagnostics Market Volume (K Unit) Forecast, by Application 2019 & 2032
- Table 117: South Africa Pancreatic Cancer Therapeutics & Diagnostics Market Revenue (Million) Forecast, by Application 2019 & 2032
- Table 118: South Africa Pancreatic Cancer Therapeutics & Diagnostics Market Volume (K Unit) Forecast, by Application 2019 & 2032
- Table 119: Rest of Middle East and Africa Pancreatic Cancer Therapeutics & Diagnostics Market Revenue (Million) Forecast, by Application 2019 & 2032
- Table 120: Rest of Middle East and Africa Pancreatic Cancer Therapeutics & Diagnostics Market Volume (K Unit) Forecast, by Application 2019 & 2032
- Table 121: Global Pancreatic Cancer Therapeutics & Diagnostics Market Revenue Million Forecast, by Type 2019 & 2032
- Table 122: Global Pancreatic Cancer Therapeutics & Diagnostics Market Volume K Unit Forecast, by Type 2019 & 2032
- Table 123: Global Pancreatic Cancer Therapeutics & Diagnostics Market Revenue Million Forecast, by Diagnostics 2019 & 2032
- Table 124: Global Pancreatic Cancer Therapeutics & Diagnostics Market Volume K Unit Forecast, by Diagnostics 2019 & 2032
- Table 125: Global Pancreatic Cancer Therapeutics & Diagnostics Market Revenue Million Forecast, by Country 2019 & 2032
- Table 126: Global Pancreatic Cancer Therapeutics & Diagnostics Market Volume K Unit Forecast, by Country 2019 & 2032
- Table 127: Brazil Pancreatic Cancer Therapeutics & Diagnostics Market Revenue (Million) Forecast, by Application 2019 & 2032
- Table 128: Brazil Pancreatic Cancer Therapeutics & Diagnostics Market Volume (K Unit) Forecast, by Application 2019 & 2032
- Table 129: Argentina Pancreatic Cancer Therapeutics & Diagnostics Market Revenue (Million) Forecast, by Application 2019 & 2032
- Table 130: Argentina Pancreatic Cancer Therapeutics & Diagnostics Market Volume (K Unit) Forecast, by Application 2019 & 2032
- Table 131: Rest of South America Pancreatic Cancer Therapeutics & Diagnostics Market Revenue (Million) Forecast, by Application 2019 & 2032
- Table 132: Rest of South America Pancreatic Cancer Therapeutics & Diagnostics Market Volume (K Unit) Forecast, by Application 2019 & 2032
Frequently Asked Questions
1. What is the projected Compound Annual Growth Rate (CAGR) of the Pancreatic Cancer Therapeutics & Diagnostics Market?
The projected CAGR is approximately 7.52%.
2. Which companies are prominent players in the Pancreatic Cancer Therapeutics & Diagnostics Market?
Key companies in the market include Pfizer Inc, Rafael Holdings Inc (rafael Pharmaceuticals), Myriad Genetics Inc, Apexigen Inc, Merck KGaA, Immunovia AB, Novartis AG, Amgen Inc, Viatris Inc, AstraZeneca PLC, Canon Inc (canon Medical Systems Corporation), FUJIFILM Holdings Corporation, F Hoffmann-La Roche AG, Boston Scientific Corporation, Bristol-Myers Squibb Company.
3. What are the main segments of the Pancreatic Cancer Therapeutics & Diagnostics Market?
The market segments include Type, Diagnostics .
4. Can you provide details about the market size?
The market size is estimated to be USD 4.56 Million as of 2022.
5. What are some drivers contributing to market growth?
Increasing Incidence and Prevalence of Pancreatic Cancer; Advancements in Molecular Biology. Development of Drugs. and Diagnostic Technology.
6. What are the notable trends driving market growth?
The Chemotherapy Segment is Expected to Witness a Major Share in the Studied Market Over the Forecast Period.
7. Are there any restraints impacting market growth?
High Costs Associated with Diagnosis and Treatments; Stringent Regularity Guidelines.
8. Can you provide examples of recent developments in the market?
N/A
9. What pricing options are available for accessing the report?
Pricing options include single-user, multi-user, and enterprise licenses priced at USD 4750, USD 5250, and USD 8750 respectively.
10. Is the market size provided in terms of value or volume?
The market size is provided in terms of value, measured in Million and volume, measured in K Unit.
11. Are there any specific market keywords associated with the report?
Yes, the market keyword associated with the report is "Pancreatic Cancer Therapeutics & Diagnostics Market," which aids in identifying and referencing the specific market segment covered.
12. How do I determine which pricing option suits my needs best?
The pricing options vary based on user requirements and access needs. Individual users may opt for single-user licenses, while businesses requiring broader access may choose multi-user or enterprise licenses for cost-effective access to the report.
13. Are there any additional resources or data provided in the Pancreatic Cancer Therapeutics & Diagnostics Market report?
While the report offers comprehensive insights, it's advisable to review the specific contents or supplementary materials provided to ascertain if additional resources or data are available.
14. How can I stay updated on further developments or reports in the Pancreatic Cancer Therapeutics & Diagnostics Market?
To stay informed about further developments, trends, and reports in the Pancreatic Cancer Therapeutics & Diagnostics Market, consider subscribing to industry newsletters, following relevant companies and organizations, or regularly checking reputable industry news sources and publications.
Methodology
Step 1 - Identification of Relevant Samples Size from Population Database


Step 2 - Approaches for Defining Global Market Size (Value, Volume* & Price*)

Note*: In applicable scenarios
Step 3 - Data Sources
Primary Research
- Web Analytics
- Survey Reports
- Research Institute
- Latest Research Reports
- Opinion Leaders
Secondary Research
- Annual Reports
- White Paper
- Latest Press Release
- Industry Association
- Paid Database
- Investor Presentations

Step 4 - Data Triangulation
Involves using different sources of information in order to increase the validity of a study
These sources are likely to be stakeholders in a program - participants, other researchers, program staff, other community members, and so on.
Then we put all data in single framework & apply various statistical tools to find out the dynamic on the market.
During the analysis stage, feedback from the stakeholder groups would be compared to determine areas of agreement as well as areas of divergence
