

Key Insights
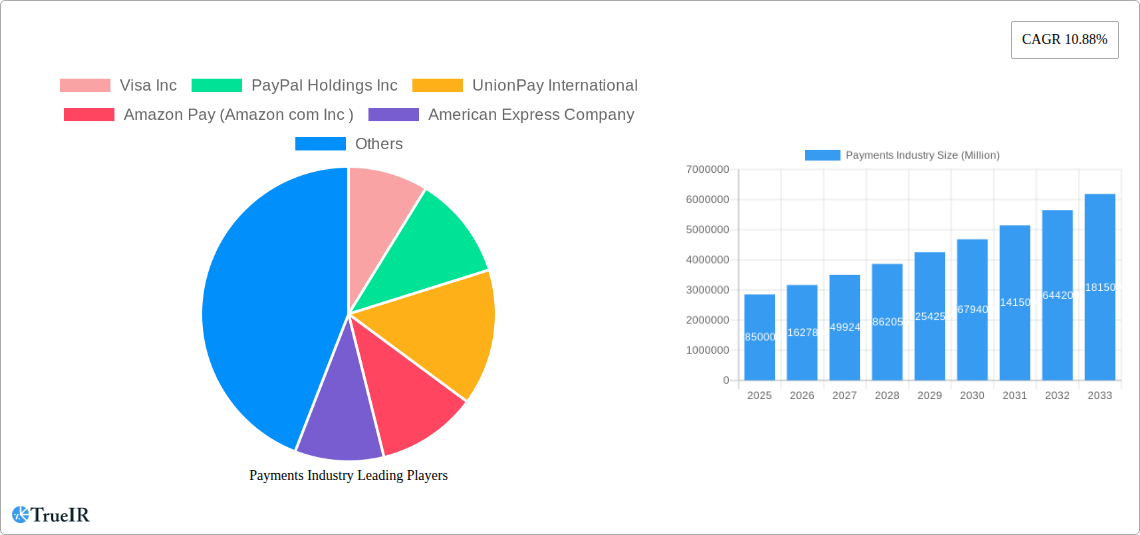
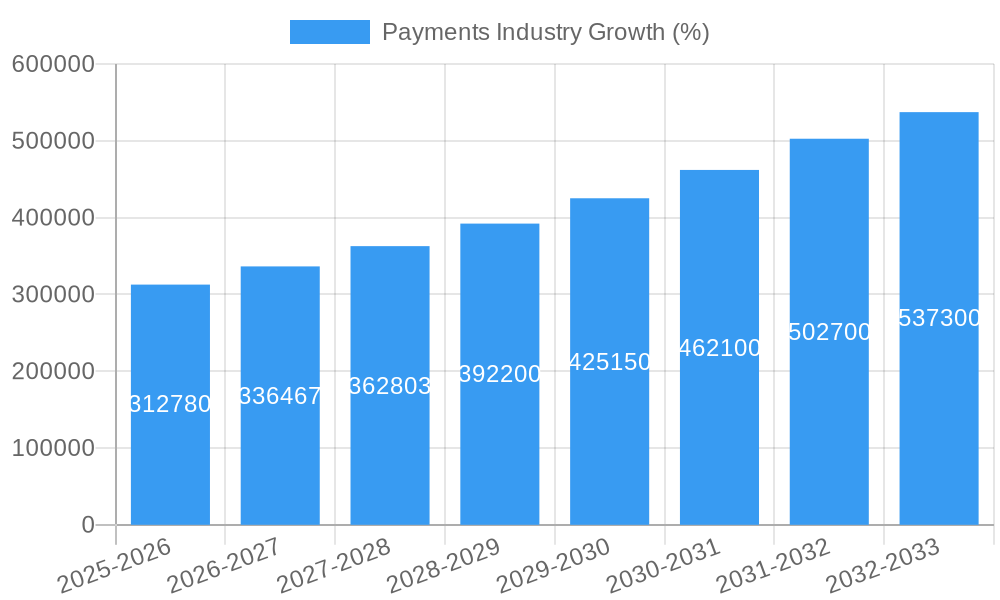
The global payments industry, currently valued at $2.85 trillion in 2025, is experiencing robust growth, projected to expand at a compound annual growth rate (CAGR) of 10.88% from 2025 to 2033. This expansion is driven by several key factors. The increasing adoption of e-commerce and digital transactions fuels demand for convenient and secure online payment solutions. Furthermore, the rise of mobile payments, enabled by smartphones and advancements in mobile technology, significantly contributes to market growth. Innovations like contactless payments, mobile wallets (e.g., Apple Pay, Google Pay), and Buy Now, Pay Later (BNPL) services cater to evolving consumer preferences for speed and flexibility. The expansion into underbanked and unbanked populations globally also presents a significant opportunity for growth. While regulatory changes and cybersecurity concerns present challenges, the overall market outlook remains positive. Key players like Visa, Mastercard, PayPal, and Alipay continue to invest heavily in technological advancements and strategic partnerships to maintain their market leadership. The industry's segmentation by payment mode (point-of-sale, online) and end-user industry (retail, entertainment, healthcare, hospitality) highlights the diverse applications and significant opportunities across various sectors.
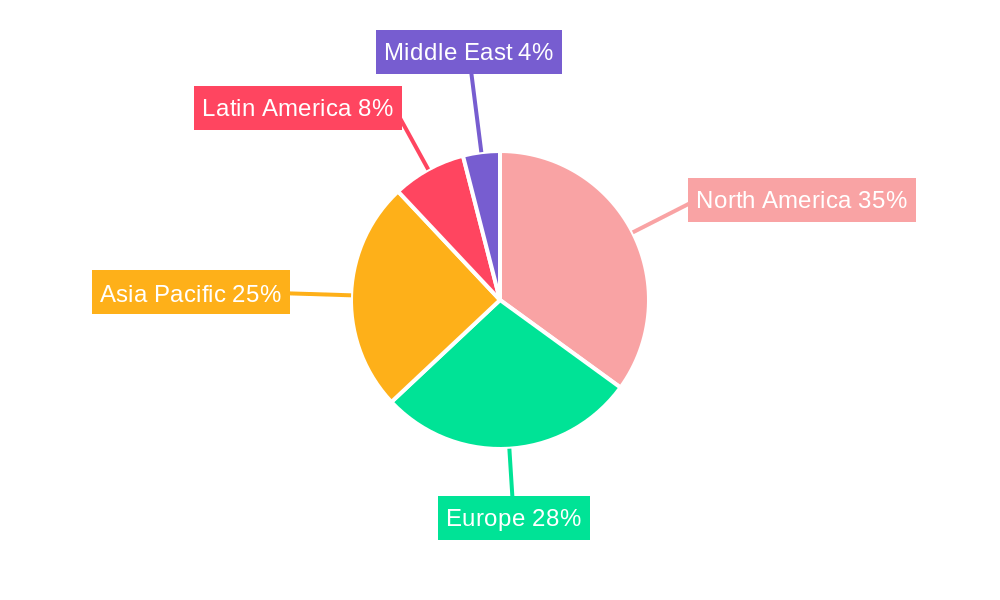
The substantial growth projected for the payments industry will be fueled by consistent technological innovation and the evolving needs of businesses and consumers alike. The increasing integration of payments into diverse platforms and applications, coupled with the broadening adoption of advanced security protocols, are essential elements driving market growth. The geographical distribution of market share is likely to see a dynamic shift, with Asia-Pacific potentially exhibiting the most significant growth due to rapid digitalization and increasing smartphone penetration. However, North America and Europe are also expected to maintain substantial market shares due to established payment infrastructures and high levels of digital adoption. Competitive dynamics within the industry are expected to remain intense, with existing players and new entrants vying for market share through product differentiation, strategic alliances, and mergers and acquisitions.
Payments Industry Market Report: 2019-2033
This comprehensive report provides a detailed analysis of the global payments industry, encompassing market structure, competitive dynamics, key trends, and future outlook. With a study period spanning 2019-2033, a base year of 2025, and a forecast period of 2025-2033, this report offers invaluable insights for businesses, investors, and stakeholders seeking to navigate this rapidly evolving landscape. The report leverages extensive data analysis covering billions of transactions, providing a granular perspective on a market expected to reach xx Million by 2033.
Payments Industry Market Structure & Competitive Landscape
The global payments industry exhibits a highly competitive landscape dominated by a few major players, while also fostering a vibrant ecosystem of smaller, specialized firms. Market concentration, measured by the Herfindahl-Hirschman Index (HHI), is estimated at xx in 2025, indicating a moderately concentrated market. However, this concentration is dynamic, shaped by continuous innovation, mergers and acquisitions (M&A) activity, and evolving regulatory frameworks.
- Market Concentration: The HHI is expected to increase slightly by xx points by 2033 due to ongoing consolidation.
- Innovation Drivers: The industry is characterized by rapid technological advancements, particularly in mobile payments, digital wallets, and blockchain technology, driving innovation and competition.
- Regulatory Impacts: Varying regulatory environments across different jurisdictions significantly impact market access, compliance costs, and competitive dynamics. For instance, the PSD2 directive in Europe has significantly altered the competitive landscape.
- Product Substitutes: The emergence of new payment methods such as Buy Now, Pay Later (BNPL) services presents both opportunities and threats to traditional payment providers.
- End-User Segmentation: The market is segmented by end-user industry (Retail, Entertainment, Healthcare, Hospitality, Others) and mode of payment (Point of Sale, Online Sale, Others), each with unique growth trajectories and challenges.
- M&A Trends: The payments industry has witnessed significant M&A activity in recent years, with a total transaction value exceeding xx Million in the period 2019-2024. These deals reflect strategic efforts to expand market reach, enhance technological capabilities, and gain competitive advantage.
Payments Industry Market Trends & Opportunities
The global payments market is experiencing robust growth, driven by factors such as the rising adoption of digital payments, increasing e-commerce penetration, and expanding financial inclusion. The market is projected to reach xx Million by 2033, exhibiting a Compound Annual Growth Rate (CAGR) of xx% during the forecast period (2025-2033). Market penetration of digital payment methods is also rapidly increasing, with estimates of xx% penetration in key markets by 2033. Technological shifts, particularly the proliferation of mobile payments and the rise of embedded finance, are fundamentally reshaping the industry. Consumer preferences are increasingly shifting towards convenient, secure, and personalized payment solutions. Competitive dynamics remain intense, with established players facing challenges from fintech disruptors and new entrants. The market presents significant opportunities for companies that can effectively leverage technological advancements, cater to evolving consumer needs, and navigate the complexities of the regulatory landscape.
Dominant Markets & Segments in Payments Industry
The retail segment, driven by e-commerce growth and the expanding adoption of digital payment methods, accounts for a significant share of the payments market. Geographically, North America and Asia-Pacific are the leading regions, fueled by factors like robust digital infrastructure, high internet penetration, and supportive government policies.
- By Mode of Payment: Online sales are experiencing faster growth compared to point-of-sale transactions. This is attributable to the expansion of e-commerce and the growing preference for online shopping.
- By End-user Industry:
- Retail: Strong growth is driven by the rise of e-commerce and omnichannel strategies.
- Entertainment: Growth is fueled by digital content consumption and online ticketing platforms.
- Healthcare: Increasing adoption of digital payments for healthcare services contributes to market expansion.
- Hospitality: Contactless payments and online booking systems are boosting growth in this segment.
- Key Growth Drivers:
- Robust Digital Infrastructure: Advanced digital infrastructure facilitates seamless digital transactions.
- Government Policies: Supportive government policies promoting digital payments and financial inclusion drive market growth.
- Increased Smartphone Penetration: Higher smartphone usage fuels the growth of mobile payment solutions.
Payments Industry Product Analysis
The payments industry is witnessing a surge in product innovation, driven by technological advancements and the evolving needs of consumers and businesses. New products and services, such as mobile payment wallets, Buy Now, Pay Later (BNPL) options, and embedded finance solutions, offer enhanced convenience, security, and personalization. These innovations are improving the overall user experience and expanding the reach of payment services to previously underserved segments. Competitive advantages are built on factors such as user experience, security features, transaction speed, and cost-effectiveness. The successful integration of these innovations into existing workflows and seamless interoperability across different systems are crucial for market success.
Key Drivers, Barriers & Challenges in Payments Industry
Key Drivers: Technological advancements (e.g., mobile payments, blockchain), expanding e-commerce, government initiatives to promote financial inclusion, and increasing demand for contactless payments are key drivers of market growth.
Challenges: Regulatory hurdles (e.g., data privacy regulations, KYC/AML compliance), security concerns (e.g., fraud, data breaches), intense competition from fintech startups, and managing fluctuating transaction fees pose significant challenges. For example, increased regulatory scrutiny in areas like data privacy could significantly increase compliance costs, impacting profitability.
Growth Drivers in the Payments Industry Market
Technological innovation (e.g., AI-powered fraud detection), increasing smartphone penetration, the rise of e-commerce, and supportive government policies are key drivers. The expansion of contactless payments, driven by the COVID-19 pandemic, further accelerated market growth.
Challenges Impacting Payments Industry Growth
Stringent regulatory compliance, security threats (fraud, cyberattacks), and the increasing costs of maintaining robust security systems significantly impact growth. Supply chain disruptions in semiconductor manufacturing can impact the availability of payment processing hardware.
Key Players Shaping the Payments Industry Market
- Visa Inc
- PayPal Holdings Inc
- UnionPay International
- Amazon Pay (Amazon com Inc)
- American Express Company
- Mastercard Inc
- AliPay (Alibaba Group)
- Apple Pay (Apple Inc)
- Adyen
- Google Pay (Google LLC)
Significant Payments Industry Industry Milestones
- October 2023: Square Capital LLC launched Tap to Pay on iPhone in Australia, enabling contactless payments directly through iPhones.
- July 2023: Grow Finance partnered with Pismo to issue Mastercard credit cards for small businesses in Australia, improving cash flow management.
- April 2023: Stripe launched unified commerce solutions for Australia, enabling businesses to accept in-person and online payments via a single integration.
Future Outlook for Payments Industry Market
The payments industry is poised for continued growth, driven by technological advancements, expanding digital adoption, and increasing e-commerce penetration. Strategic partnerships, innovative product offerings, and expansion into new markets will be crucial for success. The market presents immense potential for companies that can successfully navigate the challenges and capitalize on emerging opportunities.
Payments Industry Segmentation
-
1. Mode of Payment
-
1.1. Point of Sale
- 1.1.1. Card Pay
- 1.1.2. Digital Wallet (includes Mobile Wallets)
- 1.1.3. Cash
- 1.1.4. Other Points of Sale
-
1.2. Online Sale
- 1.2.1. Other On
-
1.1. Point of Sale
-
2. End-user Industry
- 2.1. Retail
- 2.2. Entertainment
- 2.3. Healthcare
- 2.4. Hospitality
- 2.5. Other End-user Industries
Payments Industry Segmentation By Geography
- 1. North America
- 2. Europe
- 3. Asia Pacific
- 4. Latin America
- 5. Middle East
Payments Industry REPORT HIGHLIGHTS
| Aspects | Details |
|---|---|
| Study Period | 2019-2033 |
| Base Year | 2024 |
| Estimated Year | 2025 |
| Forecast Period | 2025-2033 |
| Historical Period | 2019-2024 |
| Growth Rate | CAGR of 10.88% from 2019-2033 |
| Segmentation |
|
Table of Contents
- 1. Introduction
- 1.1. Research Scope
- 1.2. Market Segmentation
- 1.3. Research Methodology
- 1.4. Definitions and Assumptions
- 2. Executive Summary
- 2.1. Introduction
- 3. Market Dynamics
- 3.1. Introduction
- 3.2. Market Drivers
- 3.2.1. E-commerce Supported by the Rise of M-commerce is Expected to Drive the Market; Enablement Programs by Key Retailers and Government Encouraging Digitization of the Market; Growth of Real-time Payments in Various Countries
- 3.3. Market Restrains
- 3.3.1. High Implementation and Maintenance Cost
- 3.4. Market Trends
- 3.4.1. The Payments have been Sharing wide Traction Owing to Rising Retail Sector
- 4. Market Factor Analysis
- 4.1. Porters Five Forces
- 4.2. Supply/Value Chain
- 4.3. PESTEL analysis
- 4.4. Market Entropy
- 4.5. Patent/Trademark Analysis
- 5. Global Payments Industry Analysis, Insights and Forecast, 2019-2031
- 5.1. Market Analysis, Insights and Forecast - by Mode of Payment
- 5.1.1. Point of Sale
- 5.1.1.1. Card Pay
- 5.1.1.2. Digital Wallet (includes Mobile Wallets)
- 5.1.1.3. Cash
- 5.1.1.4. Other Points of Sale
- 5.1.2. Online Sale
- 5.1.2.1. Other On
- 5.1.1. Point of Sale
- 5.2. Market Analysis, Insights and Forecast - by End-user Industry
- 5.2.1. Retail
- 5.2.2. Entertainment
- 5.2.3. Healthcare
- 5.2.4. Hospitality
- 5.2.5. Other End-user Industries
- 5.3. Market Analysis, Insights and Forecast - by Region
- 5.3.1. North America
- 5.3.2. Europe
- 5.3.3. Asia Pacific
- 5.3.4. Latin America
- 5.3.5. Middle East
- 5.1. Market Analysis, Insights and Forecast - by Mode of Payment
- 6. North America Payments Industry Analysis, Insights and Forecast, 2019-2031
- 6.1. Market Analysis, Insights and Forecast - by Mode of Payment
- 6.1.1. Point of Sale
- 6.1.1.1. Card Pay
- 6.1.1.2. Digital Wallet (includes Mobile Wallets)
- 6.1.1.3. Cash
- 6.1.1.4. Other Points of Sale
- 6.1.2. Online Sale
- 6.1.2.1. Other On
- 6.1.1. Point of Sale
- 6.2. Market Analysis, Insights and Forecast - by End-user Industry
- 6.2.1. Retail
- 6.2.2. Entertainment
- 6.2.3. Healthcare
- 6.2.4. Hospitality
- 6.2.5. Other End-user Industries
- 6.1. Market Analysis, Insights and Forecast - by Mode of Payment
- 7. Europe Payments Industry Analysis, Insights and Forecast, 2019-2031
- 7.1. Market Analysis, Insights and Forecast - by Mode of Payment
- 7.1.1. Point of Sale
- 7.1.1.1. Card Pay
- 7.1.1.2. Digital Wallet (includes Mobile Wallets)
- 7.1.1.3. Cash
- 7.1.1.4. Other Points of Sale
- 7.1.2. Online Sale
- 7.1.2.1. Other On
- 7.1.1. Point of Sale
- 7.2. Market Analysis, Insights and Forecast - by End-user Industry
- 7.2.1. Retail
- 7.2.2. Entertainment
- 7.2.3. Healthcare
- 7.2.4. Hospitality
- 7.2.5. Other End-user Industries
- 7.1. Market Analysis, Insights and Forecast - by Mode of Payment
- 8. Asia Pacific Payments Industry Analysis, Insights and Forecast, 2019-2031
- 8.1. Market Analysis, Insights and Forecast - by Mode of Payment
- 8.1.1. Point of Sale
- 8.1.1.1. Card Pay
- 8.1.1.2. Digital Wallet (includes Mobile Wallets)
- 8.1.1.3. Cash
- 8.1.1.4. Other Points of Sale
- 8.1.2. Online Sale
- 8.1.2.1. Other On
- 8.1.1. Point of Sale
- 8.2. Market Analysis, Insights and Forecast - by End-user Industry
- 8.2.1. Retail
- 8.2.2. Entertainment
- 8.2.3. Healthcare
- 8.2.4. Hospitality
- 8.2.5. Other End-user Industries
- 8.1. Market Analysis, Insights and Forecast - by Mode of Payment
- 9. Latin America Payments Industry Analysis, Insights and Forecast, 2019-2031
- 9.1. Market Analysis, Insights and Forecast - by Mode of Payment
- 9.1.1. Point of Sale
- 9.1.1.1. Card Pay
- 9.1.1.2. Digital Wallet (includes Mobile Wallets)
- 9.1.1.3. Cash
- 9.1.1.4. Other Points of Sale
- 9.1.2. Online Sale
- 9.1.2.1. Other On
- 9.1.1. Point of Sale
- 9.2. Market Analysis, Insights and Forecast - by End-user Industry
- 9.2.1. Retail
- 9.2.2. Entertainment
- 9.2.3. Healthcare
- 9.2.4. Hospitality
- 9.2.5. Other End-user Industries
- 9.1. Market Analysis, Insights and Forecast - by Mode of Payment
- 10. Middle East Payments Industry Analysis, Insights and Forecast, 2019-2031
- 10.1. Market Analysis, Insights and Forecast - by Mode of Payment
- 10.1.1. Point of Sale
- 10.1.1.1. Card Pay
- 10.1.1.2. Digital Wallet (includes Mobile Wallets)
- 10.1.1.3. Cash
- 10.1.1.4. Other Points of Sale
- 10.1.2. Online Sale
- 10.1.2.1. Other On
- 10.1.1. Point of Sale
- 10.2. Market Analysis, Insights and Forecast - by End-user Industry
- 10.2.1. Retail
- 10.2.2. Entertainment
- 10.2.3. Healthcare
- 10.2.4. Hospitality
- 10.2.5. Other End-user Industries
- 10.1. Market Analysis, Insights and Forecast - by Mode of Payment
- 11. North America Payments Industry Analysis, Insights and Forecast, 2019-2031
- 11.1. Market Analysis, Insights and Forecast - By Country/Sub-region
- 11.1.1.
- 12. Europe Payments Industry Analysis, Insights and Forecast, 2019-2031
- 12.1. Market Analysis, Insights and Forecast - By Country/Sub-region
- 12.1.1.
- 13. Asia Pacific Payments Industry Analysis, Insights and Forecast, 2019-2031
- 13.1. Market Analysis, Insights and Forecast - By Country/Sub-region
- 13.1.1.
- 14. Latin America Payments Industry Analysis, Insights and Forecast, 2019-2031
- 14.1. Market Analysis, Insights and Forecast - By Country/Sub-region
- 14.1.1.
- 15. Middle East Payments Industry Analysis, Insights and Forecast, 2019-2031
- 15.1. Market Analysis, Insights and Forecast - By Country/Sub-region
- 15.1.1.
- 16. Competitive Analysis
- 16.1. Global Market Share Analysis 2024
- 16.2. Company Profiles
- 16.2.1 Visa Inc
- 16.2.1.1. Overview
- 16.2.1.2. Products
- 16.2.1.3. SWOT Analysis
- 16.2.1.4. Recent Developments
- 16.2.1.5. Financials (Based on Availability)
- 16.2.2 PayPal Holdings Inc
- 16.2.2.1. Overview
- 16.2.2.2. Products
- 16.2.2.3. SWOT Analysis
- 16.2.2.4. Recent Developments
- 16.2.2.5. Financials (Based on Availability)
- 16.2.3 UnionPay International
- 16.2.3.1. Overview
- 16.2.3.2. Products
- 16.2.3.3. SWOT Analysis
- 16.2.3.4. Recent Developments
- 16.2.3.5. Financials (Based on Availability)
- 16.2.4 Amazon Pay (Amazon com Inc )
- 16.2.4.1. Overview
- 16.2.4.2. Products
- 16.2.4.3. SWOT Analysis
- 16.2.4.4. Recent Developments
- 16.2.4.5. Financials (Based on Availability)
- 16.2.5 American Express Company
- 16.2.5.1. Overview
- 16.2.5.2. Products
- 16.2.5.3. SWOT Analysis
- 16.2.5.4. Recent Developments
- 16.2.5.5. Financials (Based on Availability)
- 16.2.6 Mastercard Inc
- 16.2.6.1. Overview
- 16.2.6.2. Products
- 16.2.6.3. SWOT Analysis
- 16.2.6.4. Recent Developments
- 16.2.6.5. Financials (Based on Availability)
- 16.2.7 AliPay (Alibaba Group)
- 16.2.7.1. Overview
- 16.2.7.2. Products
- 16.2.7.3. SWOT Analysis
- 16.2.7.4. Recent Developments
- 16.2.7.5. Financials (Based on Availability)
- 16.2.8 Apple Pay (Apple Inc )
- 16.2.8.1. Overview
- 16.2.8.2. Products
- 16.2.8.3. SWOT Analysis
- 16.2.8.4. Recent Developments
- 16.2.8.5. Financials (Based on Availability)
- 16.2.9 Adyen*List Not Exhaustive
- 16.2.9.1. Overview
- 16.2.9.2. Products
- 16.2.9.3. SWOT Analysis
- 16.2.9.4. Recent Developments
- 16.2.9.5. Financials (Based on Availability)
- 16.2.10 Google Pay (Google LLC)
- 16.2.10.1. Overview
- 16.2.10.2. Products
- 16.2.10.3. SWOT Analysis
- 16.2.10.4. Recent Developments
- 16.2.10.5. Financials (Based on Availability)
- 16.2.1 Visa Inc
List of Figures
- Figure 1: Global Payments Industry Revenue Breakdown (Million, %) by Region 2024 & 2032
- Figure 2: North America Payments Industry Revenue (Million), by Country 2024 & 2032
- Figure 3: North America Payments Industry Revenue Share (%), by Country 2024 & 2032
- Figure 4: Europe Payments Industry Revenue (Million), by Country 2024 & 2032
- Figure 5: Europe Payments Industry Revenue Share (%), by Country 2024 & 2032
- Figure 6: Asia Pacific Payments Industry Revenue (Million), by Country 2024 & 2032
- Figure 7: Asia Pacific Payments Industry Revenue Share (%), by Country 2024 & 2032
- Figure 8: Latin America Payments Industry Revenue (Million), by Country 2024 & 2032
- Figure 9: Latin America Payments Industry Revenue Share (%), by Country 2024 & 2032
- Figure 10: Middle East Payments Industry Revenue (Million), by Country 2024 & 2032
- Figure 11: Middle East Payments Industry Revenue Share (%), by Country 2024 & 2032
- Figure 12: North America Payments Industry Revenue (Million), by Mode of Payment 2024 & 2032
- Figure 13: North America Payments Industry Revenue Share (%), by Mode of Payment 2024 & 2032
- Figure 14: North America Payments Industry Revenue (Million), by End-user Industry 2024 & 2032
- Figure 15: North America Payments Industry Revenue Share (%), by End-user Industry 2024 & 2032
- Figure 16: North America Payments Industry Revenue (Million), by Country 2024 & 2032
- Figure 17: North America Payments Industry Revenue Share (%), by Country 2024 & 2032
- Figure 18: Europe Payments Industry Revenue (Million), by Mode of Payment 2024 & 2032
- Figure 19: Europe Payments Industry Revenue Share (%), by Mode of Payment 2024 & 2032
- Figure 20: Europe Payments Industry Revenue (Million), by End-user Industry 2024 & 2032
- Figure 21: Europe Payments Industry Revenue Share (%), by End-user Industry 2024 & 2032
- Figure 22: Europe Payments Industry Revenue (Million), by Country 2024 & 2032
- Figure 23: Europe Payments Industry Revenue Share (%), by Country 2024 & 2032
- Figure 24: Asia Pacific Payments Industry Revenue (Million), by Mode of Payment 2024 & 2032
- Figure 25: Asia Pacific Payments Industry Revenue Share (%), by Mode of Payment 2024 & 2032
- Figure 26: Asia Pacific Payments Industry Revenue (Million), by End-user Industry 2024 & 2032
- Figure 27: Asia Pacific Payments Industry Revenue Share (%), by End-user Industry 2024 & 2032
- Figure 28: Asia Pacific Payments Industry Revenue (Million), by Country 2024 & 2032
- Figure 29: Asia Pacific Payments Industry Revenue Share (%), by Country 2024 & 2032
- Figure 30: Latin America Payments Industry Revenue (Million), by Mode of Payment 2024 & 2032
- Figure 31: Latin America Payments Industry Revenue Share (%), by Mode of Payment 2024 & 2032
- Figure 32: Latin America Payments Industry Revenue (Million), by End-user Industry 2024 & 2032
- Figure 33: Latin America Payments Industry Revenue Share (%), by End-user Industry 2024 & 2032
- Figure 34: Latin America Payments Industry Revenue (Million), by Country 2024 & 2032
- Figure 35: Latin America Payments Industry Revenue Share (%), by Country 2024 & 2032
- Figure 36: Middle East Payments Industry Revenue (Million), by Mode of Payment 2024 & 2032
- Figure 37: Middle East Payments Industry Revenue Share (%), by Mode of Payment 2024 & 2032
- Figure 38: Middle East Payments Industry Revenue (Million), by End-user Industry 2024 & 2032
- Figure 39: Middle East Payments Industry Revenue Share (%), by End-user Industry 2024 & 2032
- Figure 40: Middle East Payments Industry Revenue (Million), by Country 2024 & 2032
- Figure 41: Middle East Payments Industry Revenue Share (%), by Country 2024 & 2032
List of Tables
- Table 1: Global Payments Industry Revenue Million Forecast, by Region 2019 & 2032
- Table 2: Global Payments Industry Revenue Million Forecast, by Mode of Payment 2019 & 2032
- Table 3: Global Payments Industry Revenue Million Forecast, by End-user Industry 2019 & 2032
- Table 4: Global Payments Industry Revenue Million Forecast, by Region 2019 & 2032
- Table 5: Global Payments Industry Revenue Million Forecast, by Country 2019 & 2032
- Table 6: Payments Industry Revenue (Million) Forecast, by Application 2019 & 2032
- Table 7: Global Payments Industry Revenue Million Forecast, by Country 2019 & 2032
- Table 8: Payments Industry Revenue (Million) Forecast, by Application 2019 & 2032
- Table 9: Global Payments Industry Revenue Million Forecast, by Country 2019 & 2032
- Table 10: Payments Industry Revenue (Million) Forecast, by Application 2019 & 2032
- Table 11: Global Payments Industry Revenue Million Forecast, by Country 2019 & 2032
- Table 12: Payments Industry Revenue (Million) Forecast, by Application 2019 & 2032
- Table 13: Global Payments Industry Revenue Million Forecast, by Country 2019 & 2032
- Table 14: Payments Industry Revenue (Million) Forecast, by Application 2019 & 2032
- Table 15: Global Payments Industry Revenue Million Forecast, by Mode of Payment 2019 & 2032
- Table 16: Global Payments Industry Revenue Million Forecast, by End-user Industry 2019 & 2032
- Table 17: Global Payments Industry Revenue Million Forecast, by Country 2019 & 2032
- Table 18: Global Payments Industry Revenue Million Forecast, by Mode of Payment 2019 & 2032
- Table 19: Global Payments Industry Revenue Million Forecast, by End-user Industry 2019 & 2032
- Table 20: Global Payments Industry Revenue Million Forecast, by Country 2019 & 2032
- Table 21: Global Payments Industry Revenue Million Forecast, by Mode of Payment 2019 & 2032
- Table 22: Global Payments Industry Revenue Million Forecast, by End-user Industry 2019 & 2032
- Table 23: Global Payments Industry Revenue Million Forecast, by Country 2019 & 2032
- Table 24: Global Payments Industry Revenue Million Forecast, by Mode of Payment 2019 & 2032
- Table 25: Global Payments Industry Revenue Million Forecast, by End-user Industry 2019 & 2032
- Table 26: Global Payments Industry Revenue Million Forecast, by Country 2019 & 2032
- Table 27: Global Payments Industry Revenue Million Forecast, by Mode of Payment 2019 & 2032
- Table 28: Global Payments Industry Revenue Million Forecast, by End-user Industry 2019 & 2032
- Table 29: Global Payments Industry Revenue Million Forecast, by Country 2019 & 2032
Frequently Asked Questions
1. What is the projected Compound Annual Growth Rate (CAGR) of the Payments Industry?
The projected CAGR is approximately 10.88%.
2. Which companies are prominent players in the Payments Industry?
Key companies in the market include Visa Inc, PayPal Holdings Inc, UnionPay International, Amazon Pay (Amazon com Inc ), American Express Company, Mastercard Inc, AliPay (Alibaba Group), Apple Pay (Apple Inc ), Adyen*List Not Exhaustive, Google Pay (Google LLC).
3. What are the main segments of the Payments Industry?
The market segments include Mode of Payment, End-user Industry.
4. Can you provide details about the market size?
The market size is estimated to be USD 2.85 Million as of 2022.
5. What are some drivers contributing to market growth?
E-commerce Supported by the Rise of M-commerce is Expected to Drive the Market; Enablement Programs by Key Retailers and Government Encouraging Digitization of the Market; Growth of Real-time Payments in Various Countries.
6. What are the notable trends driving market growth?
The Payments have been Sharing wide Traction Owing to Rising Retail Sector.
7. Are there any restraints impacting market growth?
High Implementation and Maintenance Cost.
8. Can you provide examples of recent developments in the market?
October 2023 - Square Capital LLC announced the debut of Tap to Pay on iPhone in Australia, where Square would make the technology available to its sellers. Tap to Pay on iPhone is available in the Square Point of Sale, Square for Retail, and Square Appointments iOS apps. It allows vendors of all sizes to accept contactless payments directly from their iPhones, with no additional hardware required or expense.
9. What pricing options are available for accessing the report?
Pricing options include single-user, multi-user, and enterprise licenses priced at USD 4750, USD 5250, and USD 8750 respectively.
10. Is the market size provided in terms of value or volume?
The market size is provided in terms of value, measured in Million.
11. Are there any specific market keywords associated with the report?
Yes, the market keyword associated with the report is "Payments Industry," which aids in identifying and referencing the specific market segment covered.
12. How do I determine which pricing option suits my needs best?
The pricing options vary based on user requirements and access needs. Individual users may opt for single-user licenses, while businesses requiring broader access may choose multi-user or enterprise licenses for cost-effective access to the report.
13. Are there any additional resources or data provided in the Payments Industry report?
While the report offers comprehensive insights, it's advisable to review the specific contents or supplementary materials provided to ascertain if additional resources or data are available.
14. How can I stay updated on further developments or reports in the Payments Industry?
To stay informed about further developments, trends, and reports in the Payments Industry, consider subscribing to industry newsletters, following relevant companies and organizations, or regularly checking reputable industry news sources and publications.
Methodology
Step 1 - Identification of Relevant Samples Size from Population Database


Step 2 - Approaches for Defining Global Market Size (Value, Volume* & Price*)

Note*: In applicable scenarios
Step 3 - Data Sources
Primary Research
- Web Analytics
- Survey Reports
- Research Institute
- Latest Research Reports
- Opinion Leaders
Secondary Research
- Annual Reports
- White Paper
- Latest Press Release
- Industry Association
- Paid Database
- Investor Presentations

Step 4 - Data Triangulation
Involves using different sources of information in order to increase the validity of a study
These sources are likely to be stakeholders in a program - participants, other researchers, program staff, other community members, and so on.
Then we put all data in single framework & apply various statistical tools to find out the dynamic on the market.
During the analysis stage, feedback from the stakeholder groups would be compared to determine areas of agreement as well as areas of divergence
