

Key Insights
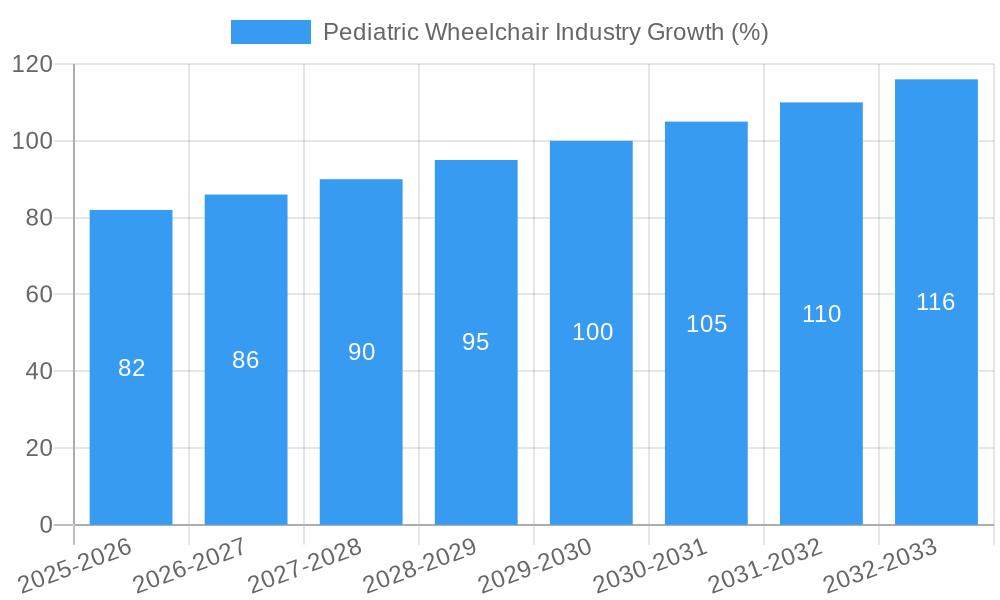
The global pediatric wheelchair market, currently exhibiting a Compound Annual Growth Rate (CAGR) of 5.30%, is poised for significant expansion throughout the forecast period (2025-2033). Driven by increasing prevalence of childhood disabilities, rising awareness of assistive technologies, and improved healthcare infrastructure in developing economies, the market is witnessing robust growth. Technological advancements leading to lighter, more comfortable, and customizable wheelchairs are further fueling demand. The market is segmented by product type (manual and powered), frame type (rigid and foldable), and end-user (hospitals, homecare settings, and others). Powered wheelchairs are experiencing faster growth compared to manual ones, reflecting a preference for enhanced mobility and independence. Foldable wheelchairs dominate the frame type segment due to ease of portability and storage. Hospitals represent a major end-user segment, driven by the increased number of children requiring mobility assistance post-surgery or due to congenital conditions. However, challenges remain, including high costs associated with advanced pediatric wheelchairs, particularly in low-income countries, and limited access to affordable rehabilitation services. This creates a significant opportunity for manufacturers to develop cost-effective solutions and for governments to invest in accessible healthcare programs. The market is geographically diverse, with North America and Europe currently holding substantial market share, while Asia Pacific is predicted to exhibit significant growth due to increasing awareness and rising disposable incomes. Key players like Invacare, Meyra GmbH, and Permobil are leveraging technological innovation and strategic partnerships to solidify their market positions.
The competitive landscape is characterized by both established players and emerging companies, each focused on specific product offerings and geographical markets. The market's future growth will hinge on continued technological innovation focusing on ergonomic design, lightweight materials, and advanced functionalities such as intelligent control systems. Simultaneously, increased accessibility through government initiatives, insurance coverage expansion, and awareness campaigns will be crucial to ensuring the benefits of pediatric wheelchairs reach children in need globally. Furthermore, the development of customized solutions catering to specific disabilities and age groups will be key to market expansion.
Pediatric Wheelchair Industry Market Report: 2019-2033
This comprehensive report provides a detailed analysis of the global pediatric wheelchair market, offering valuable insights for stakeholders including manufacturers, healthcare providers, and investors. The report covers the period 2019-2033, with a focus on the forecast period 2025-2033 and a base year of 2025. The market is projected to reach xx Million by 2033, exhibiting a robust CAGR of xx%. This in-depth analysis covers market segmentation, competitive dynamics, key drivers, and future growth potential. Benefit from actionable intelligence to navigate this dynamic market effectively.

Pediatric Wheelchair Industry Market Structure & Competitive Landscape
The global pediatric wheelchair market is moderately concentrated, with several major players holding significant market share. The top ten companies, including Invacare, MEYRA GmbH, Momentum Healthcare, AKCES-MED sp z o o, Medline, SORG Rollstuhltechnik GmbH, Ottobock, Permobil, and Sunrise Medical, collectively account for an estimated xx% of the market. However, the presence of numerous smaller players and emerging companies indicates a competitive landscape. Innovation, particularly in areas like adjustable designs and lightweight materials, is a key driver for market growth.
Regulatory frameworks, varying across different regions, influence product design and safety standards. While direct substitutes are limited, alternative mobility solutions, such as walkers and adaptive strollers, exert some competitive pressure. The market is segmented by product type (manual and powered), frame type (rigid and foldable), and end-user (hospitals, homecare settings, and other end users). Mergers and acquisitions (M&A) activity within the industry remains relatively low, with only a few notable transactions reported over the past five years (xx transactions totaling an estimated xx Million in value). This suggests a potential for consolidation in the coming years.
- Market Concentration: xx% market share held by top 10 players (estimated).
- Innovation Drivers: Lightweight materials, adjustable designs, smart technology integration.
- Regulatory Impacts: Varying standards across regions impacting product design and safety.
- Product Substitutes: Walkers, adaptive strollers exert limited competitive pressure.
- End-User Segmentation: Hospitals, homecare, and other end-users show diverse needs and preferences.
- M&A Trends: Relatively low activity; xx transactions in the past five years.
Pediatric Wheelchair Industry Market Trends & Opportunities
The pediatric wheelchair market is experiencing significant growth, driven by factors such as increasing prevalence of childhood disabilities, rising healthcare expenditure, and technological advancements. The market size is projected to expand from xx Million in 2025 to xx Million by 2033, at a compound annual growth rate (CAGR) of xx%. This growth is fueled by technological innovations, leading to lighter, more adaptable, and technologically advanced wheelchairs. Consumer preferences are shifting towards customized solutions that cater to individual needs and offer enhanced comfort and safety. The market exhibits a strong competitive landscape, with established players and new entrants vying for market share. Increased market penetration is expected in developing economies due to rising awareness and improving healthcare infrastructure. Technological shifts towards advanced materials and smart features are boosting market demand.
Dominant Markets & Segments in Pediatric Wheelchair Industry
The North American region currently dominates the global pediatric wheelchair market, owing to factors like high healthcare expenditure, advanced medical infrastructure, and a relatively high prevalence of childhood disabilities. However, Asia Pacific is emerging as a significant market, driven by increasing awareness, improving healthcare infrastructure, and rising disposable incomes.
- By Product Type: The powered wheelchair segment is growing at a faster pace than the manual segment, driven by technological advancements and increasing preference for convenience.
- By Frame Type: Foldable wheelchairs are more popular due to ease of portability and storage.
- By End User: Hospitals represent the largest segment, followed by homecare settings.
Key Growth Drivers:
- North America: High healthcare expenditure, advanced medical infrastructure, and high prevalence of childhood disabilities.
- Asia Pacific: Increasing awareness, improving healthcare infrastructure, rising disposable incomes.
- Europe: Strong regulatory framework supporting assistive technologies, well-established healthcare systems.
Pediatric Wheelchair Industry Product Analysis
Recent product innovations focus on adjustable designs that accommodate a child's growth, lightweight materials for ease of maneuverability, and integrated smart technologies for enhanced safety and monitoring. These advancements enhance the overall user experience, providing comfort, support, and independence. The market successfully caters to diverse needs through various product configurations, creating a strong market fit.
Key Drivers, Barriers & Challenges in Pediatric Wheelchair Industry
Key Drivers:
- Increasing prevalence of childhood disabilities.
- Technological advancements leading to improved product features.
- Rising healthcare expenditure and government initiatives.
Challenges & Restraints:
- High cost of advanced pediatric wheelchairs limiting affordability in certain regions.
- Supply chain disruptions impacting manufacturing and distribution.
- Stringent regulatory requirements and certification processes.
Growth Drivers in the Pediatric Wheelchair Industry Market
Growth is primarily driven by the rising prevalence of childhood disabilities, advancements in wheelchair technology, and increased healthcare spending. Government initiatives supporting assistive devices also contribute significantly.
Challenges Impacting Pediatric Wheelchair Industry Growth
Significant challenges include high product costs, supply chain vulnerabilities, and complex regulatory landscapes. These factors can restrict market expansion and accessibility.
Key Players Shaping the Pediatric Wheelchair Industry Market
- Invacare
- MEYRA GmbH
- Momentum Healthcare
- AKCES-MED sp z o o
- Medline
- SORG Rollstuhltechnik GmbH
- Ottobock
- Permobil
- Sunrise Medical
Significant Pediatric Wheelchair Industry Industry Milestones
- September 2022: Karma Medical launches the Flexx Adapt pediatric wheelchair at Rehacare 2022.
- May 2022: CRINA receives a donation of 107 pediatric wheelchairs from the US government.
Future Outlook for Pediatric Wheelchair Industry Market
The pediatric wheelchair market is poised for continued growth, driven by technological innovation, increasing awareness, and supportive government policies. Strategic partnerships and expansion into emerging markets present significant opportunities for market players. The focus on personalized solutions and improved accessibility will further shape the market's future.
Pediatric Wheelchair Industry Segmentation
-
1. Product Type
- 1.1. Manual
- 1.2. Powered
-
2. Frame Type
- 2.1. Rigid Wheelchairs
- 2.2. Foldable Wheelchairs
-
3. End User
- 3.1. Hopsitals
- 3.2. Homecare Setting
- 3.3. Other End Users
Pediatric Wheelchair Industry Segmentation By Geography
-
1. North America
- 1.1. United States
- 1.2. Canada
- 1.3. Mexico
-
2. Europe
- 2.1. Germany
- 2.2. United Kingdom
- 2.3. France
- 2.4. Italy
- 2.5. Spain
- 2.6. Rest of Europe
-
3. Asia Pacific
- 3.1. China
- 3.2. Japan
- 3.3. India
- 3.4. Australia
- 3.5. South Korea
- 3.6. Rest of Asia Pacific
-
4. Middle East and Africa
- 4.1. GCC
- 4.2. South Africa
- 4.3. Rest of Middle East and Africa
-
5. South America
- 5.1. Brazil
- 5.2. Argentina
- 5.3. Rest of South America

Pediatric Wheelchair Industry REPORT HIGHLIGHTS
| Aspects | Details |
|---|---|
| Study Period | 2019-2033 |
| Base Year | 2024 |
| Estimated Year | 2025 |
| Forecast Period | 2025-2033 |
| Historical Period | 2019-2024 |
| Growth Rate | CAGR of 5.30% from 2019-2033 |
| Segmentation |
|
Table of Contents
- 1. Introduction
- 1.1. Research Scope
- 1.2. Market Segmentation
- 1.3. Research Methodology
- 1.4. Definitions and Assumptions
- 2. Executive Summary
- 2.1. Introduction
- 3. Market Dynamics
- 3.1. Introduction
- 3.2. Market Drivers
- 3.2.1. Rising Incidences of Disabilities in Children; Supportive Government Policies and Funding
- 3.3. Market Restrains
- 3.3.1. High Cost of Paediatric Wheelchairs
- 3.4. Market Trends
- 3.4.1. Manual Wheelchairs Segment Dominates the Market and is Expected to do so in the Forecast Period
- 4. Market Factor Analysis
- 4.1. Porters Five Forces
- 4.2. Supply/Value Chain
- 4.3. PESTEL analysis
- 4.4. Market Entropy
- 4.5. Patent/Trademark Analysis
- 5. Global Pediatric Wheelchair Industry Analysis, Insights and Forecast, 2019-2031
- 5.1. Market Analysis, Insights and Forecast - by Product Type
- 5.1.1. Manual
- 5.1.2. Powered
- 5.2. Market Analysis, Insights and Forecast - by Frame Type
- 5.2.1. Rigid Wheelchairs
- 5.2.2. Foldable Wheelchairs
- 5.3. Market Analysis, Insights and Forecast - by End User
- 5.3.1. Hopsitals
- 5.3.2. Homecare Setting
- 5.3.3. Other End Users
- 5.4. Market Analysis, Insights and Forecast - by Region
- 5.4.1. North America
- 5.4.2. Europe
- 5.4.3. Asia Pacific
- 5.4.4. Middle East and Africa
- 5.4.5. South America
- 5.1. Market Analysis, Insights and Forecast - by Product Type
- 6. North America Pediatric Wheelchair Industry Analysis, Insights and Forecast, 2019-2031
- 6.1. Market Analysis, Insights and Forecast - by Product Type
- 6.1.1. Manual
- 6.1.2. Powered
- 6.2. Market Analysis, Insights and Forecast - by Frame Type
- 6.2.1. Rigid Wheelchairs
- 6.2.2. Foldable Wheelchairs
- 6.3. Market Analysis, Insights and Forecast - by End User
- 6.3.1. Hopsitals
- 6.3.2. Homecare Setting
- 6.3.3. Other End Users
- 6.1. Market Analysis, Insights and Forecast - by Product Type
- 7. Europe Pediatric Wheelchair Industry Analysis, Insights and Forecast, 2019-2031
- 7.1. Market Analysis, Insights and Forecast - by Product Type
- 7.1.1. Manual
- 7.1.2. Powered
- 7.2. Market Analysis, Insights and Forecast - by Frame Type
- 7.2.1. Rigid Wheelchairs
- 7.2.2. Foldable Wheelchairs
- 7.3. Market Analysis, Insights and Forecast - by End User
- 7.3.1. Hopsitals
- 7.3.2. Homecare Setting
- 7.3.3. Other End Users
- 7.1. Market Analysis, Insights and Forecast - by Product Type
- 8. Asia Pacific Pediatric Wheelchair Industry Analysis, Insights and Forecast, 2019-2031
- 8.1. Market Analysis, Insights and Forecast - by Product Type
- 8.1.1. Manual
- 8.1.2. Powered
- 8.2. Market Analysis, Insights and Forecast - by Frame Type
- 8.2.1. Rigid Wheelchairs
- 8.2.2. Foldable Wheelchairs
- 8.3. Market Analysis, Insights and Forecast - by End User
- 8.3.1. Hopsitals
- 8.3.2. Homecare Setting
- 8.3.3. Other End Users
- 8.1. Market Analysis, Insights and Forecast - by Product Type
- 9. Middle East and Africa Pediatric Wheelchair Industry Analysis, Insights and Forecast, 2019-2031
- 9.1. Market Analysis, Insights and Forecast - by Product Type
- 9.1.1. Manual
- 9.1.2. Powered
- 9.2. Market Analysis, Insights and Forecast - by Frame Type
- 9.2.1. Rigid Wheelchairs
- 9.2.2. Foldable Wheelchairs
- 9.3. Market Analysis, Insights and Forecast - by End User
- 9.3.1. Hopsitals
- 9.3.2. Homecare Setting
- 9.3.3. Other End Users
- 9.1. Market Analysis, Insights and Forecast - by Product Type
- 10. South America Pediatric Wheelchair Industry Analysis, Insights and Forecast, 2019-2031
- 10.1. Market Analysis, Insights and Forecast - by Product Type
- 10.1.1. Manual
- 10.1.2. Powered
- 10.2. Market Analysis, Insights and Forecast - by Frame Type
- 10.2.1. Rigid Wheelchairs
- 10.2.2. Foldable Wheelchairs
- 10.3. Market Analysis, Insights and Forecast - by End User
- 10.3.1. Hopsitals
- 10.3.2. Homecare Setting
- 10.3.3. Other End Users
- 10.1. Market Analysis, Insights and Forecast - by Product Type
- 11. North America Pediatric Wheelchair Industry Analysis, Insights and Forecast, 2019-2031
- 11.1. Market Analysis, Insights and Forecast - By Country/Sub-region
- 11.1.1 United States
- 11.1.2 Canada
- 11.1.3 Mexico
- 12. Europe Pediatric Wheelchair Industry Analysis, Insights and Forecast, 2019-2031
- 12.1. Market Analysis, Insights and Forecast - By Country/Sub-region
- 12.1.1 Germany
- 12.1.2 United Kingdom
- 12.1.3 France
- 12.1.4 Italy
- 12.1.5 Spain
- 12.1.6 Rest of Europe
- 13. Asia Pacific Pediatric Wheelchair Industry Analysis, Insights and Forecast, 2019-2031
- 13.1. Market Analysis, Insights and Forecast - By Country/Sub-region
- 13.1.1 China
- 13.1.2 Japan
- 13.1.3 India
- 13.1.4 Australia
- 13.1.5 South Korea
- 13.1.6 Rest of Asia Pacific
- 14. Middle East and Africa Pediatric Wheelchair Industry Analysis, Insights and Forecast, 2019-2031
- 14.1. Market Analysis, Insights and Forecast - By Country/Sub-region
- 14.1.1 GCC
- 14.1.2 South Africa
- 14.1.3 Rest of Middle East and Africa
- 15. South America Pediatric Wheelchair Industry Analysis, Insights and Forecast, 2019-2031
- 15.1. Market Analysis, Insights and Forecast - By Country/Sub-region
- 15.1.1 Brazil
- 15.1.2 Argentina
- 15.1.3 Rest of South America
- 16. Competitive Analysis
- 16.1. Global Market Share Analysis 2024
- 16.2. Company Profiles
- 16.2.1 Invacare
- 16.2.1.1. Overview
- 16.2.1.2. Products
- 16.2.1.3. SWOT Analysis
- 16.2.1.4. Recent Developments
- 16.2.1.5. Financials (Based on Availability)
- 16.2.2 MEYRA GmbH
- 16.2.2.1. Overview
- 16.2.2.2. Products
- 16.2.2.3. SWOT Analysis
- 16.2.2.4. Recent Developments
- 16.2.2.5. Financials (Based on Availability)
- 16.2.3 Momentum Healthcare
- 16.2.3.1. Overview
- 16.2.3.2. Products
- 16.2.3.3. SWOT Analysis
- 16.2.3.4. Recent Developments
- 16.2.3.5. Financials (Based on Availability)
- 16.2.4 AKCES-MED sp z o o
- 16.2.4.1. Overview
- 16.2.4.2. Products
- 16.2.4.3. SWOT Analysis
- 16.2.4.4. Recent Developments
- 16.2.4.5. Financials (Based on Availability)
- 16.2.5 Medline
- 16.2.5.1. Overview
- 16.2.5.2. Products
- 16.2.5.3. SWOT Analysis
- 16.2.5.4. Recent Developments
- 16.2.5.5. Financials (Based on Availability)
- 16.2.6 SORG Rollstuhltechnik GmbH
- 16.2.6.1. Overview
- 16.2.6.2. Products
- 16.2.6.3. SWOT Analysis
- 16.2.6.4. Recent Developments
- 16.2.6.5. Financials (Based on Availability)
- 16.2.7 Ottobock
- 16.2.7.1. Overview
- 16.2.7.2. Products
- 16.2.7.3. SWOT Analysis
- 16.2.7.4. Recent Developments
- 16.2.7.5. Financials (Based on Availability)
- 16.2.8 Permobil
- 16.2.8.1. Overview
- 16.2.8.2. Products
- 16.2.8.3. SWOT Analysis
- 16.2.8.4. Recent Developments
- 16.2.8.5. Financials (Based on Availability)
- 16.2.9 Sunrise Medical
- 16.2.9.1. Overview
- 16.2.9.2. Products
- 16.2.9.3. SWOT Analysis
- 16.2.9.4. Recent Developments
- 16.2.9.5. Financials (Based on Availability)
- 16.2.1 Invacare
List of Figures
- Figure 1: Global Pediatric Wheelchair Industry Revenue Breakdown (Million, %) by Region 2024 & 2032
- Figure 2: Global Pediatric Wheelchair Industry Volume Breakdown (K Unit, %) by Region 2024 & 2032
- Figure 3: North America Pediatric Wheelchair Industry Revenue (Million), by Country 2024 & 2032
- Figure 4: North America Pediatric Wheelchair Industry Volume (K Unit), by Country 2024 & 2032
- Figure 5: North America Pediatric Wheelchair Industry Revenue Share (%), by Country 2024 & 2032
- Figure 6: North America Pediatric Wheelchair Industry Volume Share (%), by Country 2024 & 2032
- Figure 7: Europe Pediatric Wheelchair Industry Revenue (Million), by Country 2024 & 2032
- Figure 8: Europe Pediatric Wheelchair Industry Volume (K Unit), by Country 2024 & 2032
- Figure 9: Europe Pediatric Wheelchair Industry Revenue Share (%), by Country 2024 & 2032
- Figure 10: Europe Pediatric Wheelchair Industry Volume Share (%), by Country 2024 & 2032
- Figure 11: Asia Pacific Pediatric Wheelchair Industry Revenue (Million), by Country 2024 & 2032
- Figure 12: Asia Pacific Pediatric Wheelchair Industry Volume (K Unit), by Country 2024 & 2032
- Figure 13: Asia Pacific Pediatric Wheelchair Industry Revenue Share (%), by Country 2024 & 2032
- Figure 14: Asia Pacific Pediatric Wheelchair Industry Volume Share (%), by Country 2024 & 2032
- Figure 15: Middle East and Africa Pediatric Wheelchair Industry Revenue (Million), by Country 2024 & 2032
- Figure 16: Middle East and Africa Pediatric Wheelchair Industry Volume (K Unit), by Country 2024 & 2032
- Figure 17: Middle East and Africa Pediatric Wheelchair Industry Revenue Share (%), by Country 2024 & 2032
- Figure 18: Middle East and Africa Pediatric Wheelchair Industry Volume Share (%), by Country 2024 & 2032
- Figure 19: South America Pediatric Wheelchair Industry Revenue (Million), by Country 2024 & 2032
- Figure 20: South America Pediatric Wheelchair Industry Volume (K Unit), by Country 2024 & 2032
- Figure 21: South America Pediatric Wheelchair Industry Revenue Share (%), by Country 2024 & 2032
- Figure 22: South America Pediatric Wheelchair Industry Volume Share (%), by Country 2024 & 2032
- Figure 23: North America Pediatric Wheelchair Industry Revenue (Million), by Product Type 2024 & 2032
- Figure 24: North America Pediatric Wheelchair Industry Volume (K Unit), by Product Type 2024 & 2032
- Figure 25: North America Pediatric Wheelchair Industry Revenue Share (%), by Product Type 2024 & 2032
- Figure 26: North America Pediatric Wheelchair Industry Volume Share (%), by Product Type 2024 & 2032
- Figure 27: North America Pediatric Wheelchair Industry Revenue (Million), by Frame Type 2024 & 2032
- Figure 28: North America Pediatric Wheelchair Industry Volume (K Unit), by Frame Type 2024 & 2032
- Figure 29: North America Pediatric Wheelchair Industry Revenue Share (%), by Frame Type 2024 & 2032
- Figure 30: North America Pediatric Wheelchair Industry Volume Share (%), by Frame Type 2024 & 2032
- Figure 31: North America Pediatric Wheelchair Industry Revenue (Million), by End User 2024 & 2032
- Figure 32: North America Pediatric Wheelchair Industry Volume (K Unit), by End User 2024 & 2032
- Figure 33: North America Pediatric Wheelchair Industry Revenue Share (%), by End User 2024 & 2032
- Figure 34: North America Pediatric Wheelchair Industry Volume Share (%), by End User 2024 & 2032
- Figure 35: North America Pediatric Wheelchair Industry Revenue (Million), by Country 2024 & 2032
- Figure 36: North America Pediatric Wheelchair Industry Volume (K Unit), by Country 2024 & 2032
- Figure 37: North America Pediatric Wheelchair Industry Revenue Share (%), by Country 2024 & 2032
- Figure 38: North America Pediatric Wheelchair Industry Volume Share (%), by Country 2024 & 2032
- Figure 39: Europe Pediatric Wheelchair Industry Revenue (Million), by Product Type 2024 & 2032
- Figure 40: Europe Pediatric Wheelchair Industry Volume (K Unit), by Product Type 2024 & 2032
- Figure 41: Europe Pediatric Wheelchair Industry Revenue Share (%), by Product Type 2024 & 2032
- Figure 42: Europe Pediatric Wheelchair Industry Volume Share (%), by Product Type 2024 & 2032
- Figure 43: Europe Pediatric Wheelchair Industry Revenue (Million), by Frame Type 2024 & 2032
- Figure 44: Europe Pediatric Wheelchair Industry Volume (K Unit), by Frame Type 2024 & 2032
- Figure 45: Europe Pediatric Wheelchair Industry Revenue Share (%), by Frame Type 2024 & 2032
- Figure 46: Europe Pediatric Wheelchair Industry Volume Share (%), by Frame Type 2024 & 2032
- Figure 47: Europe Pediatric Wheelchair Industry Revenue (Million), by End User 2024 & 2032
- Figure 48: Europe Pediatric Wheelchair Industry Volume (K Unit), by End User 2024 & 2032
- Figure 49: Europe Pediatric Wheelchair Industry Revenue Share (%), by End User 2024 & 2032
- Figure 50: Europe Pediatric Wheelchair Industry Volume Share (%), by End User 2024 & 2032
- Figure 51: Europe Pediatric Wheelchair Industry Revenue (Million), by Country 2024 & 2032
- Figure 52: Europe Pediatric Wheelchair Industry Volume (K Unit), by Country 2024 & 2032
- Figure 53: Europe Pediatric Wheelchair Industry Revenue Share (%), by Country 2024 & 2032
- Figure 54: Europe Pediatric Wheelchair Industry Volume Share (%), by Country 2024 & 2032
- Figure 55: Asia Pacific Pediatric Wheelchair Industry Revenue (Million), by Product Type 2024 & 2032
- Figure 56: Asia Pacific Pediatric Wheelchair Industry Volume (K Unit), by Product Type 2024 & 2032
- Figure 57: Asia Pacific Pediatric Wheelchair Industry Revenue Share (%), by Product Type 2024 & 2032
- Figure 58: Asia Pacific Pediatric Wheelchair Industry Volume Share (%), by Product Type 2024 & 2032
- Figure 59: Asia Pacific Pediatric Wheelchair Industry Revenue (Million), by Frame Type 2024 & 2032
- Figure 60: Asia Pacific Pediatric Wheelchair Industry Volume (K Unit), by Frame Type 2024 & 2032
- Figure 61: Asia Pacific Pediatric Wheelchair Industry Revenue Share (%), by Frame Type 2024 & 2032
- Figure 62: Asia Pacific Pediatric Wheelchair Industry Volume Share (%), by Frame Type 2024 & 2032
- Figure 63: Asia Pacific Pediatric Wheelchair Industry Revenue (Million), by End User 2024 & 2032
- Figure 64: Asia Pacific Pediatric Wheelchair Industry Volume (K Unit), by End User 2024 & 2032
- Figure 65: Asia Pacific Pediatric Wheelchair Industry Revenue Share (%), by End User 2024 & 2032
- Figure 66: Asia Pacific Pediatric Wheelchair Industry Volume Share (%), by End User 2024 & 2032
- Figure 67: Asia Pacific Pediatric Wheelchair Industry Revenue (Million), by Country 2024 & 2032
- Figure 68: Asia Pacific Pediatric Wheelchair Industry Volume (K Unit), by Country 2024 & 2032
- Figure 69: Asia Pacific Pediatric Wheelchair Industry Revenue Share (%), by Country 2024 & 2032
- Figure 70: Asia Pacific Pediatric Wheelchair Industry Volume Share (%), by Country 2024 & 2032
- Figure 71: Middle East and Africa Pediatric Wheelchair Industry Revenue (Million), by Product Type 2024 & 2032
- Figure 72: Middle East and Africa Pediatric Wheelchair Industry Volume (K Unit), by Product Type 2024 & 2032
- Figure 73: Middle East and Africa Pediatric Wheelchair Industry Revenue Share (%), by Product Type 2024 & 2032
- Figure 74: Middle East and Africa Pediatric Wheelchair Industry Volume Share (%), by Product Type 2024 & 2032
- Figure 75: Middle East and Africa Pediatric Wheelchair Industry Revenue (Million), by Frame Type 2024 & 2032
- Figure 76: Middle East and Africa Pediatric Wheelchair Industry Volume (K Unit), by Frame Type 2024 & 2032
- Figure 77: Middle East and Africa Pediatric Wheelchair Industry Revenue Share (%), by Frame Type 2024 & 2032
- Figure 78: Middle East and Africa Pediatric Wheelchair Industry Volume Share (%), by Frame Type 2024 & 2032
- Figure 79: Middle East and Africa Pediatric Wheelchair Industry Revenue (Million), by End User 2024 & 2032
- Figure 80: Middle East and Africa Pediatric Wheelchair Industry Volume (K Unit), by End User 2024 & 2032
- Figure 81: Middle East and Africa Pediatric Wheelchair Industry Revenue Share (%), by End User 2024 & 2032
- Figure 82: Middle East and Africa Pediatric Wheelchair Industry Volume Share (%), by End User 2024 & 2032
- Figure 83: Middle East and Africa Pediatric Wheelchair Industry Revenue (Million), by Country 2024 & 2032
- Figure 84: Middle East and Africa Pediatric Wheelchair Industry Volume (K Unit), by Country 2024 & 2032
- Figure 85: Middle East and Africa Pediatric Wheelchair Industry Revenue Share (%), by Country 2024 & 2032
- Figure 86: Middle East and Africa Pediatric Wheelchair Industry Volume Share (%), by Country 2024 & 2032
- Figure 87: South America Pediatric Wheelchair Industry Revenue (Million), by Product Type 2024 & 2032
- Figure 88: South America Pediatric Wheelchair Industry Volume (K Unit), by Product Type 2024 & 2032
- Figure 89: South America Pediatric Wheelchair Industry Revenue Share (%), by Product Type 2024 & 2032
- Figure 90: South America Pediatric Wheelchair Industry Volume Share (%), by Product Type 2024 & 2032
- Figure 91: South America Pediatric Wheelchair Industry Revenue (Million), by Frame Type 2024 & 2032
- Figure 92: South America Pediatric Wheelchair Industry Volume (K Unit), by Frame Type 2024 & 2032
- Figure 93: South America Pediatric Wheelchair Industry Revenue Share (%), by Frame Type 2024 & 2032
- Figure 94: South America Pediatric Wheelchair Industry Volume Share (%), by Frame Type 2024 & 2032
- Figure 95: South America Pediatric Wheelchair Industry Revenue (Million), by End User 2024 & 2032
- Figure 96: South America Pediatric Wheelchair Industry Volume (K Unit), by End User 2024 & 2032
- Figure 97: South America Pediatric Wheelchair Industry Revenue Share (%), by End User 2024 & 2032
- Figure 98: South America Pediatric Wheelchair Industry Volume Share (%), by End User 2024 & 2032
- Figure 99: South America Pediatric Wheelchair Industry Revenue (Million), by Country 2024 & 2032
- Figure 100: South America Pediatric Wheelchair Industry Volume (K Unit), by Country 2024 & 2032
- Figure 101: South America Pediatric Wheelchair Industry Revenue Share (%), by Country 2024 & 2032
- Figure 102: South America Pediatric Wheelchair Industry Volume Share (%), by Country 2024 & 2032
List of Tables
- Table 1: Global Pediatric Wheelchair Industry Revenue Million Forecast, by Region 2019 & 2032
- Table 2: Global Pediatric Wheelchair Industry Volume K Unit Forecast, by Region 2019 & 2032
- Table 3: Global Pediatric Wheelchair Industry Revenue Million Forecast, by Product Type 2019 & 2032
- Table 4: Global Pediatric Wheelchair Industry Volume K Unit Forecast, by Product Type 2019 & 2032
- Table 5: Global Pediatric Wheelchair Industry Revenue Million Forecast, by Frame Type 2019 & 2032
- Table 6: Global Pediatric Wheelchair Industry Volume K Unit Forecast, by Frame Type 2019 & 2032
- Table 7: Global Pediatric Wheelchair Industry Revenue Million Forecast, by End User 2019 & 2032
- Table 8: Global Pediatric Wheelchair Industry Volume K Unit Forecast, by End User 2019 & 2032
- Table 9: Global Pediatric Wheelchair Industry Revenue Million Forecast, by Region 2019 & 2032
- Table 10: Global Pediatric Wheelchair Industry Volume K Unit Forecast, by Region 2019 & 2032
- Table 11: Global Pediatric Wheelchair Industry Revenue Million Forecast, by Country 2019 & 2032
- Table 12: Global Pediatric Wheelchair Industry Volume K Unit Forecast, by Country 2019 & 2032
- Table 13: United States Pediatric Wheelchair Industry Revenue (Million) Forecast, by Application 2019 & 2032
- Table 14: United States Pediatric Wheelchair Industry Volume (K Unit) Forecast, by Application 2019 & 2032
- Table 15: Canada Pediatric Wheelchair Industry Revenue (Million) Forecast, by Application 2019 & 2032
- Table 16: Canada Pediatric Wheelchair Industry Volume (K Unit) Forecast, by Application 2019 & 2032
- Table 17: Mexico Pediatric Wheelchair Industry Revenue (Million) Forecast, by Application 2019 & 2032
- Table 18: Mexico Pediatric Wheelchair Industry Volume (K Unit) Forecast, by Application 2019 & 2032
- Table 19: Global Pediatric Wheelchair Industry Revenue Million Forecast, by Country 2019 & 2032
- Table 20: Global Pediatric Wheelchair Industry Volume K Unit Forecast, by Country 2019 & 2032
- Table 21: Germany Pediatric Wheelchair Industry Revenue (Million) Forecast, by Application 2019 & 2032
- Table 22: Germany Pediatric Wheelchair Industry Volume (K Unit) Forecast, by Application 2019 & 2032
- Table 23: United Kingdom Pediatric Wheelchair Industry Revenue (Million) Forecast, by Application 2019 & 2032
- Table 24: United Kingdom Pediatric Wheelchair Industry Volume (K Unit) Forecast, by Application 2019 & 2032
- Table 25: France Pediatric Wheelchair Industry Revenue (Million) Forecast, by Application 2019 & 2032
- Table 26: France Pediatric Wheelchair Industry Volume (K Unit) Forecast, by Application 2019 & 2032
- Table 27: Italy Pediatric Wheelchair Industry Revenue (Million) Forecast, by Application 2019 & 2032
- Table 28: Italy Pediatric Wheelchair Industry Volume (K Unit) Forecast, by Application 2019 & 2032
- Table 29: Spain Pediatric Wheelchair Industry Revenue (Million) Forecast, by Application 2019 & 2032
- Table 30: Spain Pediatric Wheelchair Industry Volume (K Unit) Forecast, by Application 2019 & 2032
- Table 31: Rest of Europe Pediatric Wheelchair Industry Revenue (Million) Forecast, by Application 2019 & 2032
- Table 32: Rest of Europe Pediatric Wheelchair Industry Volume (K Unit) Forecast, by Application 2019 & 2032
- Table 33: Global Pediatric Wheelchair Industry Revenue Million Forecast, by Country 2019 & 2032
- Table 34: Global Pediatric Wheelchair Industry Volume K Unit Forecast, by Country 2019 & 2032
- Table 35: China Pediatric Wheelchair Industry Revenue (Million) Forecast, by Application 2019 & 2032
- Table 36: China Pediatric Wheelchair Industry Volume (K Unit) Forecast, by Application 2019 & 2032
- Table 37: Japan Pediatric Wheelchair Industry Revenue (Million) Forecast, by Application 2019 & 2032
- Table 38: Japan Pediatric Wheelchair Industry Volume (K Unit) Forecast, by Application 2019 & 2032
- Table 39: India Pediatric Wheelchair Industry Revenue (Million) Forecast, by Application 2019 & 2032
- Table 40: India Pediatric Wheelchair Industry Volume (K Unit) Forecast, by Application 2019 & 2032
- Table 41: Australia Pediatric Wheelchair Industry Revenue (Million) Forecast, by Application 2019 & 2032
- Table 42: Australia Pediatric Wheelchair Industry Volume (K Unit) Forecast, by Application 2019 & 2032
- Table 43: South Korea Pediatric Wheelchair Industry Revenue (Million) Forecast, by Application 2019 & 2032
- Table 44: South Korea Pediatric Wheelchair Industry Volume (K Unit) Forecast, by Application 2019 & 2032
- Table 45: Rest of Asia Pacific Pediatric Wheelchair Industry Revenue (Million) Forecast, by Application 2019 & 2032
- Table 46: Rest of Asia Pacific Pediatric Wheelchair Industry Volume (K Unit) Forecast, by Application 2019 & 2032
- Table 47: Global Pediatric Wheelchair Industry Revenue Million Forecast, by Country 2019 & 2032
- Table 48: Global Pediatric Wheelchair Industry Volume K Unit Forecast, by Country 2019 & 2032
- Table 49: GCC Pediatric Wheelchair Industry Revenue (Million) Forecast, by Application 2019 & 2032
- Table 50: GCC Pediatric Wheelchair Industry Volume (K Unit) Forecast, by Application 2019 & 2032
- Table 51: South Africa Pediatric Wheelchair Industry Revenue (Million) Forecast, by Application 2019 & 2032
- Table 52: South Africa Pediatric Wheelchair Industry Volume (K Unit) Forecast, by Application 2019 & 2032
- Table 53: Rest of Middle East and Africa Pediatric Wheelchair Industry Revenue (Million) Forecast, by Application 2019 & 2032
- Table 54: Rest of Middle East and Africa Pediatric Wheelchair Industry Volume (K Unit) Forecast, by Application 2019 & 2032
- Table 55: Global Pediatric Wheelchair Industry Revenue Million Forecast, by Country 2019 & 2032
- Table 56: Global Pediatric Wheelchair Industry Volume K Unit Forecast, by Country 2019 & 2032
- Table 57: Brazil Pediatric Wheelchair Industry Revenue (Million) Forecast, by Application 2019 & 2032
- Table 58: Brazil Pediatric Wheelchair Industry Volume (K Unit) Forecast, by Application 2019 & 2032
- Table 59: Argentina Pediatric Wheelchair Industry Revenue (Million) Forecast, by Application 2019 & 2032
- Table 60: Argentina Pediatric Wheelchair Industry Volume (K Unit) Forecast, by Application 2019 & 2032
- Table 61: Rest of South America Pediatric Wheelchair Industry Revenue (Million) Forecast, by Application 2019 & 2032
- Table 62: Rest of South America Pediatric Wheelchair Industry Volume (K Unit) Forecast, by Application 2019 & 2032
- Table 63: Global Pediatric Wheelchair Industry Revenue Million Forecast, by Product Type 2019 & 2032
- Table 64: Global Pediatric Wheelchair Industry Volume K Unit Forecast, by Product Type 2019 & 2032
- Table 65: Global Pediatric Wheelchair Industry Revenue Million Forecast, by Frame Type 2019 & 2032
- Table 66: Global Pediatric Wheelchair Industry Volume K Unit Forecast, by Frame Type 2019 & 2032
- Table 67: Global Pediatric Wheelchair Industry Revenue Million Forecast, by End User 2019 & 2032
- Table 68: Global Pediatric Wheelchair Industry Volume K Unit Forecast, by End User 2019 & 2032
- Table 69: Global Pediatric Wheelchair Industry Revenue Million Forecast, by Country 2019 & 2032
- Table 70: Global Pediatric Wheelchair Industry Volume K Unit Forecast, by Country 2019 & 2032
- Table 71: United States Pediatric Wheelchair Industry Revenue (Million) Forecast, by Application 2019 & 2032
- Table 72: United States Pediatric Wheelchair Industry Volume (K Unit) Forecast, by Application 2019 & 2032
- Table 73: Canada Pediatric Wheelchair Industry Revenue (Million) Forecast, by Application 2019 & 2032
- Table 74: Canada Pediatric Wheelchair Industry Volume (K Unit) Forecast, by Application 2019 & 2032
- Table 75: Mexico Pediatric Wheelchair Industry Revenue (Million) Forecast, by Application 2019 & 2032
- Table 76: Mexico Pediatric Wheelchair Industry Volume (K Unit) Forecast, by Application 2019 & 2032
- Table 77: Global Pediatric Wheelchair Industry Revenue Million Forecast, by Product Type 2019 & 2032
- Table 78: Global Pediatric Wheelchair Industry Volume K Unit Forecast, by Product Type 2019 & 2032
- Table 79: Global Pediatric Wheelchair Industry Revenue Million Forecast, by Frame Type 2019 & 2032
- Table 80: Global Pediatric Wheelchair Industry Volume K Unit Forecast, by Frame Type 2019 & 2032
- Table 81: Global Pediatric Wheelchair Industry Revenue Million Forecast, by End User 2019 & 2032
- Table 82: Global Pediatric Wheelchair Industry Volume K Unit Forecast, by End User 2019 & 2032
- Table 83: Global Pediatric Wheelchair Industry Revenue Million Forecast, by Country 2019 & 2032
- Table 84: Global Pediatric Wheelchair Industry Volume K Unit Forecast, by Country 2019 & 2032
- Table 85: Germany Pediatric Wheelchair Industry Revenue (Million) Forecast, by Application 2019 & 2032
- Table 86: Germany Pediatric Wheelchair Industry Volume (K Unit) Forecast, by Application 2019 & 2032
- Table 87: United Kingdom Pediatric Wheelchair Industry Revenue (Million) Forecast, by Application 2019 & 2032
- Table 88: United Kingdom Pediatric Wheelchair Industry Volume (K Unit) Forecast, by Application 2019 & 2032
- Table 89: France Pediatric Wheelchair Industry Revenue (Million) Forecast, by Application 2019 & 2032
- Table 90: France Pediatric Wheelchair Industry Volume (K Unit) Forecast, by Application 2019 & 2032
- Table 91: Italy Pediatric Wheelchair Industry Revenue (Million) Forecast, by Application 2019 & 2032
- Table 92: Italy Pediatric Wheelchair Industry Volume (K Unit) Forecast, by Application 2019 & 2032
- Table 93: Spain Pediatric Wheelchair Industry Revenue (Million) Forecast, by Application 2019 & 2032
- Table 94: Spain Pediatric Wheelchair Industry Volume (K Unit) Forecast, by Application 2019 & 2032
- Table 95: Rest of Europe Pediatric Wheelchair Industry Revenue (Million) Forecast, by Application 2019 & 2032
- Table 96: Rest of Europe Pediatric Wheelchair Industry Volume (K Unit) Forecast, by Application 2019 & 2032
- Table 97: Global Pediatric Wheelchair Industry Revenue Million Forecast, by Product Type 2019 & 2032
- Table 98: Global Pediatric Wheelchair Industry Volume K Unit Forecast, by Product Type 2019 & 2032
- Table 99: Global Pediatric Wheelchair Industry Revenue Million Forecast, by Frame Type 2019 & 2032
- Table 100: Global Pediatric Wheelchair Industry Volume K Unit Forecast, by Frame Type 2019 & 2032
- Table 101: Global Pediatric Wheelchair Industry Revenue Million Forecast, by End User 2019 & 2032
- Table 102: Global Pediatric Wheelchair Industry Volume K Unit Forecast, by End User 2019 & 2032
- Table 103: Global Pediatric Wheelchair Industry Revenue Million Forecast, by Country 2019 & 2032
- Table 104: Global Pediatric Wheelchair Industry Volume K Unit Forecast, by Country 2019 & 2032
- Table 105: China Pediatric Wheelchair Industry Revenue (Million) Forecast, by Application 2019 & 2032
- Table 106: China Pediatric Wheelchair Industry Volume (K Unit) Forecast, by Application 2019 & 2032
- Table 107: Japan Pediatric Wheelchair Industry Revenue (Million) Forecast, by Application 2019 & 2032
- Table 108: Japan Pediatric Wheelchair Industry Volume (K Unit) Forecast, by Application 2019 & 2032
- Table 109: India Pediatric Wheelchair Industry Revenue (Million) Forecast, by Application 2019 & 2032
- Table 110: India Pediatric Wheelchair Industry Volume (K Unit) Forecast, by Application 2019 & 2032
- Table 111: Australia Pediatric Wheelchair Industry Revenue (Million) Forecast, by Application 2019 & 2032
- Table 112: Australia Pediatric Wheelchair Industry Volume (K Unit) Forecast, by Application 2019 & 2032
- Table 113: South Korea Pediatric Wheelchair Industry Revenue (Million) Forecast, by Application 2019 & 2032
- Table 114: South Korea Pediatric Wheelchair Industry Volume (K Unit) Forecast, by Application 2019 & 2032
- Table 115: Rest of Asia Pacific Pediatric Wheelchair Industry Revenue (Million) Forecast, by Application 2019 & 2032
- Table 116: Rest of Asia Pacific Pediatric Wheelchair Industry Volume (K Unit) Forecast, by Application 2019 & 2032
- Table 117: Global Pediatric Wheelchair Industry Revenue Million Forecast, by Product Type 2019 & 2032
- Table 118: Global Pediatric Wheelchair Industry Volume K Unit Forecast, by Product Type 2019 & 2032
- Table 119: Global Pediatric Wheelchair Industry Revenue Million Forecast, by Frame Type 2019 & 2032
- Table 120: Global Pediatric Wheelchair Industry Volume K Unit Forecast, by Frame Type 2019 & 2032
- Table 121: Global Pediatric Wheelchair Industry Revenue Million Forecast, by End User 2019 & 2032
- Table 122: Global Pediatric Wheelchair Industry Volume K Unit Forecast, by End User 2019 & 2032
- Table 123: Global Pediatric Wheelchair Industry Revenue Million Forecast, by Country 2019 & 2032
- Table 124: Global Pediatric Wheelchair Industry Volume K Unit Forecast, by Country 2019 & 2032
- Table 125: GCC Pediatric Wheelchair Industry Revenue (Million) Forecast, by Application 2019 & 2032
- Table 126: GCC Pediatric Wheelchair Industry Volume (K Unit) Forecast, by Application 2019 & 2032
- Table 127: South Africa Pediatric Wheelchair Industry Revenue (Million) Forecast, by Application 2019 & 2032
- Table 128: South Africa Pediatric Wheelchair Industry Volume (K Unit) Forecast, by Application 2019 & 2032
- Table 129: Rest of Middle East and Africa Pediatric Wheelchair Industry Revenue (Million) Forecast, by Application 2019 & 2032
- Table 130: Rest of Middle East and Africa Pediatric Wheelchair Industry Volume (K Unit) Forecast, by Application 2019 & 2032
- Table 131: Global Pediatric Wheelchair Industry Revenue Million Forecast, by Product Type 2019 & 2032
- Table 132: Global Pediatric Wheelchair Industry Volume K Unit Forecast, by Product Type 2019 & 2032
- Table 133: Global Pediatric Wheelchair Industry Revenue Million Forecast, by Frame Type 2019 & 2032
- Table 134: Global Pediatric Wheelchair Industry Volume K Unit Forecast, by Frame Type 2019 & 2032
- Table 135: Global Pediatric Wheelchair Industry Revenue Million Forecast, by End User 2019 & 2032
- Table 136: Global Pediatric Wheelchair Industry Volume K Unit Forecast, by End User 2019 & 2032
- Table 137: Global Pediatric Wheelchair Industry Revenue Million Forecast, by Country 2019 & 2032
- Table 138: Global Pediatric Wheelchair Industry Volume K Unit Forecast, by Country 2019 & 2032
- Table 139: Brazil Pediatric Wheelchair Industry Revenue (Million) Forecast, by Application 2019 & 2032
- Table 140: Brazil Pediatric Wheelchair Industry Volume (K Unit) Forecast, by Application 2019 & 2032
- Table 141: Argentina Pediatric Wheelchair Industry Revenue (Million) Forecast, by Application 2019 & 2032
- Table 142: Argentina Pediatric Wheelchair Industry Volume (K Unit) Forecast, by Application 2019 & 2032
- Table 143: Rest of South America Pediatric Wheelchair Industry Revenue (Million) Forecast, by Application 2019 & 2032
- Table 144: Rest of South America Pediatric Wheelchair Industry Volume (K Unit) Forecast, by Application 2019 & 2032
Frequently Asked Questions
1. What is the projected Compound Annual Growth Rate (CAGR) of the Pediatric Wheelchair Industry?
The projected CAGR is approximately 5.30%.
2. Which companies are prominent players in the Pediatric Wheelchair Industry?
Key companies in the market include Invacare, MEYRA GmbH, Momentum Healthcare, AKCES-MED sp z o o, Medline, SORG Rollstuhltechnik GmbH, Ottobock, Permobil, Sunrise Medical.
3. What are the main segments of the Pediatric Wheelchair Industry?
The market segments include Product Type, Frame Type, End User.
4. Can you provide details about the market size?
The market size is estimated to be USD XX Million as of 2022.
5. What are some drivers contributing to market growth?
Rising Incidences of Disabilities in Children; Supportive Government Policies and Funding.
6. What are the notable trends driving market growth?
Manual Wheelchairs Segment Dominates the Market and is Expected to do so in the Forecast Period.
7. Are there any restraints impacting market growth?
High Cost of Paediatric Wheelchairs.
8. Can you provide examples of recent developments in the market?
In September 2022, Mobility solution manufacturer Karma Medical launched a new pediatric wheelchair at Rehacare 2022 in Dusseldorf, Germany. The Flexx Adapt is a highly adjustable pediatric wheelchair that grows with the child to provide a safe, supportive, and comfortable wheelchair experience.
9. What pricing options are available for accessing the report?
Pricing options include single-user, multi-user, and enterprise licenses priced at USD 4750, USD 5250, and USD 8750 respectively.
10. Is the market size provided in terms of value or volume?
The market size is provided in terms of value, measured in Million and volume, measured in K Unit.
11. Are there any specific market keywords associated with the report?
Yes, the market keyword associated with the report is "Pediatric Wheelchair Industry," which aids in identifying and referencing the specific market segment covered.
12. How do I determine which pricing option suits my needs best?
The pricing options vary based on user requirements and access needs. Individual users may opt for single-user licenses, while businesses requiring broader access may choose multi-user or enterprise licenses for cost-effective access to the report.
13. Are there any additional resources or data provided in the Pediatric Wheelchair Industry report?
While the report offers comprehensive insights, it's advisable to review the specific contents or supplementary materials provided to ascertain if additional resources or data are available.
14. How can I stay updated on further developments or reports in the Pediatric Wheelchair Industry?
To stay informed about further developments, trends, and reports in the Pediatric Wheelchair Industry, consider subscribing to industry newsletters, following relevant companies and organizations, or regularly checking reputable industry news sources and publications.
Methodology
Step 1 - Identification of Relevant Samples Size from Population Database


Step 2 - Approaches for Defining Global Market Size (Value, Volume* & Price*)

Note*: In applicable scenarios
Step 3 - Data Sources
Primary Research
- Web Analytics
- Survey Reports
- Research Institute
- Latest Research Reports
- Opinion Leaders
Secondary Research
- Annual Reports
- White Paper
- Latest Press Release
- Industry Association
- Paid Database
- Investor Presentations

Step 4 - Data Triangulation
Involves using different sources of information in order to increase the validity of a study
These sources are likely to be stakeholders in a program - participants, other researchers, program staff, other community members, and so on.
Then we put all data in single framework & apply various statistical tools to find out the dynamic on the market.
During the analysis stage, feedback from the stakeholder groups would be compared to determine areas of agreement as well as areas of divergence
