

Key Insights
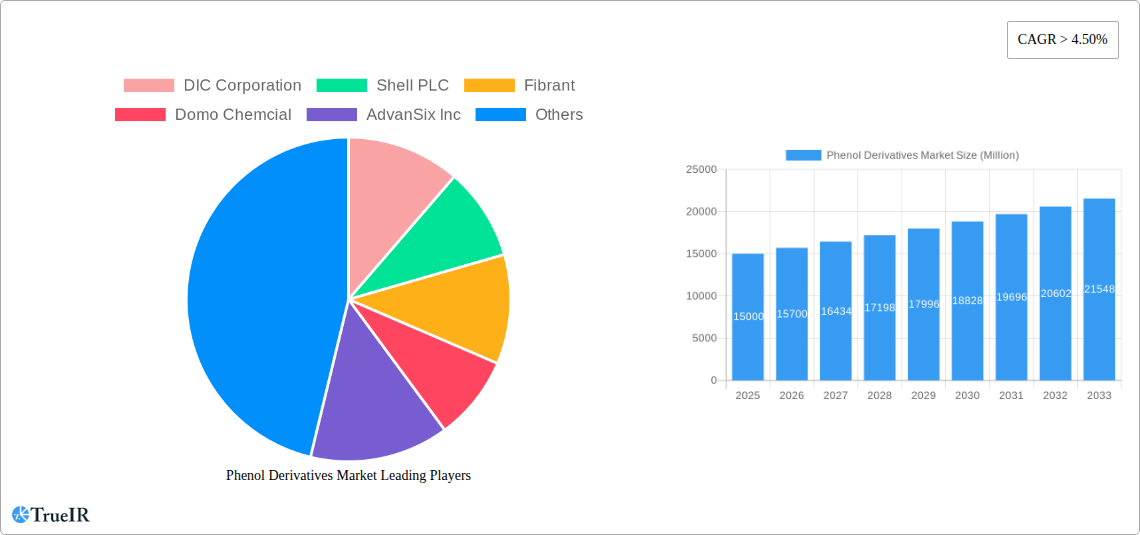
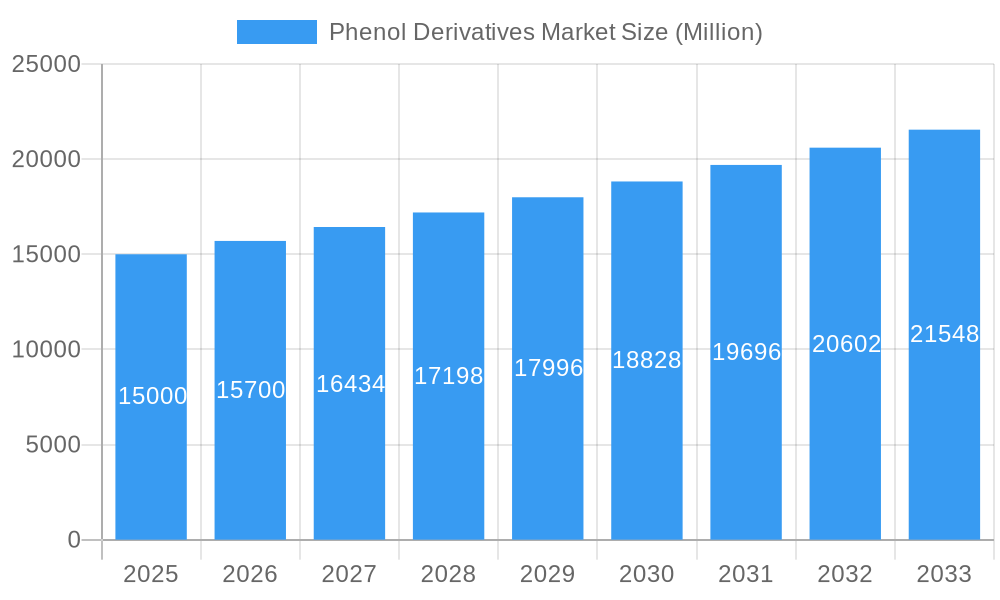
The Phenol Derivatives market is experiencing robust growth, projected to maintain a Compound Annual Growth Rate (CAGR) exceeding 4.50% from 2025 to 2033. This expansion is fueled by several key drivers. The increasing demand for bisphenol-A in the manufacturing of polycarbonate plastics for diverse applications, including automotive components, electronics, and construction materials, significantly contributes to market growth. Furthermore, the rising consumption of phenolic resins in the coatings and adhesives industries, coupled with the growing use of caprolactam and adipic acid in nylon production for textiles and packaging, fuels market expansion. Technological advancements leading to enhanced performance characteristics and sustainability initiatives within the chemical sector are further bolstering market prospects. Geographic growth is largely concentrated in the Asia-Pacific region, particularly in China and India, driven by robust industrialization and expanding manufacturing sectors. While the market faces challenges such as fluctuating raw material prices and stringent environmental regulations, the overall positive market outlook is sustained by continuous innovation and the expanding global demand for phenol derivative-based products.
Phenol Derivatives Market Market Size (In Billion)
Significant players like DIC Corporation, Shell PLC, and BASF SE are strategically investing in research and development to improve product quality, explore new applications, and enhance supply chain efficiency. This competitive landscape further drives market growth and ensures the availability of high-quality phenol derivatives. The market segmentation by derivatives – Bisphenol-A, Phenolic Resin, Caprolactam, Adipic Acid, and Others – offers valuable insights into specific product demand and market trends. Regional analysis highlights the dominance of the Asia-Pacific region, followed by North America and Europe. The forecast period of 2025-2033 promises continued expansion, driven by factors including global population growth, industrial development, and increasing disposable income levels across many regions. The market's future trajectory depends on maintaining a delicate balance between meeting growing demand and addressing environmental concerns through sustainable manufacturing practices.
Phenol Derivatives Market Company Market Share
Phenol Derivatives Market: A Comprehensive Analysis (2019-2033)
This dynamic report provides a detailed analysis of the Phenol Derivatives Market, offering invaluable insights for industry stakeholders, investors, and researchers. With a comprehensive study period spanning 2019-2033 (Base Year: 2025, Forecast Period: 2025-2033), this report leverages extensive market research to forecast future trends and opportunities. The report covers key segments, analyzes competitive landscapes, and identifies significant growth drivers and challenges shaping this evolving market. Discover crucial data on market size, CAGR, and penetration rates, empowering you to make informed business decisions.
Phenol Derivatives Market Structure & Competitive Landscape
The Phenol Derivatives market exhibits a moderately concentrated structure, with several multinational corporations holding significant market share. The Herfindahl-Hirschman Index (HHI) for the market is estimated at xx, indicating a competitive landscape with both large established players and smaller, more specialized firms. Innovation, particularly in sustainable and bio-based alternatives, is a key driver, influencing the competitive landscape. Stringent environmental regulations across several regions impose constraints on manufacturing processes, driving companies to invest in cleaner technologies. Product substitutes, such as alternative polymers and resins, present a challenge to traditional phenol derivatives. The market is segmented by end-user industries, including automotive, construction, electronics, and packaging, each with specific demand patterns and growth trajectories. M&A activity in the past five years has been moderate, with xx deals totaling an estimated value of xx Million. The majority of these deals involved smaller companies being acquired by larger players to expand their product portfolios or geographic reach.
- Market Concentration: Moderately concentrated, HHI estimated at xx.
- Innovation Drivers: Sustainable alternatives, improved performance characteristics.
- Regulatory Impacts: Stringent environmental regulations, driving adoption of cleaner technologies.
- Product Substitutes: Alternative polymers and resins impacting market share.
- End-User Segmentation: Automotive, construction, electronics, and packaging industries.
- M&A Trends: Moderate activity, xx deals in the past five years valued at approximately xx Million.
Phenol Derivatives Market Trends & Opportunities
The global Phenol Derivatives market is experiencing robust growth, with a projected CAGR of xx% during the forecast period (2025-2033). This growth is fueled by several factors including increasing demand from key end-use industries such as automotive, construction, and electronics. Technological advancements, particularly in the development of bio-based phenol derivatives, are opening new avenues for market expansion. Consumer preferences are shifting towards sustainable and eco-friendly products, creating opportunities for companies that can offer such solutions. The competitive landscape is characterized by both fierce competition among established players and the emergence of new entrants offering innovative solutions. Market penetration rates vary considerably across different regions and segments, with the highest penetration observed in developed economies. The increasing demand for high-performance materials, coupled with stringent environmental regulations, is further driving the development of advanced phenol derivatives with improved properties and reduced environmental impact.
Dominant Markets & Segments in Phenol Derivatives Market
The Asia-Pacific region is currently the dominant market for phenol derivatives, driven by robust industrial growth and increasing infrastructure development. China, India, and Southeast Asian countries are key growth drivers within this region.
- By Derivatives:
- Bisphenol-A: Strong demand from the polycarbonate industry is a key driver. The recent opening of a new production facility in Pune, India (August 2022) signifies a shift toward domestic manufacturing and reduced reliance on imports (1.35 lakh tons imported annually from the US and China).
- Phenolic Resin: Wide applications in construction, automotive, and electronics industries contribute to its consistent growth.
- Caprolactam: Demand is primarily driven by the nylon industry.
- Adipic Acid: Used extensively in the production of nylon 6,6, contributing to steady growth.
- Other Derivatives: This segment exhibits diverse growth patterns depending on specific applications.
Key Growth Drivers (Asia-Pacific):
- Rapid industrialization and urbanization.
- Growing construction and automotive sectors.
- Favorable government policies supporting manufacturing growth.
Phenol Derivatives Market Product Analysis
The phenol derivatives market is witnessing significant product innovation, with a focus on developing high-performance materials with improved properties such as enhanced strength, durability, and thermal stability. Technological advancements such as nanotechnology and bio-based feedstock are revolutionizing product applications, broadening their use in various industries. These innovations enhance market fit by providing solutions tailored to specific industry needs. The competitive advantage lies in the ability to provide sustainable, high-performance products at competitive prices.
Key Drivers, Barriers & Challenges in Phenol Derivatives Market
Key Drivers: Increasing demand from various end-use sectors, technological advancements leading to improved product performance, and supportive government policies in some regions are all key drivers. The shift towards sustainable manufacturing practices further propels market growth.
Challenges: Fluctuations in raw material prices, stringent environmental regulations, and intense competition among existing players pose significant challenges. Supply chain disruptions, particularly impacting the availability of raw materials, can also constrain market growth. These factors, coupled with the potential for substitution from alternative materials, present significant hurdles.
Growth Drivers in the Phenol Derivatives Market
Technological advancements, particularly in bio-based phenol derivatives, are a primary driver. The increasing demand from various end-use industries like automotive, construction, and electronics fuels market expansion. Supportive government policies that encourage sustainable manufacturing also contribute significantly.
Challenges Impacting Phenol Derivatives Market Growth
Price volatility in raw materials poses a substantial challenge. Stringent environmental regulations necessitate investment in cleaner production technologies, adding to operational costs. Intense competition from existing players and the threat of substitution from alternative materials further constrain market growth. Supply chain disruptions can significantly impact production and market availability.
Key Players Shaping the Phenol Derivatives Market
- DIC Corporation
- Shell PLC
- Fibrant
- Domo Chemical
- AdvanSix Inc
- Cepsa
- Altivia
- BASF SE
- INEOS Capital Ltd
- Fujian Yongrong Jinjiang Co Ltd
- PTT Phenol Company Limited
- Solvay SA
- Mitsubishi Chemical Corporation
- Mitsui Chemicals Inc
Significant Phenol Derivatives Market Industry Milestones
- August 2022: A new bisphenol-A production facility opened in Pune, India, significantly reducing the country's reliance on imports (1.35 lakh tons annually from the US and China). This highlights the shift toward domestic manufacturing in key growth regions.
- June 2022: INEOS Phenol launched its first bio-attributed product line (INVIRIDIS) for phenol, acetone, and alpha-methylstyrene in Gladbeck, Germany, and Antwerp, Belgium. This demonstrates the industry's commitment to sustainable alternatives and the growing demand for eco-friendly products.
Future Outlook for Phenol Derivatives Market
The Phenol Derivatives market is poised for continued growth, driven by technological innovation, increasing demand from key end-use sectors, and a growing focus on sustainability. Strategic partnerships, mergers and acquisitions, and expansion into new geographical markets represent significant opportunities. The market is expected to witness further consolidation among key players as companies seek to enhance their market share and expand their product portfolios. The overall market outlook is positive, with substantial growth potential in the coming years.
Phenol Derivatives Market Segmentation
-
1. Derivatives
- 1.1. Bisphenol-A
- 1.2. Phenolic Resin
- 1.3. Caprolactam
- 1.4. Adipic Acid
- 1.5. Other Derivatives
Phenol Derivatives Market Segmentation By Geography
-
1. Asia Pacific
- 1.1. China
- 1.2. India
- 1.3. Japan
- 1.4. South Korea
- 1.5. Rest of Asia Pacific
-
2. North America
- 2.1. United States
- 2.2. Canada
- 2.3. Mexico
-
3. Europe
- 3.1. Germany
- 3.2. France
- 3.3. United Kingdom
- 3.4. Italy
- 3.5. Rest of the Europe
-
4. South America
- 4.1. Brazil
- 4.2. Argentina
- 4.3. Rest of South America
-
5. Middle East and Africa
- 5.1. Saudi Arabia
- 5.2. South Africa
- 5.3. Rest of Middle East and Africa
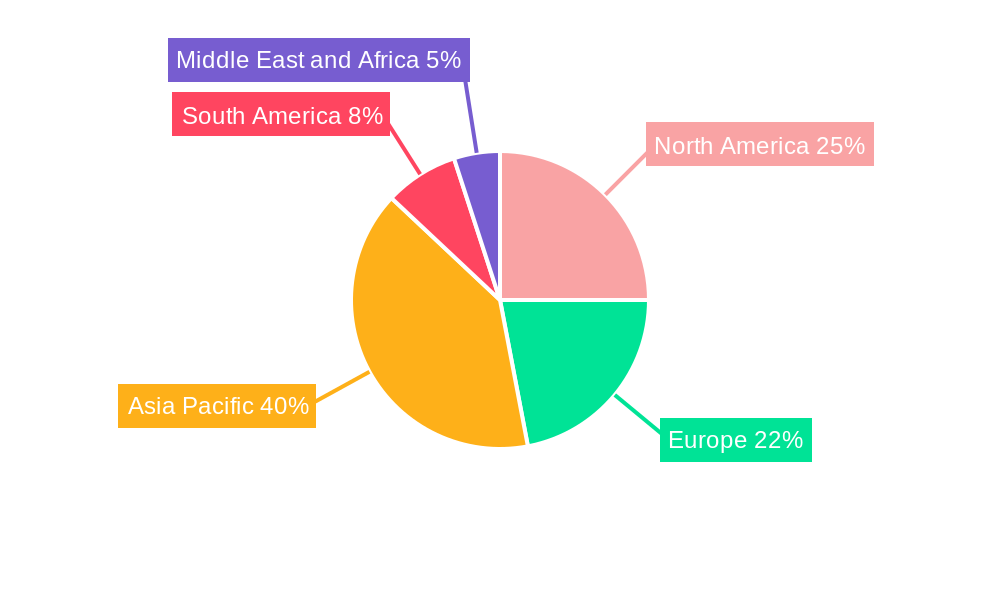
Phenol Derivatives Market Regional Market Share
Geographic Coverage of Phenol Derivatives Market
Phenol Derivatives Market REPORT HIGHLIGHTS
| Aspects | Details |
|---|---|
| Study Period | 2020-2034 |
| Base Year | 2025 |
| Estimated Year | 2026 |
| Forecast Period | 2026-2034 |
| Historical Period | 2020-2025 |
| Growth Rate | CAGR of 4.3% from 2020-2034 |
| Segmentation |
|
Table of Contents
- 1. Introduction
- 1.1. Research Scope
- 1.2. Market Segmentation
- 1.3. Research Objective
- 1.4. Definitions and Assumptions
- 2. Executive Summary
- 2.1. Market Snapshot
- 3. Market Dynamics
- 3.1. Market Drivers
- 3.2. Market Restrains
- 3.3. Market Trends
- 3.4. Market Opportunities
- 4. Market Factor Analysis
- 4.1. Porters Five Forces
- 4.1.1. Bargaining Power of Suppliers
- 4.1.2. Bargaining Power of Buyers
- 4.1.3. Threat of New Entrants
- 4.1.4. Threat of Substitutes
- 4.1.5. Competitive Rivalry
- 4.2. PESTEL analysis
- 4.3. BCG Analysis
- 4.3.1. Stars (High Growth, High Market Share)
- 4.3.2. Cash Cows (Low Growth, High Market Share)
- 4.3.3. Question Mark (High Growth, Low Market Share)
- 4.3.4. Dogs (Low Growth, Low Market Share)
- 4.4. Ansoff Matrix Analysis
- 4.5. Supply Chain Analysis
- 4.6. Regulatory Landscape
- 4.7. Current Market Potential and Opportunity Assessment (TAM–SAM–SOM Framework)
- 4.8. TIR Analyst Note
- 4.1. Porters Five Forces
- 5. Market Analysis, Insights and Forecast 2021-2033
- 5.1. Market Analysis, Insights and Forecast - by Derivatives
- 5.1.1. Bisphenol-A
- 5.1.2. Phenolic Resin
- 5.1.3. Caprolactam
- 5.1.4. Adipic Acid
- 5.1.5. Other Derivatives
- 5.2. Market Analysis, Insights and Forecast - by Region
- 5.2.1. Asia Pacific
- 5.2.2. North America
- 5.2.3. Europe
- 5.2.4. South America
- 5.2.5. Middle East and Africa
- 5.1. Market Analysis, Insights and Forecast - by Derivatives
- 6. Global Phenol Derivatives Market Analysis, Insights and Forecast, 2021-2033
- 6.1. Market Analysis, Insights and Forecast - by Derivatives
- 6.1.1. Bisphenol-A
- 6.1.2. Phenolic Resin
- 6.1.3. Caprolactam
- 6.1.4. Adipic Acid
- 6.1.5. Other Derivatives
- 6.1. Market Analysis, Insights and Forecast - by Derivatives
- 7. Asia Pacific Phenol Derivatives Market Analysis, Insights and Forecast, 2020-2032
- 7.1. Market Analysis, Insights and Forecast - by Derivatives
- 7.1.1. Bisphenol-A
- 7.1.2. Phenolic Resin
- 7.1.3. Caprolactam
- 7.1.4. Adipic Acid
- 7.1.5. Other Derivatives
- 7.1. Market Analysis, Insights and Forecast - by Derivatives
- 8. North America Phenol Derivatives Market Analysis, Insights and Forecast, 2020-2032
- 8.1. Market Analysis, Insights and Forecast - by Derivatives
- 8.1.1. Bisphenol-A
- 8.1.2. Phenolic Resin
- 8.1.3. Caprolactam
- 8.1.4. Adipic Acid
- 8.1.5. Other Derivatives
- 8.1. Market Analysis, Insights and Forecast - by Derivatives
- 9. Europe Phenol Derivatives Market Analysis, Insights and Forecast, 2020-2032
- 9.1. Market Analysis, Insights and Forecast - by Derivatives
- 9.1.1. Bisphenol-A
- 9.1.2. Phenolic Resin
- 9.1.3. Caprolactam
- 9.1.4. Adipic Acid
- 9.1.5. Other Derivatives
- 9.1. Market Analysis, Insights and Forecast - by Derivatives
- 10. South America Phenol Derivatives Market Analysis, Insights and Forecast, 2020-2032
- 10.1. Market Analysis, Insights and Forecast - by Derivatives
- 10.1.1. Bisphenol-A
- 10.1.2. Phenolic Resin
- 10.1.3. Caprolactam
- 10.1.4. Adipic Acid
- 10.1.5. Other Derivatives
- 10.1. Market Analysis, Insights and Forecast - by Derivatives
- 11. Middle East and Africa Phenol Derivatives Market Analysis, Insights and Forecast, 2020-2032
- 11.1. Market Analysis, Insights and Forecast - by Derivatives
- 11.1.1. Bisphenol-A
- 11.1.2. Phenolic Resin
- 11.1.3. Caprolactam
- 11.1.4. Adipic Acid
- 11.1.5. Other Derivatives
- 11.1. Market Analysis, Insights and Forecast - by Derivatives
- 12. Competitive Analysis
- 12.1. Company Profiles
- 12.1.1 DIC Corporation
- 12.1.1.1. Company Overview
- 12.1.1.2. Products
- 12.1.1.3. Company Financials
- 12.1.1.4. SWOT Analysis
- 12.1.2 Shell PLC
- 12.1.2.1. Company Overview
- 12.1.2.2. Products
- 12.1.2.3. Company Financials
- 12.1.2.4. SWOT Analysis
- 12.1.3 Fibrant
- 12.1.3.1. Company Overview
- 12.1.3.2. Products
- 12.1.3.3. Company Financials
- 12.1.3.4. SWOT Analysis
- 12.1.4 Domo Chemcial
- 12.1.4.1. Company Overview
- 12.1.4.2. Products
- 12.1.4.3. Company Financials
- 12.1.4.4. SWOT Analysis
- 12.1.5 AdvanSix Inc
- 12.1.5.1. Company Overview
- 12.1.5.2. Products
- 12.1.5.3. Company Financials
- 12.1.5.4. SWOT Analysis
- 12.1.6 Cepsa
- 12.1.6.1. Company Overview
- 12.1.6.2. Products
- 12.1.6.3. Company Financials
- 12.1.6.4. SWOT Analysis
- 12.1.7 Altivia
- 12.1.7.1. Company Overview
- 12.1.7.2. Products
- 12.1.7.3. Company Financials
- 12.1.7.4. SWOT Analysis
- 12.1.8 BASF SE
- 12.1.8.1. Company Overview
- 12.1.8.2. Products
- 12.1.8.3. Company Financials
- 12.1.8.4. SWOT Analysis
- 12.1.9 INEOS Capital Ltd
- 12.1.9.1. Company Overview
- 12.1.9.2. Products
- 12.1.9.3. Company Financials
- 12.1.9.4. SWOT Analysis
- 12.1.10 Fujian Yongrong Jinjiang Co Ltd
- 12.1.10.1. Company Overview
- 12.1.10.2. Products
- 12.1.10.3. Company Financials
- 12.1.10.4. SWOT Analysis
- 12.1.11 PTT Phenol Company Limited
- 12.1.11.1. Company Overview
- 12.1.11.2. Products
- 12.1.11.3. Company Financials
- 12.1.11.4. SWOT Analysis
- 12.1.12 Solvay SA*List Not Exhaustive
- 12.1.12.1. Company Overview
- 12.1.12.2. Products
- 12.1.12.3. Company Financials
- 12.1.12.4. SWOT Analysis
- 12.1.13 Mitsubishi Chemcial Corporation
- 12.1.13.1. Company Overview
- 12.1.13.2. Products
- 12.1.13.3. Company Financials
- 12.1.13.4. SWOT Analysis
- 12.1.14 Mitsui Chemcials Inc
- 12.1.14.1. Company Overview
- 12.1.14.2. Products
- 12.1.14.3. Company Financials
- 12.1.14.4. SWOT Analysis
- 12.1.1 DIC Corporation
- 12.2. Market Entropy
- 12.2.1 Company's Key Areas Served
- 12.2.2 Recent Developments
- 12.3. Company Market Share Analysis 2025
- 12.3.1 Top 5 Companies Market Share Analysis
- 12.3.2 Top 3 Companies Market Share Analysis
- 12.4. List of Potential Customers
- 13. Research Methodology
List of Figures
- Figure 1: Global Phenol Derivatives Market Revenue Breakdown (billion, %) by Region 2025 & 2033
- Figure 2: Asia Pacific Phenol Derivatives Market Revenue (billion), by Derivatives 2025 & 2033
- Figure 3: Asia Pacific Phenol Derivatives Market Revenue Share (%), by Derivatives 2025 & 2033
- Figure 4: Asia Pacific Phenol Derivatives Market Revenue (billion), by Country 2025 & 2033
- Figure 5: Asia Pacific Phenol Derivatives Market Revenue Share (%), by Country 2025 & 2033
- Figure 6: North America Phenol Derivatives Market Revenue (billion), by Derivatives 2025 & 2033
- Figure 7: North America Phenol Derivatives Market Revenue Share (%), by Derivatives 2025 & 2033
- Figure 8: North America Phenol Derivatives Market Revenue (billion), by Country 2025 & 2033
- Figure 9: North America Phenol Derivatives Market Revenue Share (%), by Country 2025 & 2033
- Figure 10: Europe Phenol Derivatives Market Revenue (billion), by Derivatives 2025 & 2033
- Figure 11: Europe Phenol Derivatives Market Revenue Share (%), by Derivatives 2025 & 2033
- Figure 12: Europe Phenol Derivatives Market Revenue (billion), by Country 2025 & 2033
- Figure 13: Europe Phenol Derivatives Market Revenue Share (%), by Country 2025 & 2033
- Figure 14: South America Phenol Derivatives Market Revenue (billion), by Derivatives 2025 & 2033
- Figure 15: South America Phenol Derivatives Market Revenue Share (%), by Derivatives 2025 & 2033
- Figure 16: South America Phenol Derivatives Market Revenue (billion), by Country 2025 & 2033
- Figure 17: South America Phenol Derivatives Market Revenue Share (%), by Country 2025 & 2033
- Figure 18: Middle East and Africa Phenol Derivatives Market Revenue (billion), by Derivatives 2025 & 2033
- Figure 19: Middle East and Africa Phenol Derivatives Market Revenue Share (%), by Derivatives 2025 & 2033
- Figure 20: Middle East and Africa Phenol Derivatives Market Revenue (billion), by Country 2025 & 2033
- Figure 21: Middle East and Africa Phenol Derivatives Market Revenue Share (%), by Country 2025 & 2033
List of Tables
- Table 1: Global Phenol Derivatives Market Revenue billion Forecast, by Derivatives 2020 & 2033
- Table 2: Global Phenol Derivatives Market Revenue billion Forecast, by Region 2020 & 2033
- Table 3: Global Phenol Derivatives Market Revenue billion Forecast, by Derivatives 2020 & 2033
- Table 4: Global Phenol Derivatives Market Revenue billion Forecast, by Country 2020 & 2033
- Table 5: China Phenol Derivatives Market Revenue (billion) Forecast, by Application 2020 & 2033
- Table 6: India Phenol Derivatives Market Revenue (billion) Forecast, by Application 2020 & 2033
- Table 7: Japan Phenol Derivatives Market Revenue (billion) Forecast, by Application 2020 & 2033
- Table 8: South Korea Phenol Derivatives Market Revenue (billion) Forecast, by Application 2020 & 2033
- Table 9: Rest of Asia Pacific Phenol Derivatives Market Revenue (billion) Forecast, by Application 2020 & 2033
- Table 10: Global Phenol Derivatives Market Revenue billion Forecast, by Derivatives 2020 & 2033
- Table 11: Global Phenol Derivatives Market Revenue billion Forecast, by Country 2020 & 2033
- Table 12: United States Phenol Derivatives Market Revenue (billion) Forecast, by Application 2020 & 2033
- Table 13: Canada Phenol Derivatives Market Revenue (billion) Forecast, by Application 2020 & 2033
- Table 14: Mexico Phenol Derivatives Market Revenue (billion) Forecast, by Application 2020 & 2033
- Table 15: Global Phenol Derivatives Market Revenue billion Forecast, by Derivatives 2020 & 2033
- Table 16: Global Phenol Derivatives Market Revenue billion Forecast, by Country 2020 & 2033
- Table 17: Germany Phenol Derivatives Market Revenue (billion) Forecast, by Application 2020 & 2033
- Table 18: France Phenol Derivatives Market Revenue (billion) Forecast, by Application 2020 & 2033
- Table 19: United Kingdom Phenol Derivatives Market Revenue (billion) Forecast, by Application 2020 & 2033
- Table 20: Italy Phenol Derivatives Market Revenue (billion) Forecast, by Application 2020 & 2033
- Table 21: Rest of the Europe Phenol Derivatives Market Revenue (billion) Forecast, by Application 2020 & 2033
- Table 22: Global Phenol Derivatives Market Revenue billion Forecast, by Derivatives 2020 & 2033
- Table 23: Global Phenol Derivatives Market Revenue billion Forecast, by Country 2020 & 2033
- Table 24: Brazil Phenol Derivatives Market Revenue (billion) Forecast, by Application 2020 & 2033
- Table 25: Argentina Phenol Derivatives Market Revenue (billion) Forecast, by Application 2020 & 2033
- Table 26: Rest of South America Phenol Derivatives Market Revenue (billion) Forecast, by Application 2020 & 2033
- Table 27: Global Phenol Derivatives Market Revenue billion Forecast, by Derivatives 2020 & 2033
- Table 28: Global Phenol Derivatives Market Revenue billion Forecast, by Country 2020 & 2033
- Table 29: Saudi Arabia Phenol Derivatives Market Revenue (billion) Forecast, by Application 2020 & 2033
- Table 30: South Africa Phenol Derivatives Market Revenue (billion) Forecast, by Application 2020 & 2033
- Table 31: Rest of Middle East and Africa Phenol Derivatives Market Revenue (billion) Forecast, by Application 2020 & 2033
Frequently Asked Questions
1. What is the projected Compound Annual Growth Rate (CAGR) of the Phenol Derivatives Market?
The projected CAGR is approximately 4.3%.
2. Which companies are prominent players in the Phenol Derivatives Market?
Key companies in the market include DIC Corporation, Shell PLC, Fibrant, Domo Chemcial, AdvanSix Inc, Cepsa, Altivia, BASF SE, INEOS Capital Ltd, Fujian Yongrong Jinjiang Co Ltd, PTT Phenol Company Limited, Solvay SA*List Not Exhaustive, Mitsubishi Chemcial Corporation, Mitsui Chemcials Inc.
3. What are the main segments of the Phenol Derivatives Market?
The market segments include Derivatives.
4. Can you provide details about the market size?
The market size is estimated to be USD 13.3 billion as of 2022.
5. What are some drivers contributing to market growth?
Growing Demand from the Pharmaceutical Industry; Increasing Use of Phenol Derivatives in the Production of Agrochemicals. Dyes. and Other Specialty Chemicals..
6. What are the notable trends driving market growth?
Soaring Demand for Phenolic Resin.
7. Are there any restraints impacting market growth?
Stringent Environmental Regulations; Volatility in Raw Material Prices.
8. Can you provide examples of recent developments in the market?
August 2022: A new bisphenol-A production facility was opened in Pune, India. This facility will reduce imports of bisphenol-A to India by promoting domestic manufacturing. 1.35 lakh tons of bisphenol-A are imported into India from the United States and China.
9. What pricing options are available for accessing the report?
Pricing options include single-user, multi-user, and enterprise licenses priced at USD 4750, USD 5250, and USD 8750 respectively.
10. Is the market size provided in terms of value or volume?
The market size is provided in terms of value, measured in billion.
11. Are there any specific market keywords associated with the report?
Yes, the market keyword associated with the report is "Phenol Derivatives Market," which aids in identifying and referencing the specific market segment covered.
12. How do I determine which pricing option suits my needs best?
The pricing options vary based on user requirements and access needs. Individual users may opt for single-user licenses, while businesses requiring broader access may choose multi-user or enterprise licenses for cost-effective access to the report.
13. Are there any additional resources or data provided in the Phenol Derivatives Market report?
While the report offers comprehensive insights, it's advisable to review the specific contents or supplementary materials provided to ascertain if additional resources or data are available.
14. How can I stay updated on further developments or reports in the Phenol Derivatives Market?
To stay informed about further developments, trends, and reports in the Phenol Derivatives Market, consider subscribing to industry newsletters, following relevant companies and organizations, or regularly checking reputable industry news sources and publications.
Methodology
Step 1 - Identification of Relevant Samples Size from Population Database


Step 2 - Approaches for Defining Global Market Size (Value, Volume* & Price*)

Note*: In applicable scenarios
Step 3 - Data Sources
Primary Research
- Web Analytics
- Survey Reports
- Research Institute
- Latest Research Reports
- Opinion Leaders
Secondary Research
- Annual Reports
- White Paper
- Latest Press Release
- Industry Association
- Paid Database
- Investor Presentations

Step 4 - Data Triangulation
Involves using different sources of information in order to increase the validity of a study
These sources are likely to be stakeholders in a program - participants, other researchers, program staff, other community members, and so on.
Then we put all data in single framework & apply various statistical tools to find out the dynamic on the market.
During the analysis stage, feedback from the stakeholder groups would be compared to determine areas of agreement as well as areas of divergence