

Key Insights
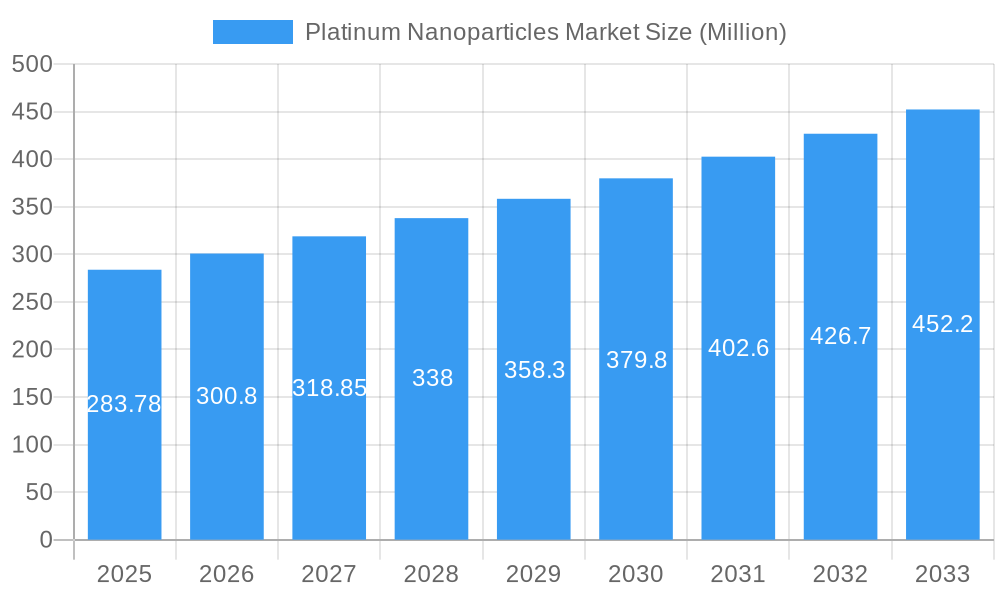
The global Platinum Nanoparticles market, valued at $283.78 million in 2025, is projected to experience robust growth, driven by increasing demand across diverse sectors. A Compound Annual Growth Rate (CAGR) of 6% from 2025 to 2033 indicates a significant market expansion. Key drivers include the rising adoption of platinum nanoparticles in catalytic converters within the automotive industry, their increasing use in targeted drug delivery systems within healthcare, and their application in advanced chemical processes requiring high-performance catalysts. Emerging trends such as nanotechnology advancements leading to improved particle synthesis and functionalization methods are further fueling market growth. While challenges like high production costs and potential environmental and health concerns related to nanoparticle handling exist, these are being mitigated by ongoing research and development efforts focusing on sustainable and safer production techniques. The market is segmented by product type (spherical, cube, square, and others) and end-user industry (automotive, healthcare, chemical, and others). North America currently holds a significant market share, owing to established research infrastructure and early adoption of nanotechnology. However, Asia-Pacific is poised for substantial growth due to its rapidly expanding industrial base and increasing investments in nanotechnology research. The competitive landscape includes key players like US Research Nanomaterials Inc., Nanoshel LLC, and Sigma-Aldrich, among others, constantly innovating to maintain a strong market presence.
Platinum Nanoparticles Market Market Size (In Million)
The forecast period (2025-2033) anticipates sustained growth, with the market likely exceeding $450 million by 2033. This growth will be fueled by ongoing technological advancements, expanding applications in emerging fields like electronics and energy, and increased regulatory support for the safe development and use of nanomaterials. The market's regional distribution will likely see a shift towards Asia-Pacific as its manufacturing and technology sectors continue their expansion. Further segmentation within the product and end-user categories is expected as customized nanoparticle solutions cater to the specific requirements of various industries. Competition among market players will intensify, driven by innovation, partnerships, and mergers and acquisitions to enhance market share and product portfolios.
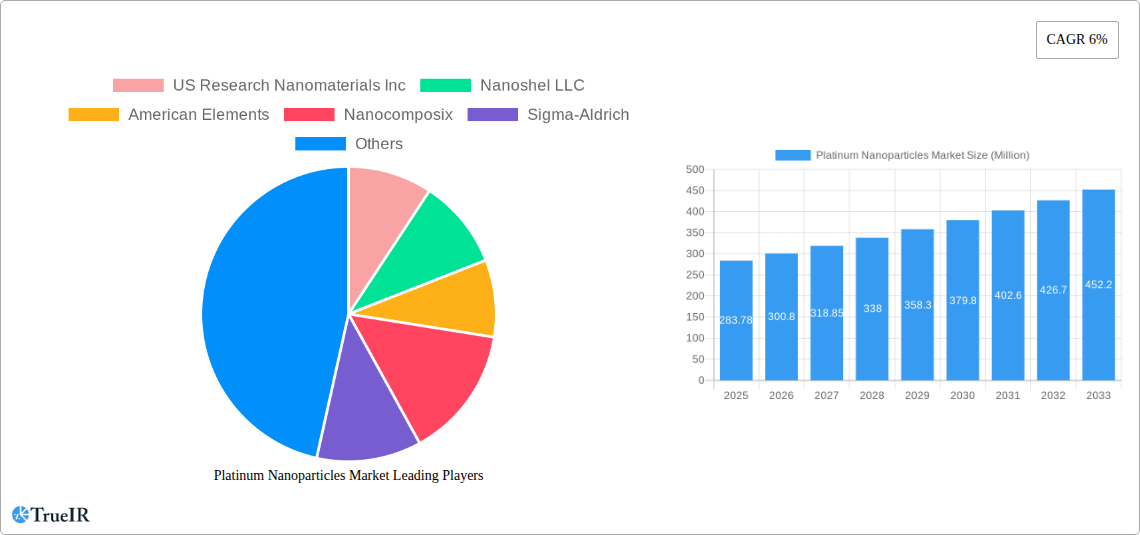
Platinum Nanoparticles Market Company Market Share
Platinum Nanoparticles Market: A Comprehensive Report (2019-2033)
This dynamic report provides a detailed analysis of the Platinum Nanoparticles Market, offering invaluable insights for stakeholders seeking to navigate this rapidly evolving landscape. Covering the period from 2019 to 2033, with a focus on 2025, this comprehensive study examines market structure, competitive dynamics, dominant segments, and future growth prospects. The report leverages extensive data analysis and expert insights to provide a clear and actionable understanding of this crucial market. The global market size is estimated at xx Million in 2025 and is projected to reach xx Million by 2033, exhibiting a CAGR of xx%.
Platinum Nanoparticles Market Market Structure & Competitive Landscape
The Platinum Nanoparticles market exhibits a moderately concentrated structure, with key players vying for market share through product innovation and strategic partnerships. The Herfindahl-Hirschman Index (HHI) is estimated at xx, indicating a moderately competitive landscape. Innovation is a key driver, with companies focusing on developing nanoparticles with enhanced properties for specific applications. Regulatory frameworks, particularly concerning the safety and handling of nanomaterials, significantly impact market growth. Product substitutes, such as other precious metal nanoparticles or alternative materials, present competitive challenges. The market is segmented by product type (spherical, cube, square, others) and end-user industry (automotive, healthcare, chemical, others). M&A activity has been moderate, with xx major transactions recorded between 2019 and 2024, primarily focused on expanding product portfolios and geographical reach. Further, the market is influenced by factors like increasing demand from the healthcare sector and stringent environmental regulations.
Platinum Nanoparticles Market Market Trends & Opportunities
The Platinum Nanoparticles market is experiencing significant growth driven by escalating demand across diverse sectors. The market size is projected to reach xx Million by 2033, driven by a CAGR of xx%. Technological advancements, particularly in synthesis and characterization techniques, are leading to the development of nanoparticles with enhanced properties, such as improved catalytic activity, biocompatibility, and stability. Consumer preferences are shifting towards sustainable and environmentally friendly materials, creating opportunities for platinum nanoparticles in applications such as green chemistry and pollution control. The competitive landscape is dynamic, with companies focusing on differentiation through product innovation, cost optimization, and strategic partnerships. Market penetration rates are highest in the healthcare and automotive sectors, with significant growth potential in emerging applications such as electronics and energy. The market faces challenges including price volatility of platinum and stringent regulatory requirements.
Dominant Markets & Segments in Platinum Nanoparticles Market
The healthcare sector is the dominant end-user industry for platinum nanoparticles, accounting for approximately xx% of the market in 2025. This is driven by the increasing use of platinum nanoparticles in drug delivery, diagnostics, and medical imaging. The spherical shape dominates the product segment, holding approximately xx% of market share owing to its ease of production and versatility.
- Key Growth Drivers in Healthcare: Growing prevalence of chronic diseases, rising demand for advanced diagnostics and therapeutics, and increasing investment in nanotechnology research.
- Key Growth Drivers in Automotive: Increasing demand for emission control catalysts and fuel-efficient vehicles.
Geographically, North America holds the largest market share, followed by Europe and Asia-Pacific. Rapid industrialization and increasing disposable incomes in emerging economies are fueling market growth in Asia-Pacific. Government initiatives promoting nanotechnology research and development are also contributing to market expansion in this region.
Platinum Nanoparticles Market Product Analysis
Platinum nanoparticles are available in various shapes and sizes, each offering unique properties for different applications. Spherical nanoparticles are commonly used due to their ease of synthesis and uniform size distribution. Cube and square-shaped nanoparticles exhibit unique optical and catalytic properties, finding applications in specialized areas. Technological advancements have led to improved control over nanoparticle size, shape, and surface functionalization, enhancing their performance in specific applications. The competitive advantage lies in developing highly specialized nanoparticles tailored to the needs of individual industries, optimizing cost and performance.
Key Drivers, Barriers & Challenges in Platinum Nanoparticles Market
Key Drivers:
- Increasing demand from healthcare and automotive sectors.
- Technological advancements in synthesis and functionalization.
- Growing investments in nanotechnology research and development.
Key Challenges:
- High cost of platinum and its price volatility.
- Stringent regulatory requirements for nanomaterials.
- Potential health and environmental risks associated with nanoparticles. The cost of compliance with these regulations represents a significant barrier for smaller companies, reducing market entry and competition.
Growth Drivers in the Platinum Nanoparticles Market Market
The Platinum Nanoparticles market is propelled by several key drivers, including the increasing adoption of nanotechnology in various sectors, continuous R&D leading to innovative applications, and supportive government policies promoting nanomaterial research and development. The demand for higher performance materials in sectors like electronics and automotive is further fueling market growth. Furthermore, the growing demand for advanced drug delivery systems and diagnostic tools in the healthcare sector strongly contributes to the market expansion.
Challenges Impacting Platinum Nanoparticles Market Growth
Challenges hindering the market's growth include the high cost of platinum, stringent regulatory approvals impacting production and market entry, and concerns about the potential toxicity and environmental impact of nanoparticles. Supply chain disruptions can further exacerbate these challenges and impact market stability. Competitive pressures from alternative materials also present a notable barrier to growth.
Key Players Shaping the Platinum Nanoparticles Market Market
- US Research Nanomaterials Inc
- Nanoshel LLC
- American Elements
- Nanocomposix
- Sigma-Aldrich
- NanoBio Chemicals India Pvt Ltd
- TANAKA HOLDINGS Co Ltd
- Nanostructured & Amorphous Materials Inc
- Metrohm India Limited
- HiQ-Nano s r l
- Strem Chemicals Inc
- PlasmaChem GmbH
- Meliorum Technologies Inc
- Particular GMBH
- NANOCHEMAZONE
Significant Platinum Nanoparticles Market Industry Milestones
- 2021: Nanocomposix launched a new line of highly functionalized platinum nanoparticles.
- 2022: Sigma-Aldrich expanded its platinum nanoparticle product portfolio.
- 2023: A significant merger between two key players resulted in a consolidation of market share. (Specific details unavailable, using xx as placeholder)
- 2024: New regulatory guidelines were implemented regarding the safe handling and disposal of platinum nanoparticles.
Future Outlook for Platinum Nanoparticles Market Market
The Platinum Nanoparticles market is poised for continued growth, driven by ongoing technological advancements and expanding applications across diverse industries. Strategic partnerships and collaborations between research institutions and commercial entities are expected to accelerate product innovation and market penetration. The focus on sustainability and environmental responsibility will create opportunities for the development of green synthesis methods and environmentally benign applications. Further research into the long-term health and environmental impacts of platinum nanoparticles will be crucial for ensuring responsible market development.
Platinum Nanoparticles Market Segmentation
-
1. Product
- 1.1. Spherical
- 1.2. Cube
- 1.3. Square
- 1.4. Others
-
2. End-user Industry
- 2.1. Automotive
- 2.2. Health Care
- 2.3. Chemical
- 2.4. Others
Platinum Nanoparticles Market Segmentation By Geography
-
1. Asia Pacific
- 1.1. China
- 1.2. India
- 1.3. Japan
- 1.4. South Korea
- 1.5. Rest of Asia Pacific
-
2. North America
- 2.1. United States
- 2.2. Canada
- 2.3. Mexico
-
3. Europe
- 3.1. Germany
- 3.2. United Kingdom
- 3.3. France
- 3.4. Italy
- 3.5. Rest of Europe
-
4. South America
- 4.1. Brazil
- 4.2. Argentina
- 4.3. Rest of South America
-
5. Middle East and Africa
- 5.1. Saudi Arabia
- 5.2. South Africa
- 5.3. Rest of Middle East and Africa
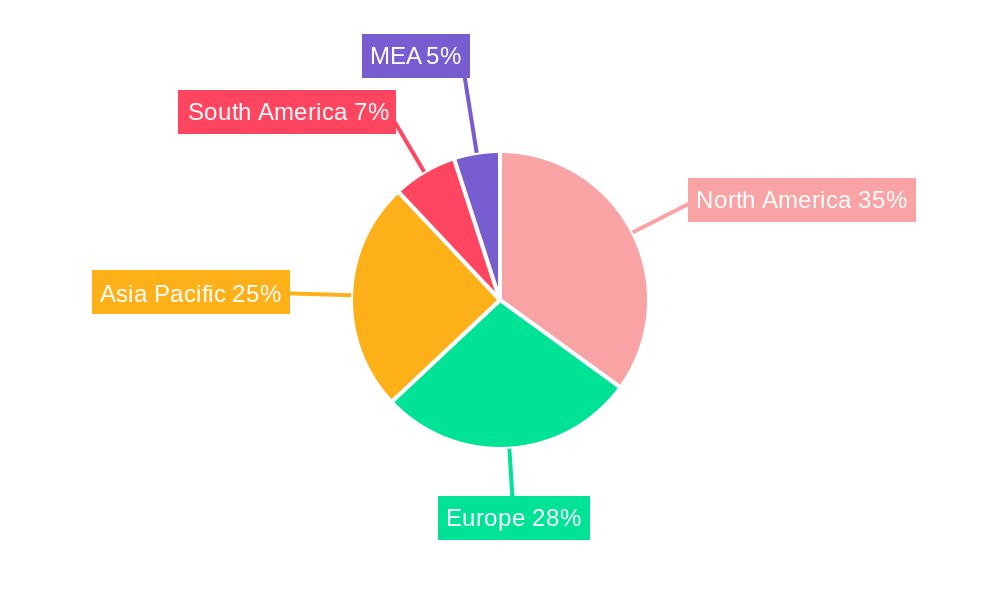
Platinum Nanoparticles Market Regional Market Share
Geographic Coverage of Platinum Nanoparticles Market
Platinum Nanoparticles Market REPORT HIGHLIGHTS
| Aspects | Details |
|---|---|
| Study Period | 2020-2034 |
| Base Year | 2025 |
| Estimated Year | 2026 |
| Forecast Period | 2026-2034 |
| Historical Period | 2020-2025 |
| Growth Rate | CAGR of 6% from 2020-2034 |
| Segmentation |
|
Table of Contents
- 1. Introduction
- 1.1. Research Scope
- 1.2. Market Segmentation
- 1.3. Research Objective
- 1.4. Definitions and Assumptions
- 2. Executive Summary
- 2.1. Market Snapshot
- 3. Market Dynamics
- 3.1. Market Drivers
- 3.2. Market Restrains
- 3.3. Market Trends
- 3.4. Market Opportunities
- 4. Market Factor Analysis
- 4.1. Porters Five Forces
- 4.1.1. Bargaining Power of Suppliers
- 4.1.2. Bargaining Power of Buyers
- 4.1.3. Threat of New Entrants
- 4.1.4. Threat of Substitutes
- 4.1.5. Competitive Rivalry
- 4.2. PESTEL analysis
- 4.3. BCG Analysis
- 4.3.1. Stars (High Growth, High Market Share)
- 4.3.2. Cash Cows (Low Growth, High Market Share)
- 4.3.3. Question Mark (High Growth, Low Market Share)
- 4.3.4. Dogs (Low Growth, Low Market Share)
- 4.4. Ansoff Matrix Analysis
- 4.5. Supply Chain Analysis
- 4.6. Regulatory Landscape
- 4.7. Current Market Potential and Opportunity Assessment (TAM–SAM–SOM Framework)
- 4.8. TIR Analyst Note
- 4.1. Porters Five Forces
- 5. Market Analysis, Insights and Forecast 2021-2033
- 5.1. Market Analysis, Insights and Forecast - by Product
- 5.1.1. Spherical
- 5.1.2. Cube
- 5.1.3. Square
- 5.1.4. Others
- 5.2. Market Analysis, Insights and Forecast - by End-user Industry
- 5.2.1. Automotive
- 5.2.2. Health Care
- 5.2.3. Chemical
- 5.2.4. Others
- 5.3. Market Analysis, Insights and Forecast - by Region
- 5.3.1. Asia Pacific
- 5.3.2. North America
- 5.3.3. Europe
- 5.3.4. South America
- 5.3.5. Middle East and Africa
- 5.1. Market Analysis, Insights and Forecast - by Product
- 6. Global Platinum Nanoparticles Market Analysis, Insights and Forecast, 2021-2033
- 6.1. Market Analysis, Insights and Forecast - by Product
- 6.1.1. Spherical
- 6.1.2. Cube
- 6.1.3. Square
- 6.1.4. Others
- 6.2. Market Analysis, Insights and Forecast - by End-user Industry
- 6.2.1. Automotive
- 6.2.2. Health Care
- 6.2.3. Chemical
- 6.2.4. Others
- 6.1. Market Analysis, Insights and Forecast - by Product
- 7. Asia Pacific Platinum Nanoparticles Market Analysis, Insights and Forecast, 2020-2032
- 7.1. Market Analysis, Insights and Forecast - by Product
- 7.1.1. Spherical
- 7.1.2. Cube
- 7.1.3. Square
- 7.1.4. Others
- 7.2. Market Analysis, Insights and Forecast - by End-user Industry
- 7.2.1. Automotive
- 7.2.2. Health Care
- 7.2.3. Chemical
- 7.2.4. Others
- 7.1. Market Analysis, Insights and Forecast - by Product
- 8. North America Platinum Nanoparticles Market Analysis, Insights and Forecast, 2020-2032
- 8.1. Market Analysis, Insights and Forecast - by Product
- 8.1.1. Spherical
- 8.1.2. Cube
- 8.1.3. Square
- 8.1.4. Others
- 8.2. Market Analysis, Insights and Forecast - by End-user Industry
- 8.2.1. Automotive
- 8.2.2. Health Care
- 8.2.3. Chemical
- 8.2.4. Others
- 8.1. Market Analysis, Insights and Forecast - by Product
- 9. Europe Platinum Nanoparticles Market Analysis, Insights and Forecast, 2020-2032
- 9.1. Market Analysis, Insights and Forecast - by Product
- 9.1.1. Spherical
- 9.1.2. Cube
- 9.1.3. Square
- 9.1.4. Others
- 9.2. Market Analysis, Insights and Forecast - by End-user Industry
- 9.2.1. Automotive
- 9.2.2. Health Care
- 9.2.3. Chemical
- 9.2.4. Others
- 9.1. Market Analysis, Insights and Forecast - by Product
- 10. South America Platinum Nanoparticles Market Analysis, Insights and Forecast, 2020-2032
- 10.1. Market Analysis, Insights and Forecast - by Product
- 10.1.1. Spherical
- 10.1.2. Cube
- 10.1.3. Square
- 10.1.4. Others
- 10.2. Market Analysis, Insights and Forecast - by End-user Industry
- 10.2.1. Automotive
- 10.2.2. Health Care
- 10.2.3. Chemical
- 10.2.4. Others
- 10.1. Market Analysis, Insights and Forecast - by Product
- 11. Middle East and Africa Platinum Nanoparticles Market Analysis, Insights and Forecast, 2020-2032
- 11.1. Market Analysis, Insights and Forecast - by Product
- 11.1.1. Spherical
- 11.1.2. Cube
- 11.1.3. Square
- 11.1.4. Others
- 11.2. Market Analysis, Insights and Forecast - by End-user Industry
- 11.2.1. Automotive
- 11.2.2. Health Care
- 11.2.3. Chemical
- 11.2.4. Others
- 11.1. Market Analysis, Insights and Forecast - by Product
- 12. Competitive Analysis
- 12.1. Company Profiles
- 12.1.1 US Research Nanomaterials Inc
- 12.1.1.1. Company Overview
- 12.1.1.2. Products
- 12.1.1.3. Company Financials
- 12.1.1.4. SWOT Analysis
- 12.1.2 Nanoshel LLC
- 12.1.2.1. Company Overview
- 12.1.2.2. Products
- 12.1.2.3. Company Financials
- 12.1.2.4. SWOT Analysis
- 12.1.3 American Elements
- 12.1.3.1. Company Overview
- 12.1.3.2. Products
- 12.1.3.3. Company Financials
- 12.1.3.4. SWOT Analysis
- 12.1.4 Nanocomposix
- 12.1.4.1. Company Overview
- 12.1.4.2. Products
- 12.1.4.3. Company Financials
- 12.1.4.4. SWOT Analysis
- 12.1.5 Sigma-Aldrich
- 12.1.5.1. Company Overview
- 12.1.5.2. Products
- 12.1.5.3. Company Financials
- 12.1.5.4. SWOT Analysis
- 12.1.6 NanoBio Chemicals India Pvt Ltd
- 12.1.6.1. Company Overview
- 12.1.6.2. Products
- 12.1.6.3. Company Financials
- 12.1.6.4. SWOT Analysis
- 12.1.7 TANAKA HOLDINGS Co Ltd
- 12.1.7.1. Company Overview
- 12.1.7.2. Products
- 12.1.7.3. Company Financials
- 12.1.7.4. SWOT Analysis
- 12.1.8 Nanostructured & Amorphous Materials Inc
- 12.1.8.1. Company Overview
- 12.1.8.2. Products
- 12.1.8.3. Company Financials
- 12.1.8.4. SWOT Analysis
- 12.1.9 Metrohm India Limited
- 12.1.9.1. Company Overview
- 12.1.9.2. Products
- 12.1.9.3. Company Financials
- 12.1.9.4. SWOT Analysis
- 12.1.10 HiQ-Nano s r l
- 12.1.10.1. Company Overview
- 12.1.10.2. Products
- 12.1.10.3. Company Financials
- 12.1.10.4. SWOT Analysis
- 12.1.11 Strem Chemicals Inc
- 12.1.11.1. Company Overview
- 12.1.11.2. Products
- 12.1.11.3. Company Financials
- 12.1.11.4. SWOT Analysis
- 12.1.12 PlasmaChem GmbH
- 12.1.12.1. Company Overview
- 12.1.12.2. Products
- 12.1.12.3. Company Financials
- 12.1.12.4. SWOT Analysis
- 12.1.13 Meliorum Technologies Inc
- 12.1.13.1. Company Overview
- 12.1.13.2. Products
- 12.1.13.3. Company Financials
- 12.1.13.4. SWOT Analysis
- 12.1.14 Particular GMBH
- 12.1.14.1. Company Overview
- 12.1.14.2. Products
- 12.1.14.3. Company Financials
- 12.1.14.4. SWOT Analysis
- 12.1.15 NANOCHEMAZONE
- 12.1.15.1. Company Overview
- 12.1.15.2. Products
- 12.1.15.3. Company Financials
- 12.1.15.4. SWOT Analysis
- 12.1.1 US Research Nanomaterials Inc
- 12.2. Market Entropy
- 12.2.1 Company's Key Areas Served
- 12.2.2 Recent Developments
- 12.3. Company Market Share Analysis 2025
- 12.3.1 Top 5 Companies Market Share Analysis
- 12.3.2 Top 3 Companies Market Share Analysis
- 12.4. List of Potential Customers
- 13. Research Methodology
List of Figures
- Figure 1: Global Platinum Nanoparticles Market Revenue Breakdown (Million, %) by Region 2025 & 2033
- Figure 2: Global Platinum Nanoparticles Market Volume Breakdown (K Tons, %) by Region 2025 & 2033
- Figure 3: Asia Pacific Platinum Nanoparticles Market Revenue (Million), by Product 2025 & 2033
- Figure 4: Asia Pacific Platinum Nanoparticles Market Volume (K Tons), by Product 2025 & 2033
- Figure 5: Asia Pacific Platinum Nanoparticles Market Revenue Share (%), by Product 2025 & 2033
- Figure 6: Asia Pacific Platinum Nanoparticles Market Volume Share (%), by Product 2025 & 2033
- Figure 7: Asia Pacific Platinum Nanoparticles Market Revenue (Million), by End-user Industry 2025 & 2033
- Figure 8: Asia Pacific Platinum Nanoparticles Market Volume (K Tons), by End-user Industry 2025 & 2033
- Figure 9: Asia Pacific Platinum Nanoparticles Market Revenue Share (%), by End-user Industry 2025 & 2033
- Figure 10: Asia Pacific Platinum Nanoparticles Market Volume Share (%), by End-user Industry 2025 & 2033
- Figure 11: Asia Pacific Platinum Nanoparticles Market Revenue (Million), by Country 2025 & 2033
- Figure 12: Asia Pacific Platinum Nanoparticles Market Volume (K Tons), by Country 2025 & 2033
- Figure 13: Asia Pacific Platinum Nanoparticles Market Revenue Share (%), by Country 2025 & 2033
- Figure 14: Asia Pacific Platinum Nanoparticles Market Volume Share (%), by Country 2025 & 2033
- Figure 15: North America Platinum Nanoparticles Market Revenue (Million), by Product 2025 & 2033
- Figure 16: North America Platinum Nanoparticles Market Volume (K Tons), by Product 2025 & 2033
- Figure 17: North America Platinum Nanoparticles Market Revenue Share (%), by Product 2025 & 2033
- Figure 18: North America Platinum Nanoparticles Market Volume Share (%), by Product 2025 & 2033
- Figure 19: North America Platinum Nanoparticles Market Revenue (Million), by End-user Industry 2025 & 2033
- Figure 20: North America Platinum Nanoparticles Market Volume (K Tons), by End-user Industry 2025 & 2033
- Figure 21: North America Platinum Nanoparticles Market Revenue Share (%), by End-user Industry 2025 & 2033
- Figure 22: North America Platinum Nanoparticles Market Volume Share (%), by End-user Industry 2025 & 2033
- Figure 23: North America Platinum Nanoparticles Market Revenue (Million), by Country 2025 & 2033
- Figure 24: North America Platinum Nanoparticles Market Volume (K Tons), by Country 2025 & 2033
- Figure 25: North America Platinum Nanoparticles Market Revenue Share (%), by Country 2025 & 2033
- Figure 26: North America Platinum Nanoparticles Market Volume Share (%), by Country 2025 & 2033
- Figure 27: Europe Platinum Nanoparticles Market Revenue (Million), by Product 2025 & 2033
- Figure 28: Europe Platinum Nanoparticles Market Volume (K Tons), by Product 2025 & 2033
- Figure 29: Europe Platinum Nanoparticles Market Revenue Share (%), by Product 2025 & 2033
- Figure 30: Europe Platinum Nanoparticles Market Volume Share (%), by Product 2025 & 2033
- Figure 31: Europe Platinum Nanoparticles Market Revenue (Million), by End-user Industry 2025 & 2033
- Figure 32: Europe Platinum Nanoparticles Market Volume (K Tons), by End-user Industry 2025 & 2033
- Figure 33: Europe Platinum Nanoparticles Market Revenue Share (%), by End-user Industry 2025 & 2033
- Figure 34: Europe Platinum Nanoparticles Market Volume Share (%), by End-user Industry 2025 & 2033
- Figure 35: Europe Platinum Nanoparticles Market Revenue (Million), by Country 2025 & 2033
- Figure 36: Europe Platinum Nanoparticles Market Volume (K Tons), by Country 2025 & 2033
- Figure 37: Europe Platinum Nanoparticles Market Revenue Share (%), by Country 2025 & 2033
- Figure 38: Europe Platinum Nanoparticles Market Volume Share (%), by Country 2025 & 2033
- Figure 39: South America Platinum Nanoparticles Market Revenue (Million), by Product 2025 & 2033
- Figure 40: South America Platinum Nanoparticles Market Volume (K Tons), by Product 2025 & 2033
- Figure 41: South America Platinum Nanoparticles Market Revenue Share (%), by Product 2025 & 2033
- Figure 42: South America Platinum Nanoparticles Market Volume Share (%), by Product 2025 & 2033
- Figure 43: South America Platinum Nanoparticles Market Revenue (Million), by End-user Industry 2025 & 2033
- Figure 44: South America Platinum Nanoparticles Market Volume (K Tons), by End-user Industry 2025 & 2033
- Figure 45: South America Platinum Nanoparticles Market Revenue Share (%), by End-user Industry 2025 & 2033
- Figure 46: South America Platinum Nanoparticles Market Volume Share (%), by End-user Industry 2025 & 2033
- Figure 47: South America Platinum Nanoparticles Market Revenue (Million), by Country 2025 & 2033
- Figure 48: South America Platinum Nanoparticles Market Volume (K Tons), by Country 2025 & 2033
- Figure 49: South America Platinum Nanoparticles Market Revenue Share (%), by Country 2025 & 2033
- Figure 50: South America Platinum Nanoparticles Market Volume Share (%), by Country 2025 & 2033
- Figure 51: Middle East and Africa Platinum Nanoparticles Market Revenue (Million), by Product 2025 & 2033
- Figure 52: Middle East and Africa Platinum Nanoparticles Market Volume (K Tons), by Product 2025 & 2033
- Figure 53: Middle East and Africa Platinum Nanoparticles Market Revenue Share (%), by Product 2025 & 2033
- Figure 54: Middle East and Africa Platinum Nanoparticles Market Volume Share (%), by Product 2025 & 2033
- Figure 55: Middle East and Africa Platinum Nanoparticles Market Revenue (Million), by End-user Industry 2025 & 2033
- Figure 56: Middle East and Africa Platinum Nanoparticles Market Volume (K Tons), by End-user Industry 2025 & 2033
- Figure 57: Middle East and Africa Platinum Nanoparticles Market Revenue Share (%), by End-user Industry 2025 & 2033
- Figure 58: Middle East and Africa Platinum Nanoparticles Market Volume Share (%), by End-user Industry 2025 & 2033
- Figure 59: Middle East and Africa Platinum Nanoparticles Market Revenue (Million), by Country 2025 & 2033
- Figure 60: Middle East and Africa Platinum Nanoparticles Market Volume (K Tons), by Country 2025 & 2033
- Figure 61: Middle East and Africa Platinum Nanoparticles Market Revenue Share (%), by Country 2025 & 2033
- Figure 62: Middle East and Africa Platinum Nanoparticles Market Volume Share (%), by Country 2025 & 2033
List of Tables
- Table 1: Global Platinum Nanoparticles Market Revenue Million Forecast, by Product 2020 & 2033
- Table 2: Global Platinum Nanoparticles Market Volume K Tons Forecast, by Product 2020 & 2033
- Table 3: Global Platinum Nanoparticles Market Revenue Million Forecast, by End-user Industry 2020 & 2033
- Table 4: Global Platinum Nanoparticles Market Volume K Tons Forecast, by End-user Industry 2020 & 2033
- Table 5: Global Platinum Nanoparticles Market Revenue Million Forecast, by Region 2020 & 2033
- Table 6: Global Platinum Nanoparticles Market Volume K Tons Forecast, by Region 2020 & 2033
- Table 7: Global Platinum Nanoparticles Market Revenue Million Forecast, by Product 2020 & 2033
- Table 8: Global Platinum Nanoparticles Market Volume K Tons Forecast, by Product 2020 & 2033
- Table 9: Global Platinum Nanoparticles Market Revenue Million Forecast, by End-user Industry 2020 & 2033
- Table 10: Global Platinum Nanoparticles Market Volume K Tons Forecast, by End-user Industry 2020 & 2033
- Table 11: Global Platinum Nanoparticles Market Revenue Million Forecast, by Country 2020 & 2033
- Table 12: Global Platinum Nanoparticles Market Volume K Tons Forecast, by Country 2020 & 2033
- Table 13: China Platinum Nanoparticles Market Revenue (Million) Forecast, by Application 2020 & 2033
- Table 14: China Platinum Nanoparticles Market Volume (K Tons) Forecast, by Application 2020 & 2033
- Table 15: India Platinum Nanoparticles Market Revenue (Million) Forecast, by Application 2020 & 2033
- Table 16: India Platinum Nanoparticles Market Volume (K Tons) Forecast, by Application 2020 & 2033
- Table 17: Japan Platinum Nanoparticles Market Revenue (Million) Forecast, by Application 2020 & 2033
- Table 18: Japan Platinum Nanoparticles Market Volume (K Tons) Forecast, by Application 2020 & 2033
- Table 19: South Korea Platinum Nanoparticles Market Revenue (Million) Forecast, by Application 2020 & 2033
- Table 20: South Korea Platinum Nanoparticles Market Volume (K Tons) Forecast, by Application 2020 & 2033
- Table 21: Rest of Asia Pacific Platinum Nanoparticles Market Revenue (Million) Forecast, by Application 2020 & 2033
- Table 22: Rest of Asia Pacific Platinum Nanoparticles Market Volume (K Tons) Forecast, by Application 2020 & 2033
- Table 23: Global Platinum Nanoparticles Market Revenue Million Forecast, by Product 2020 & 2033
- Table 24: Global Platinum Nanoparticles Market Volume K Tons Forecast, by Product 2020 & 2033
- Table 25: Global Platinum Nanoparticles Market Revenue Million Forecast, by End-user Industry 2020 & 2033
- Table 26: Global Platinum Nanoparticles Market Volume K Tons Forecast, by End-user Industry 2020 & 2033
- Table 27: Global Platinum Nanoparticles Market Revenue Million Forecast, by Country 2020 & 2033
- Table 28: Global Platinum Nanoparticles Market Volume K Tons Forecast, by Country 2020 & 2033
- Table 29: United States Platinum Nanoparticles Market Revenue (Million) Forecast, by Application 2020 & 2033
- Table 30: United States Platinum Nanoparticles Market Volume (K Tons) Forecast, by Application 2020 & 2033
- Table 31: Canada Platinum Nanoparticles Market Revenue (Million) Forecast, by Application 2020 & 2033
- Table 32: Canada Platinum Nanoparticles Market Volume (K Tons) Forecast, by Application 2020 & 2033
- Table 33: Mexico Platinum Nanoparticles Market Revenue (Million) Forecast, by Application 2020 & 2033
- Table 34: Mexico Platinum Nanoparticles Market Volume (K Tons) Forecast, by Application 2020 & 2033
- Table 35: Global Platinum Nanoparticles Market Revenue Million Forecast, by Product 2020 & 2033
- Table 36: Global Platinum Nanoparticles Market Volume K Tons Forecast, by Product 2020 & 2033
- Table 37: Global Platinum Nanoparticles Market Revenue Million Forecast, by End-user Industry 2020 & 2033
- Table 38: Global Platinum Nanoparticles Market Volume K Tons Forecast, by End-user Industry 2020 & 2033
- Table 39: Global Platinum Nanoparticles Market Revenue Million Forecast, by Country 2020 & 2033
- Table 40: Global Platinum Nanoparticles Market Volume K Tons Forecast, by Country 2020 & 2033
- Table 41: Germany Platinum Nanoparticles Market Revenue (Million) Forecast, by Application 2020 & 2033
- Table 42: Germany Platinum Nanoparticles Market Volume (K Tons) Forecast, by Application 2020 & 2033
- Table 43: United Kingdom Platinum Nanoparticles Market Revenue (Million) Forecast, by Application 2020 & 2033
- Table 44: United Kingdom Platinum Nanoparticles Market Volume (K Tons) Forecast, by Application 2020 & 2033
- Table 45: France Platinum Nanoparticles Market Revenue (Million) Forecast, by Application 2020 & 2033
- Table 46: France Platinum Nanoparticles Market Volume (K Tons) Forecast, by Application 2020 & 2033
- Table 47: Italy Platinum Nanoparticles Market Revenue (Million) Forecast, by Application 2020 & 2033
- Table 48: Italy Platinum Nanoparticles Market Volume (K Tons) Forecast, by Application 2020 & 2033
- Table 49: Rest of Europe Platinum Nanoparticles Market Revenue (Million) Forecast, by Application 2020 & 2033
- Table 50: Rest of Europe Platinum Nanoparticles Market Volume (K Tons) Forecast, by Application 2020 & 2033
- Table 51: Global Platinum Nanoparticles Market Revenue Million Forecast, by Product 2020 & 2033
- Table 52: Global Platinum Nanoparticles Market Volume K Tons Forecast, by Product 2020 & 2033
- Table 53: Global Platinum Nanoparticles Market Revenue Million Forecast, by End-user Industry 2020 & 2033
- Table 54: Global Platinum Nanoparticles Market Volume K Tons Forecast, by End-user Industry 2020 & 2033
- Table 55: Global Platinum Nanoparticles Market Revenue Million Forecast, by Country 2020 & 2033
- Table 56: Global Platinum Nanoparticles Market Volume K Tons Forecast, by Country 2020 & 2033
- Table 57: Brazil Platinum Nanoparticles Market Revenue (Million) Forecast, by Application 2020 & 2033
- Table 58: Brazil Platinum Nanoparticles Market Volume (K Tons) Forecast, by Application 2020 & 2033
- Table 59: Argentina Platinum Nanoparticles Market Revenue (Million) Forecast, by Application 2020 & 2033
- Table 60: Argentina Platinum Nanoparticles Market Volume (K Tons) Forecast, by Application 2020 & 2033
- Table 61: Rest of South America Platinum Nanoparticles Market Revenue (Million) Forecast, by Application 2020 & 2033
- Table 62: Rest of South America Platinum Nanoparticles Market Volume (K Tons) Forecast, by Application 2020 & 2033
- Table 63: Global Platinum Nanoparticles Market Revenue Million Forecast, by Product 2020 & 2033
- Table 64: Global Platinum Nanoparticles Market Volume K Tons Forecast, by Product 2020 & 2033
- Table 65: Global Platinum Nanoparticles Market Revenue Million Forecast, by End-user Industry 2020 & 2033
- Table 66: Global Platinum Nanoparticles Market Volume K Tons Forecast, by End-user Industry 2020 & 2033
- Table 67: Global Platinum Nanoparticles Market Revenue Million Forecast, by Country 2020 & 2033
- Table 68: Global Platinum Nanoparticles Market Volume K Tons Forecast, by Country 2020 & 2033
- Table 69: Saudi Arabia Platinum Nanoparticles Market Revenue (Million) Forecast, by Application 2020 & 2033
- Table 70: Saudi Arabia Platinum Nanoparticles Market Volume (K Tons) Forecast, by Application 2020 & 2033
- Table 71: South Africa Platinum Nanoparticles Market Revenue (Million) Forecast, by Application 2020 & 2033
- Table 72: South Africa Platinum Nanoparticles Market Volume (K Tons) Forecast, by Application 2020 & 2033
- Table 73: Rest of Middle East and Africa Platinum Nanoparticles Market Revenue (Million) Forecast, by Application 2020 & 2033
- Table 74: Rest of Middle East and Africa Platinum Nanoparticles Market Volume (K Tons) Forecast, by Application 2020 & 2033
Frequently Asked Questions
1. What is the projected Compound Annual Growth Rate (CAGR) of the Platinum Nanoparticles Market?
The projected CAGR is approximately 6%.
2. Which companies are prominent players in the Platinum Nanoparticles Market?
Key companies in the market include US Research Nanomaterials Inc, Nanoshel LLC, American Elements, Nanocomposix, Sigma-Aldrich, NanoBio Chemicals India Pvt Ltd, TANAKA HOLDINGS Co Ltd, Nanostructured & Amorphous Materials Inc, Metrohm India Limited, HiQ-Nano s r l, Strem Chemicals Inc, PlasmaChem GmbH, Meliorum Technologies Inc, Particular GMBH, NANOCHEMAZONE.
3. What are the main segments of the Platinum Nanoparticles Market?
The market segments include Product, End-user Industry.
4. Can you provide details about the market size?
The market size is estimated to be USD 283.78 Million as of 2022.
5. What are some drivers contributing to market growth?
; Growing Health Care Industry; Other Drivers.
6. What are the notable trends driving market growth?
Health Care Segment to Dominate the Market.
7. Are there any restraints impacting market growth?
; Toxic Nature of Platinum Nanoparticles; Unfavorable Conditions in Non-medical End-user Industries Arising Due to COVID-19 Outbreak.
8. Can you provide examples of recent developments in the market?
N/A
9. What pricing options are available for accessing the report?
Pricing options include single-user, multi-user, and enterprise licenses priced at USD 4750, USD 5250, and USD 8750 respectively.
10. Is the market size provided in terms of value or volume?
The market size is provided in terms of value, measured in Million and volume, measured in K Tons.
11. Are there any specific market keywords associated with the report?
Yes, the market keyword associated with the report is "Platinum Nanoparticles Market," which aids in identifying and referencing the specific market segment covered.
12. How do I determine which pricing option suits my needs best?
The pricing options vary based on user requirements and access needs. Individual users may opt for single-user licenses, while businesses requiring broader access may choose multi-user or enterprise licenses for cost-effective access to the report.
13. Are there any additional resources or data provided in the Platinum Nanoparticles Market report?
While the report offers comprehensive insights, it's advisable to review the specific contents or supplementary materials provided to ascertain if additional resources or data are available.
14. How can I stay updated on further developments or reports in the Platinum Nanoparticles Market?
To stay informed about further developments, trends, and reports in the Platinum Nanoparticles Market, consider subscribing to industry newsletters, following relevant companies and organizations, or regularly checking reputable industry news sources and publications.
Methodology
Step 1 - Identification of Relevant Samples Size from Population Database


Step 2 - Approaches for Defining Global Market Size (Value, Volume* & Price*)

Note*: In applicable scenarios
Step 3 - Data Sources
Primary Research
- Web Analytics
- Survey Reports
- Research Institute
- Latest Research Reports
- Opinion Leaders
Secondary Research
- Annual Reports
- White Paper
- Latest Press Release
- Industry Association
- Paid Database
- Investor Presentations

Step 4 - Data Triangulation
Involves using different sources of information in order to increase the validity of a study
These sources are likely to be stakeholders in a program - participants, other researchers, program staff, other community members, and so on.
Then we put all data in single framework & apply various statistical tools to find out the dynamic on the market.
During the analysis stage, feedback from the stakeholder groups would be compared to determine areas of agreement as well as areas of divergence