

Key Insights
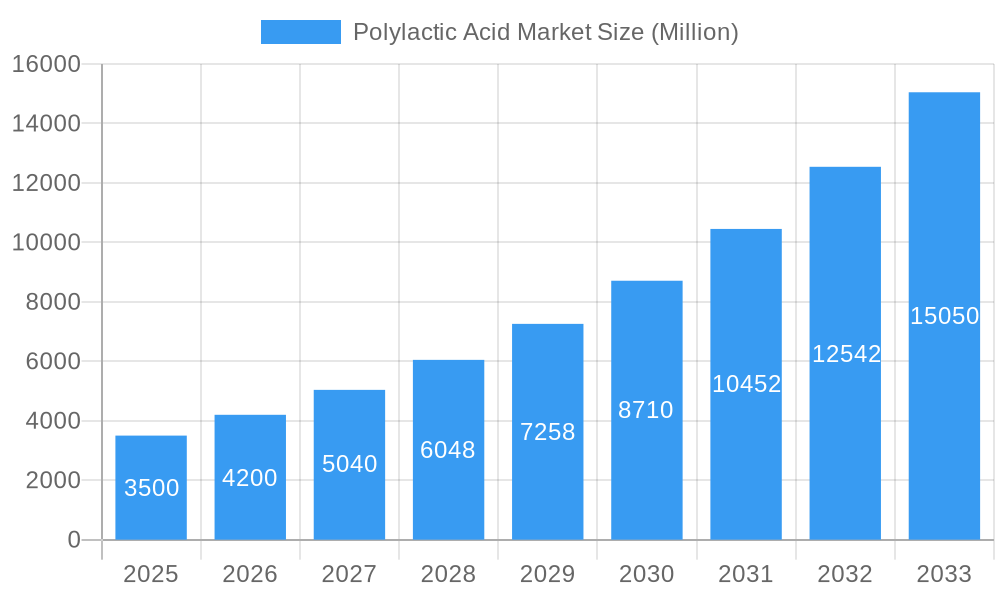
The Polylactic Acid (PLA) market is poised for significant expansion, driven by escalating demand across a spectrum of industries. Projected to reach $2.01 billion by 2025, the market demonstrates a robust Compound Annual Growth Rate (CAGR) of 17.5%. Key growth catalysts include the increasing adoption of sustainable, bio-based, and biodegradable plastics, coupled with stringent environmental regulations targeting conventional petroleum-based polymers. Heightened environmental consciousness among consumers and businesses further fuels this trend. The packaging sector represents a dominant market segment, with medical applications benefiting from PLA's biocompatible nature. Emerging uses in electronics, agriculture (such as mulch films), and textiles also contribute to market growth. Primary feedstocks include corn, cassava, and sugarcane, with ongoing research focused on diversifying raw material sources to improve sustainability and reduce reliance on food crops. While challenges such as higher production costs compared to conventional plastics and limitations in high-temperature applications persist, technological advancements and economies of scale are steadily mitigating these concerns. Geographically, the Asia Pacific region is a key growth driver, propelled by industrialization and expanding manufacturing capacities, particularly in China and India. North America and Europe also present substantial market opportunities, supported by ongoing investments in PLA production and adoption. The competitive landscape is characterized by the presence of established leaders like NatureWorks LLC and BASF SE, alongside agile emerging players developing novel PLA formulations and applications.
Polylactic Acid Market Market Size (In Billion)
The outlook for the Polylactic Acid market remains highly favorable, anticipating substantial growth over the forecast period. Continuous innovation in PLA technology, leading to high-performance materials with enhanced properties, will be pivotal for market leadership. Strategic collaborations among raw material suppliers, PLA manufacturers, and end-users are crucial for building resilient supply chains and facilitating wider PLA adoption. Government incentives promoting bio-based materials and waste reduction initiatives are expected to further accelerate market expansion. Market segmentation by raw material, form, and end-user industry enables precise identification of opportunities and the development of tailored PLA solutions that meet specific application requirements.
Polylactic Acid Market Company Market Share
Polylactic Acid (PLA) Market Report: 2019-2033 - A Comprehensive Analysis
This comprehensive report provides an in-depth analysis of the global Polylactic Acid (PLA) market, covering the period from 2019 to 2033. It offers a detailed examination of market structure, competitive dynamics, growth drivers, challenges, and future outlook, incorporating crucial data and insights for industry stakeholders. This report leverages extensive research to provide actionable intelligence on market trends and opportunities within the rapidly expanding bioplastics sector.
Polylactic Acid Market Market Structure & Competitive Landscape
The global Polylactic Acid (PLA) market exhibits a moderately consolidated structure, with several key players dominating the landscape. Market concentration is assessed through concentration ratios (e.g., CR4, CR8), revealing the influence of major players. Innovation is a key driver, with companies continually developing advanced PLA formulations and applications. Stringent environmental regulations are shaping the market, promoting the adoption of biodegradable alternatives to traditional plastics. Product substitutes, such as other bioplastics (e.g., PHA) and conventional plastics, pose competitive challenges.
The market is segmented by various end-user industries, including packaging, medical, electronics, agriculture, and textiles, each with unique growth trajectories. Mergers and acquisitions (M&A) activity has played a significant role in shaping the market landscape, with a notable increase in M&A volume in recent years. For example, the xx Million in M&A deals between 2020 and 2024 illustrates this trend. Qualitative insights further explore specific M&A activities, their strategic rationale, and impact on market competition.
- Market Concentration: CR4 estimated at xx%, CR8 estimated at xx% (2024).
- Innovation Drivers: Focus on improved biodegradability, enhanced material properties, and novel applications.
- Regulatory Impacts: Increasingly stringent regulations on plastic waste management are driving PLA adoption.
- Product Substitutes: Competition from other bioplastics and traditional plastics impacts market share.
- End-User Segmentation: Packaging remains the largest segment, followed by medical and electronics applications.
- M&A Trends: Increasing consolidation through mergers and acquisitions, xx Million in M&A activity from 2020-2024.
Polylactic Acid Market Market Trends & Opportunities
The global PLA market is experiencing robust growth, driven by increasing consumer demand for sustainable and eco-friendly packaging solutions. The market size is projected to reach xx Million by 2033, exhibiting a CAGR of xx% during the forecast period (2025-2033). Technological advancements, particularly in PLA production processes and material formulations, are enhancing product performance and expanding application possibilities.
Consumer preferences are shifting towards environmentally conscious products, fueling the adoption of PLA in various sectors. Intensifying competition among producers is resulting in price reductions and improved product quality, making PLA increasingly attractive to businesses and consumers alike. This increasing competition also drives innovation, resulting in improved PLA products. Market penetration rate for PLA in the packaging industry is estimated at xx% in 2025 and is projected to grow to xx% by 2033.
Dominant Markets & Segments in Polylactic Acid Market
The Asia-Pacific region is currently the dominant market for PLA, driven by high population density, increasing disposable incomes, and supportive government policies promoting biodegradable materials. China is the leading country within this region, with significant production capacity and expanding domestic demand.
- Raw Materials: Corn is the most widely used raw material due to its cost-effectiveness and widespread availability. However, Sugarcane and Sugar Beet are gaining traction as sustainable alternatives.
- Form: Films and sheets are the most dominant form of PLA, used extensively in packaging. Fiber segment is growing rapidly driven by textiles and non-wovens applications.
- End-User Industry: Packaging is the leading end-user segment, fueled by growing demand for eco-friendly alternatives to traditional plastic packaging.
Key growth drivers for the Asia-Pacific region include:
- Expanding infrastructure supporting waste management and recycling initiatives.
- Government regulations and incentives encouraging the adoption of biodegradable plastics.
- Rising consumer awareness of environmental issues and preference for sustainable products.
Within the segments, packaging applications demonstrate the highest growth rates in value and volume, propelled by the increasing demand for eco-conscious solutions within various sectors. The medical segment offers strong prospects due to the biocompatible nature of PLA for medical implants and drug delivery systems.
Polylactic Acid Market Product Analysis
Recent product innovations in the PLA market focus on enhancing material properties such as strength, flexibility, and barrier properties. These improvements enable PLA to compete more effectively with traditional plastics in a wider range of applications. Technological advancements are centered around improving the production efficiency and reducing the manufacturing costs, allowing PLA to become more cost-competitive. The successful commercialization of new PLA grades with superior performance characteristics is driving market expansion.
Key Drivers, Barriers & Challenges in Polylactic Acid Market
Key Drivers: Growing demand for sustainable and biodegradable alternatives to conventional plastics, supportive government policies promoting bioplastics, and advancements in PLA production technology are propelling market growth. The rising awareness among consumers about the environmental impact of conventional plastics further increases demand for sustainable alternatives.
Challenges: High production costs compared to conventional plastics, limitations in material properties (e.g., heat resistance), and supply chain challenges related to raw material sourcing and production capacity are key restraints to market growth. The lack of standardized recycling infrastructure for PLA and inconsistent quality across various PLA grades pose further obstacles. The cost of PLA is estimated to be xx% higher than conventional plastics in 2025, representing a major challenge for market expansion.
Growth Drivers in the Polylactic Acid Market Market
The PLA market is propelled by rising environmental concerns and stringent regulations against conventional plastics. Government incentives and subsidies supporting bioplastic adoption are significantly boosting market growth. Technological advancements in PLA production and processing further contribute to its cost-competitiveness and enhanced performance. The growing consumer preference for sustainable products drives higher market demand.
Challenges Impacting Polylactic Acid Market Growth
High production costs for PLA remain a significant obstacle, limiting widespread adoption. The limited availability of suitable raw materials and dependence on agricultural crops can impact production stability and pricing. Competition from other bioplastics and conventional plastics poses a challenge to market share and profitability.
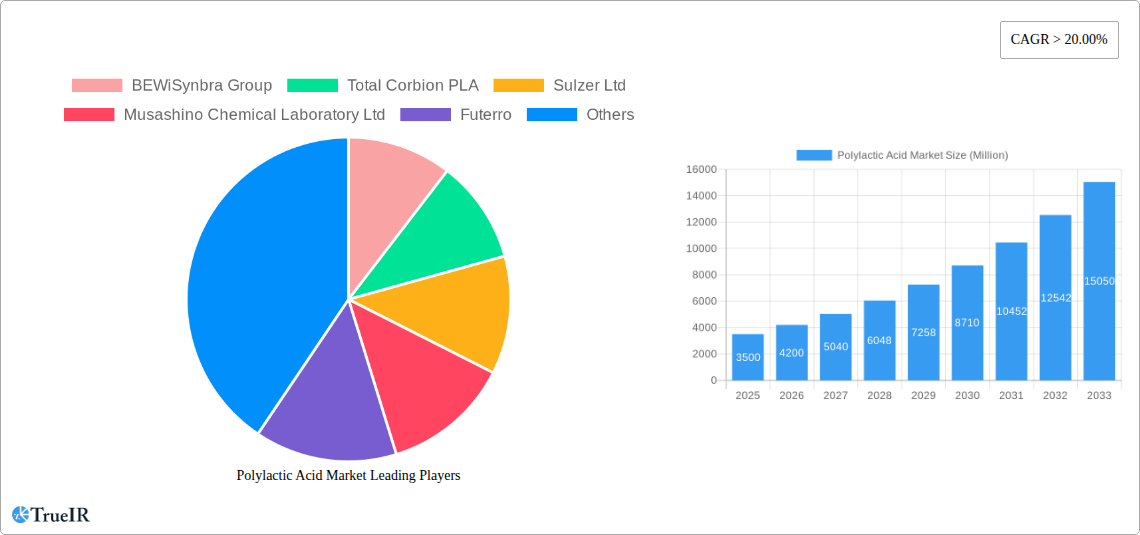
Key Players Shaping the Polylactic Acid Market Market
- BEWiSynbra Group
- Total Corbion PLA
- Sulzer Ltd
- Musashino Chemical Laboratory Ltd
- Futerro
- BASF SE
- Esun
- Zhejiang Hisun Biomaterials Co Ltd
- Shanghai Tong Jie Liang Biomaterials Co Ltd
- NatureWorks LLC
- Cofco
- Polysciences Inc
- Weforyou
- Jiangxi Keyuan Bio-Material Co Ltd
- Danimer Scientific
Significant Polylactic Acid Market Industry Milestones
- September 2023: Danimer Scientific collaborates with Chevron Phillips Chemical to explore high-volume biodegradable plastic production using Rinnovo polymers. This significantly boosts Danimer's market profile and expands its potential reach.
- May 2023: Sulzer partners with Jindan New Biomaterials in China to produce up to 750,000 tonnes of PLA annually, predominantly for food packaging. This substantially increases PLA production capacity, particularly in the Asia-Pacific region.
Future Outlook for Polylactic Acid Market Market
The PLA market is poised for continued growth, driven by increasing demand for sustainable packaging and ongoing technological advancements. Strategic partnerships and investments in research and development will further fuel market expansion. The expanding applications of PLA in various sectors, coupled with supportive government policies and rising consumer awareness, present significant opportunities for market players. The overall market outlook is extremely positive, projecting robust growth throughout the forecast period.
Polylactic Acid Market Segmentation
-
1. Raw Material
- 1.1. Corn
- 1.2. Cassava
- 1.3. Sugarcane and Sugar Beet
- 1.4. Other Raw Materials(molasses, potato, wheat)
-
2. Form
- 2.1. Fiber
- 2.2. Films and Sheets
- 2.3. Coatings
- 2.4. Other Forms
-
3. End-user Industry
- 3.1. Packaging
- 3.2. Medical
- 3.3. Electronics
- 3.4. Agriculture
- 3.5. Textiles
- 3.6. Other En
Polylactic Acid Market Segmentation By Geography
-
1. Asia Pacific
- 1.1. China
- 1.2. India
- 1.3. Japan
- 1.4. South Korea
- 1.5. ASEAN Countries
- 1.6. Rest of Asia Pacific
-
2. North America
- 2.1. United States
- 2.2. Canada
- 2.3. Mexico
-
3. Europe
- 3.1. Germany
- 3.2. United Kingdom
- 3.3. France
- 3.4. Italy
- 3.5. CIS region
- 3.6. Rest of Europe
-
4. South America
- 4.1. Brazil
- 4.2. Argentina
- 4.3. Rest of South America
-
5. Middle East and Africa
- 5.1. Saudi Arabia
- 5.2. South Africa
- 5.3. Rest of Middle East and Africa
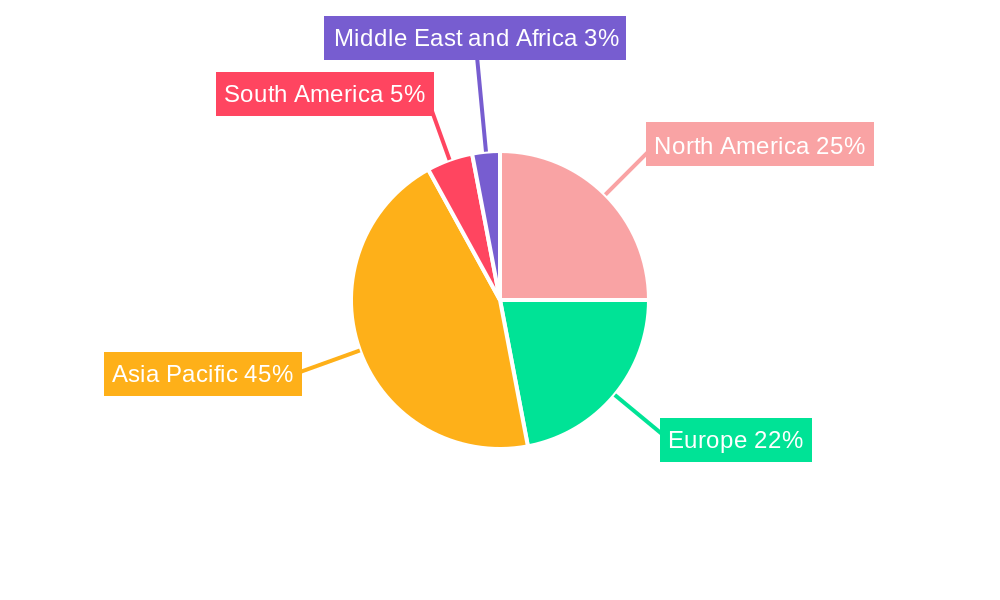
Polylactic Acid Market Regional Market Share
Geographic Coverage of Polylactic Acid Market
Polylactic Acid Market REPORT HIGHLIGHTS
| Aspects | Details |
|---|---|
| Study Period | 2020-2034 |
| Base Year | 2025 |
| Estimated Year | 2026 |
| Forecast Period | 2026-2034 |
| Historical Period | 2020-2025 |
| Growth Rate | CAGR of 17.5% from 2020-2034 |
| Segmentation |
|
Table of Contents
- 1. Introduction
- 1.1. Research Scope
- 1.2. Market Segmentation
- 1.3. Research Objective
- 1.4. Definitions and Assumptions
- 2. Executive Summary
- 2.1. Market Snapshot
- 3. Market Dynamics
- 3.1. Market Drivers
- 3.2. Market Restrains
- 3.3. Market Trends
- 3.4. Market Opportunities
- 4. Market Factor Analysis
- 4.1. Porters Five Forces
- 4.1.1. Bargaining Power of Suppliers
- 4.1.2. Bargaining Power of Buyers
- 4.1.3. Threat of New Entrants
- 4.1.4. Threat of Substitutes
- 4.1.5. Competitive Rivalry
- 4.2. PESTEL analysis
- 4.3. BCG Analysis
- 4.3.1. Stars (High Growth, High Market Share)
- 4.3.2. Cash Cows (Low Growth, High Market Share)
- 4.3.3. Question Mark (High Growth, Low Market Share)
- 4.3.4. Dogs (Low Growth, Low Market Share)
- 4.4. Ansoff Matrix Analysis
- 4.5. Supply Chain Analysis
- 4.6. Regulatory Landscape
- 4.7. Current Market Potential and Opportunity Assessment (TAM–SAM–SOM Framework)
- 4.8. TIR Analyst Note
- 4.1. Porters Five Forces
- 5. Market Analysis, Insights and Forecast 2021-2033
- 5.1. Market Analysis, Insights and Forecast - by Raw Material
- 5.1.1. Corn
- 5.1.2. Cassava
- 5.1.3. Sugarcane and Sugar Beet
- 5.1.4. Other Raw Materials(molasses, potato, wheat)
- 5.2. Market Analysis, Insights and Forecast - by Form
- 5.2.1. Fiber
- 5.2.2. Films and Sheets
- 5.2.3. Coatings
- 5.2.4. Other Forms
- 5.3. Market Analysis, Insights and Forecast - by End-user Industry
- 5.3.1. Packaging
- 5.3.2. Medical
- 5.3.3. Electronics
- 5.3.4. Agriculture
- 5.3.5. Textiles
- 5.3.6. Other En
- 5.4. Market Analysis, Insights and Forecast - by Region
- 5.4.1. Asia Pacific
- 5.4.2. North America
- 5.4.3. Europe
- 5.4.4. South America
- 5.4.5. Middle East and Africa
- 5.1. Market Analysis, Insights and Forecast - by Raw Material
- 6. Global Polylactic Acid Market Analysis, Insights and Forecast, 2021-2033
- 6.1. Market Analysis, Insights and Forecast - by Raw Material
- 6.1.1. Corn
- 6.1.2. Cassava
- 6.1.3. Sugarcane and Sugar Beet
- 6.1.4. Other Raw Materials(molasses, potato, wheat)
- 6.2. Market Analysis, Insights and Forecast - by Form
- 6.2.1. Fiber
- 6.2.2. Films and Sheets
- 6.2.3. Coatings
- 6.2.4. Other Forms
- 6.3. Market Analysis, Insights and Forecast - by End-user Industry
- 6.3.1. Packaging
- 6.3.2. Medical
- 6.3.3. Electronics
- 6.3.4. Agriculture
- 6.3.5. Textiles
- 6.3.6. Other En
- 6.1. Market Analysis, Insights and Forecast - by Raw Material
- 7. Asia Pacific Polylactic Acid Market Analysis, Insights and Forecast, 2020-2032
- 7.1. Market Analysis, Insights and Forecast - by Raw Material
- 7.1.1. Corn
- 7.1.2. Cassava
- 7.1.3. Sugarcane and Sugar Beet
- 7.1.4. Other Raw Materials(molasses, potato, wheat)
- 7.2. Market Analysis, Insights and Forecast - by Form
- 7.2.1. Fiber
- 7.2.2. Films and Sheets
- 7.2.3. Coatings
- 7.2.4. Other Forms
- 7.3. Market Analysis, Insights and Forecast - by End-user Industry
- 7.3.1. Packaging
- 7.3.2. Medical
- 7.3.3. Electronics
- 7.3.4. Agriculture
- 7.3.5. Textiles
- 7.3.6. Other En
- 7.1. Market Analysis, Insights and Forecast - by Raw Material
- 8. North America Polylactic Acid Market Analysis, Insights and Forecast, 2020-2032
- 8.1. Market Analysis, Insights and Forecast - by Raw Material
- 8.1.1. Corn
- 8.1.2. Cassava
- 8.1.3. Sugarcane and Sugar Beet
- 8.1.4. Other Raw Materials(molasses, potato, wheat)
- 8.2. Market Analysis, Insights and Forecast - by Form
- 8.2.1. Fiber
- 8.2.2. Films and Sheets
- 8.2.3. Coatings
- 8.2.4. Other Forms
- 8.3. Market Analysis, Insights and Forecast - by End-user Industry
- 8.3.1. Packaging
- 8.3.2. Medical
- 8.3.3. Electronics
- 8.3.4. Agriculture
- 8.3.5. Textiles
- 8.3.6. Other En
- 8.1. Market Analysis, Insights and Forecast - by Raw Material
- 9. Europe Polylactic Acid Market Analysis, Insights and Forecast, 2020-2032
- 9.1. Market Analysis, Insights and Forecast - by Raw Material
- 9.1.1. Corn
- 9.1.2. Cassava
- 9.1.3. Sugarcane and Sugar Beet
- 9.1.4. Other Raw Materials(molasses, potato, wheat)
- 9.2. Market Analysis, Insights and Forecast - by Form
- 9.2.1. Fiber
- 9.2.2. Films and Sheets
- 9.2.3. Coatings
- 9.2.4. Other Forms
- 9.3. Market Analysis, Insights and Forecast - by End-user Industry
- 9.3.1. Packaging
- 9.3.2. Medical
- 9.3.3. Electronics
- 9.3.4. Agriculture
- 9.3.5. Textiles
- 9.3.6. Other En
- 9.1. Market Analysis, Insights and Forecast - by Raw Material
- 10. South America Polylactic Acid Market Analysis, Insights and Forecast, 2020-2032
- 10.1. Market Analysis, Insights and Forecast - by Raw Material
- 10.1.1. Corn
- 10.1.2. Cassava
- 10.1.3. Sugarcane and Sugar Beet
- 10.1.4. Other Raw Materials(molasses, potato, wheat)
- 10.2. Market Analysis, Insights and Forecast - by Form
- 10.2.1. Fiber
- 10.2.2. Films and Sheets
- 10.2.3. Coatings
- 10.2.4. Other Forms
- 10.3. Market Analysis, Insights and Forecast - by End-user Industry
- 10.3.1. Packaging
- 10.3.2. Medical
- 10.3.3. Electronics
- 10.3.4. Agriculture
- 10.3.5. Textiles
- 10.3.6. Other En
- 10.1. Market Analysis, Insights and Forecast - by Raw Material
- 11. Middle East and Africa Polylactic Acid Market Analysis, Insights and Forecast, 2020-2032
- 11.1. Market Analysis, Insights and Forecast - by Raw Material
- 11.1.1. Corn
- 11.1.2. Cassava
- 11.1.3. Sugarcane and Sugar Beet
- 11.1.4. Other Raw Materials(molasses, potato, wheat)
- 11.2. Market Analysis, Insights and Forecast - by Form
- 11.2.1. Fiber
- 11.2.2. Films and Sheets
- 11.2.3. Coatings
- 11.2.4. Other Forms
- 11.3. Market Analysis, Insights and Forecast - by End-user Industry
- 11.3.1. Packaging
- 11.3.2. Medical
- 11.3.3. Electronics
- 11.3.4. Agriculture
- 11.3.5. Textiles
- 11.3.6. Other En
- 11.1. Market Analysis, Insights and Forecast - by Raw Material
- 12. Competitive Analysis
- 12.1. Company Profiles
- 12.1.1 BEWiSynbra Group
- 12.1.1.1. Company Overview
- 12.1.1.2. Products
- 12.1.1.3. Company Financials
- 12.1.1.4. SWOT Analysis
- 12.1.2 Total Corbion PLA
- 12.1.2.1. Company Overview
- 12.1.2.2. Products
- 12.1.2.3. Company Financials
- 12.1.2.4. SWOT Analysis
- 12.1.3 Sulzer Ltd
- 12.1.3.1. Company Overview
- 12.1.3.2. Products
- 12.1.3.3. Company Financials
- 12.1.3.4. SWOT Analysis
- 12.1.4 Musashino Chemical Laboratory Ltd
- 12.1.4.1. Company Overview
- 12.1.4.2. Products
- 12.1.4.3. Company Financials
- 12.1.4.4. SWOT Analysis
- 12.1.5 Futerro
- 12.1.5.1. Company Overview
- 12.1.5.2. Products
- 12.1.5.3. Company Financials
- 12.1.5.4. SWOT Analysis
- 12.1.6 BASF SE
- 12.1.6.1. Company Overview
- 12.1.6.2. Products
- 12.1.6.3. Company Financials
- 12.1.6.4. SWOT Analysis
- 12.1.7 Esun
- 12.1.7.1. Company Overview
- 12.1.7.2. Products
- 12.1.7.3. Company Financials
- 12.1.7.4. SWOT Analysis
- 12.1.8 Zhejiang Hisun Biomaterials Co Ltd*List Not Exhaustive
- 12.1.8.1. Company Overview
- 12.1.8.2. Products
- 12.1.8.3. Company Financials
- 12.1.8.4. SWOT Analysis
- 12.1.9 Shanghai Tong Jie Liang Biomaterials Co Ltd
- 12.1.9.1. Company Overview
- 12.1.9.2. Products
- 12.1.9.3. Company Financials
- 12.1.9.4. SWOT Analysis
- 12.1.10 NatureWorks LLC
- 12.1.10.1. Company Overview
- 12.1.10.2. Products
- 12.1.10.3. Company Financials
- 12.1.10.4. SWOT Analysis
- 12.1.11 Cofco
- 12.1.11.1. Company Overview
- 12.1.11.2. Products
- 12.1.11.3. Company Financials
- 12.1.11.4. SWOT Analysis
- 12.1.12 Polysciences Inc
- 12.1.12.1. Company Overview
- 12.1.12.2. Products
- 12.1.12.3. Company Financials
- 12.1.12.4. SWOT Analysis
- 12.1.13 Weforyou
- 12.1.13.1. Company Overview
- 12.1.13.2. Products
- 12.1.13.3. Company Financials
- 12.1.13.4. SWOT Analysis
- 12.1.14 Jiangxi Keyuan Bio-Material Co Ltd
- 12.1.14.1. Company Overview
- 12.1.14.2. Products
- 12.1.14.3. Company Financials
- 12.1.14.4. SWOT Analysis
- 12.1.15 Danimer Scientific
- 12.1.15.1. Company Overview
- 12.1.15.2. Products
- 12.1.15.3. Company Financials
- 12.1.15.4. SWOT Analysis
- 12.1.1 BEWiSynbra Group
- 12.2. Market Entropy
- 12.2.1 Company's Key Areas Served
- 12.2.2 Recent Developments
- 12.3. Company Market Share Analysis 2025
- 12.3.1 Top 5 Companies Market Share Analysis
- 12.3.2 Top 3 Companies Market Share Analysis
- 12.4. List of Potential Customers
- 13. Research Methodology
List of Figures
- Figure 1: Global Polylactic Acid Market Revenue Breakdown (billion, %) by Region 2025 & 2033
- Figure 2: Global Polylactic Acid Market Volume Breakdown (Million, %) by Region 2025 & 2033
- Figure 3: Asia Pacific Polylactic Acid Market Revenue (billion), by Raw Material 2025 & 2033
- Figure 4: Asia Pacific Polylactic Acid Market Volume (Million), by Raw Material 2025 & 2033
- Figure 5: Asia Pacific Polylactic Acid Market Revenue Share (%), by Raw Material 2025 & 2033
- Figure 6: Asia Pacific Polylactic Acid Market Volume Share (%), by Raw Material 2025 & 2033
- Figure 7: Asia Pacific Polylactic Acid Market Revenue (billion), by Form 2025 & 2033
- Figure 8: Asia Pacific Polylactic Acid Market Volume (Million), by Form 2025 & 2033
- Figure 9: Asia Pacific Polylactic Acid Market Revenue Share (%), by Form 2025 & 2033
- Figure 10: Asia Pacific Polylactic Acid Market Volume Share (%), by Form 2025 & 2033
- Figure 11: Asia Pacific Polylactic Acid Market Revenue (billion), by End-user Industry 2025 & 2033
- Figure 12: Asia Pacific Polylactic Acid Market Volume (Million), by End-user Industry 2025 & 2033
- Figure 13: Asia Pacific Polylactic Acid Market Revenue Share (%), by End-user Industry 2025 & 2033
- Figure 14: Asia Pacific Polylactic Acid Market Volume Share (%), by End-user Industry 2025 & 2033
- Figure 15: Asia Pacific Polylactic Acid Market Revenue (billion), by Country 2025 & 2033
- Figure 16: Asia Pacific Polylactic Acid Market Volume (Million), by Country 2025 & 2033
- Figure 17: Asia Pacific Polylactic Acid Market Revenue Share (%), by Country 2025 & 2033
- Figure 18: Asia Pacific Polylactic Acid Market Volume Share (%), by Country 2025 & 2033
- Figure 19: North America Polylactic Acid Market Revenue (billion), by Raw Material 2025 & 2033
- Figure 20: North America Polylactic Acid Market Volume (Million), by Raw Material 2025 & 2033
- Figure 21: North America Polylactic Acid Market Revenue Share (%), by Raw Material 2025 & 2033
- Figure 22: North America Polylactic Acid Market Volume Share (%), by Raw Material 2025 & 2033
- Figure 23: North America Polylactic Acid Market Revenue (billion), by Form 2025 & 2033
- Figure 24: North America Polylactic Acid Market Volume (Million), by Form 2025 & 2033
- Figure 25: North America Polylactic Acid Market Revenue Share (%), by Form 2025 & 2033
- Figure 26: North America Polylactic Acid Market Volume Share (%), by Form 2025 & 2033
- Figure 27: North America Polylactic Acid Market Revenue (billion), by End-user Industry 2025 & 2033
- Figure 28: North America Polylactic Acid Market Volume (Million), by End-user Industry 2025 & 2033
- Figure 29: North America Polylactic Acid Market Revenue Share (%), by End-user Industry 2025 & 2033
- Figure 30: North America Polylactic Acid Market Volume Share (%), by End-user Industry 2025 & 2033
- Figure 31: North America Polylactic Acid Market Revenue (billion), by Country 2025 & 2033
- Figure 32: North America Polylactic Acid Market Volume (Million), by Country 2025 & 2033
- Figure 33: North America Polylactic Acid Market Revenue Share (%), by Country 2025 & 2033
- Figure 34: North America Polylactic Acid Market Volume Share (%), by Country 2025 & 2033
- Figure 35: Europe Polylactic Acid Market Revenue (billion), by Raw Material 2025 & 2033
- Figure 36: Europe Polylactic Acid Market Volume (Million), by Raw Material 2025 & 2033
- Figure 37: Europe Polylactic Acid Market Revenue Share (%), by Raw Material 2025 & 2033
- Figure 38: Europe Polylactic Acid Market Volume Share (%), by Raw Material 2025 & 2033
- Figure 39: Europe Polylactic Acid Market Revenue (billion), by Form 2025 & 2033
- Figure 40: Europe Polylactic Acid Market Volume (Million), by Form 2025 & 2033
- Figure 41: Europe Polylactic Acid Market Revenue Share (%), by Form 2025 & 2033
- Figure 42: Europe Polylactic Acid Market Volume Share (%), by Form 2025 & 2033
- Figure 43: Europe Polylactic Acid Market Revenue (billion), by End-user Industry 2025 & 2033
- Figure 44: Europe Polylactic Acid Market Volume (Million), by End-user Industry 2025 & 2033
- Figure 45: Europe Polylactic Acid Market Revenue Share (%), by End-user Industry 2025 & 2033
- Figure 46: Europe Polylactic Acid Market Volume Share (%), by End-user Industry 2025 & 2033
- Figure 47: Europe Polylactic Acid Market Revenue (billion), by Country 2025 & 2033
- Figure 48: Europe Polylactic Acid Market Volume (Million), by Country 2025 & 2033
- Figure 49: Europe Polylactic Acid Market Revenue Share (%), by Country 2025 & 2033
- Figure 50: Europe Polylactic Acid Market Volume Share (%), by Country 2025 & 2033
- Figure 51: South America Polylactic Acid Market Revenue (billion), by Raw Material 2025 & 2033
- Figure 52: South America Polylactic Acid Market Volume (Million), by Raw Material 2025 & 2033
- Figure 53: South America Polylactic Acid Market Revenue Share (%), by Raw Material 2025 & 2033
- Figure 54: South America Polylactic Acid Market Volume Share (%), by Raw Material 2025 & 2033
- Figure 55: South America Polylactic Acid Market Revenue (billion), by Form 2025 & 2033
- Figure 56: South America Polylactic Acid Market Volume (Million), by Form 2025 & 2033
- Figure 57: South America Polylactic Acid Market Revenue Share (%), by Form 2025 & 2033
- Figure 58: South America Polylactic Acid Market Volume Share (%), by Form 2025 & 2033
- Figure 59: South America Polylactic Acid Market Revenue (billion), by End-user Industry 2025 & 2033
- Figure 60: South America Polylactic Acid Market Volume (Million), by End-user Industry 2025 & 2033
- Figure 61: South America Polylactic Acid Market Revenue Share (%), by End-user Industry 2025 & 2033
- Figure 62: South America Polylactic Acid Market Volume Share (%), by End-user Industry 2025 & 2033
- Figure 63: South America Polylactic Acid Market Revenue (billion), by Country 2025 & 2033
- Figure 64: South America Polylactic Acid Market Volume (Million), by Country 2025 & 2033
- Figure 65: South America Polylactic Acid Market Revenue Share (%), by Country 2025 & 2033
- Figure 66: South America Polylactic Acid Market Volume Share (%), by Country 2025 & 2033
- Figure 67: Middle East and Africa Polylactic Acid Market Revenue (billion), by Raw Material 2025 & 2033
- Figure 68: Middle East and Africa Polylactic Acid Market Volume (Million), by Raw Material 2025 & 2033
- Figure 69: Middle East and Africa Polylactic Acid Market Revenue Share (%), by Raw Material 2025 & 2033
- Figure 70: Middle East and Africa Polylactic Acid Market Volume Share (%), by Raw Material 2025 & 2033
- Figure 71: Middle East and Africa Polylactic Acid Market Revenue (billion), by Form 2025 & 2033
- Figure 72: Middle East and Africa Polylactic Acid Market Volume (Million), by Form 2025 & 2033
- Figure 73: Middle East and Africa Polylactic Acid Market Revenue Share (%), by Form 2025 & 2033
- Figure 74: Middle East and Africa Polylactic Acid Market Volume Share (%), by Form 2025 & 2033
- Figure 75: Middle East and Africa Polylactic Acid Market Revenue (billion), by End-user Industry 2025 & 2033
- Figure 76: Middle East and Africa Polylactic Acid Market Volume (Million), by End-user Industry 2025 & 2033
- Figure 77: Middle East and Africa Polylactic Acid Market Revenue Share (%), by End-user Industry 2025 & 2033
- Figure 78: Middle East and Africa Polylactic Acid Market Volume Share (%), by End-user Industry 2025 & 2033
- Figure 79: Middle East and Africa Polylactic Acid Market Revenue (billion), by Country 2025 & 2033
- Figure 80: Middle East and Africa Polylactic Acid Market Volume (Million), by Country 2025 & 2033
- Figure 81: Middle East and Africa Polylactic Acid Market Revenue Share (%), by Country 2025 & 2033
- Figure 82: Middle East and Africa Polylactic Acid Market Volume Share (%), by Country 2025 & 2033
List of Tables
- Table 1: Global Polylactic Acid Market Revenue billion Forecast, by Raw Material 2020 & 2033
- Table 2: Global Polylactic Acid Market Volume Million Forecast, by Raw Material 2020 & 2033
- Table 3: Global Polylactic Acid Market Revenue billion Forecast, by Form 2020 & 2033
- Table 4: Global Polylactic Acid Market Volume Million Forecast, by Form 2020 & 2033
- Table 5: Global Polylactic Acid Market Revenue billion Forecast, by End-user Industry 2020 & 2033
- Table 6: Global Polylactic Acid Market Volume Million Forecast, by End-user Industry 2020 & 2033
- Table 7: Global Polylactic Acid Market Revenue billion Forecast, by Region 2020 & 2033
- Table 8: Global Polylactic Acid Market Volume Million Forecast, by Region 2020 & 2033
- Table 9: Global Polylactic Acid Market Revenue billion Forecast, by Raw Material 2020 & 2033
- Table 10: Global Polylactic Acid Market Volume Million Forecast, by Raw Material 2020 & 2033
- Table 11: Global Polylactic Acid Market Revenue billion Forecast, by Form 2020 & 2033
- Table 12: Global Polylactic Acid Market Volume Million Forecast, by Form 2020 & 2033
- Table 13: Global Polylactic Acid Market Revenue billion Forecast, by End-user Industry 2020 & 2033
- Table 14: Global Polylactic Acid Market Volume Million Forecast, by End-user Industry 2020 & 2033
- Table 15: Global Polylactic Acid Market Revenue billion Forecast, by Country 2020 & 2033
- Table 16: Global Polylactic Acid Market Volume Million Forecast, by Country 2020 & 2033
- Table 17: China Polylactic Acid Market Revenue (billion) Forecast, by Application 2020 & 2033
- Table 18: China Polylactic Acid Market Volume (Million) Forecast, by Application 2020 & 2033
- Table 19: India Polylactic Acid Market Revenue (billion) Forecast, by Application 2020 & 2033
- Table 20: India Polylactic Acid Market Volume (Million) Forecast, by Application 2020 & 2033
- Table 21: Japan Polylactic Acid Market Revenue (billion) Forecast, by Application 2020 & 2033
- Table 22: Japan Polylactic Acid Market Volume (Million) Forecast, by Application 2020 & 2033
- Table 23: South Korea Polylactic Acid Market Revenue (billion) Forecast, by Application 2020 & 2033
- Table 24: South Korea Polylactic Acid Market Volume (Million) Forecast, by Application 2020 & 2033
- Table 25: ASEAN Countries Polylactic Acid Market Revenue (billion) Forecast, by Application 2020 & 2033
- Table 26: ASEAN Countries Polylactic Acid Market Volume (Million) Forecast, by Application 2020 & 2033
- Table 27: Rest of Asia Pacific Polylactic Acid Market Revenue (billion) Forecast, by Application 2020 & 2033
- Table 28: Rest of Asia Pacific Polylactic Acid Market Volume (Million) Forecast, by Application 2020 & 2033
- Table 29: Global Polylactic Acid Market Revenue billion Forecast, by Raw Material 2020 & 2033
- Table 30: Global Polylactic Acid Market Volume Million Forecast, by Raw Material 2020 & 2033
- Table 31: Global Polylactic Acid Market Revenue billion Forecast, by Form 2020 & 2033
- Table 32: Global Polylactic Acid Market Volume Million Forecast, by Form 2020 & 2033
- Table 33: Global Polylactic Acid Market Revenue billion Forecast, by End-user Industry 2020 & 2033
- Table 34: Global Polylactic Acid Market Volume Million Forecast, by End-user Industry 2020 & 2033
- Table 35: Global Polylactic Acid Market Revenue billion Forecast, by Country 2020 & 2033
- Table 36: Global Polylactic Acid Market Volume Million Forecast, by Country 2020 & 2033
- Table 37: United States Polylactic Acid Market Revenue (billion) Forecast, by Application 2020 & 2033
- Table 38: United States Polylactic Acid Market Volume (Million) Forecast, by Application 2020 & 2033
- Table 39: Canada Polylactic Acid Market Revenue (billion) Forecast, by Application 2020 & 2033
- Table 40: Canada Polylactic Acid Market Volume (Million) Forecast, by Application 2020 & 2033
- Table 41: Mexico Polylactic Acid Market Revenue (billion) Forecast, by Application 2020 & 2033
- Table 42: Mexico Polylactic Acid Market Volume (Million) Forecast, by Application 2020 & 2033
- Table 43: Global Polylactic Acid Market Revenue billion Forecast, by Raw Material 2020 & 2033
- Table 44: Global Polylactic Acid Market Volume Million Forecast, by Raw Material 2020 & 2033
- Table 45: Global Polylactic Acid Market Revenue billion Forecast, by Form 2020 & 2033
- Table 46: Global Polylactic Acid Market Volume Million Forecast, by Form 2020 & 2033
- Table 47: Global Polylactic Acid Market Revenue billion Forecast, by End-user Industry 2020 & 2033
- Table 48: Global Polylactic Acid Market Volume Million Forecast, by End-user Industry 2020 & 2033
- Table 49: Global Polylactic Acid Market Revenue billion Forecast, by Country 2020 & 2033
- Table 50: Global Polylactic Acid Market Volume Million Forecast, by Country 2020 & 2033
- Table 51: Germany Polylactic Acid Market Revenue (billion) Forecast, by Application 2020 & 2033
- Table 52: Germany Polylactic Acid Market Volume (Million) Forecast, by Application 2020 & 2033
- Table 53: United Kingdom Polylactic Acid Market Revenue (billion) Forecast, by Application 2020 & 2033
- Table 54: United Kingdom Polylactic Acid Market Volume (Million) Forecast, by Application 2020 & 2033
- Table 55: France Polylactic Acid Market Revenue (billion) Forecast, by Application 2020 & 2033
- Table 56: France Polylactic Acid Market Volume (Million) Forecast, by Application 2020 & 2033
- Table 57: Italy Polylactic Acid Market Revenue (billion) Forecast, by Application 2020 & 2033
- Table 58: Italy Polylactic Acid Market Volume (Million) Forecast, by Application 2020 & 2033
- Table 59: CIS region Polylactic Acid Market Revenue (billion) Forecast, by Application 2020 & 2033
- Table 60: CIS region Polylactic Acid Market Volume (Million) Forecast, by Application 2020 & 2033
- Table 61: Rest of Europe Polylactic Acid Market Revenue (billion) Forecast, by Application 2020 & 2033
- Table 62: Rest of Europe Polylactic Acid Market Volume (Million) Forecast, by Application 2020 & 2033
- Table 63: Global Polylactic Acid Market Revenue billion Forecast, by Raw Material 2020 & 2033
- Table 64: Global Polylactic Acid Market Volume Million Forecast, by Raw Material 2020 & 2033
- Table 65: Global Polylactic Acid Market Revenue billion Forecast, by Form 2020 & 2033
- Table 66: Global Polylactic Acid Market Volume Million Forecast, by Form 2020 & 2033
- Table 67: Global Polylactic Acid Market Revenue billion Forecast, by End-user Industry 2020 & 2033
- Table 68: Global Polylactic Acid Market Volume Million Forecast, by End-user Industry 2020 & 2033
- Table 69: Global Polylactic Acid Market Revenue billion Forecast, by Country 2020 & 2033
- Table 70: Global Polylactic Acid Market Volume Million Forecast, by Country 2020 & 2033
- Table 71: Brazil Polylactic Acid Market Revenue (billion) Forecast, by Application 2020 & 2033
- Table 72: Brazil Polylactic Acid Market Volume (Million) Forecast, by Application 2020 & 2033
- Table 73: Argentina Polylactic Acid Market Revenue (billion) Forecast, by Application 2020 & 2033
- Table 74: Argentina Polylactic Acid Market Volume (Million) Forecast, by Application 2020 & 2033
- Table 75: Rest of South America Polylactic Acid Market Revenue (billion) Forecast, by Application 2020 & 2033
- Table 76: Rest of South America Polylactic Acid Market Volume (Million) Forecast, by Application 2020 & 2033
- Table 77: Global Polylactic Acid Market Revenue billion Forecast, by Raw Material 2020 & 2033
- Table 78: Global Polylactic Acid Market Volume Million Forecast, by Raw Material 2020 & 2033
- Table 79: Global Polylactic Acid Market Revenue billion Forecast, by Form 2020 & 2033
- Table 80: Global Polylactic Acid Market Volume Million Forecast, by Form 2020 & 2033
- Table 81: Global Polylactic Acid Market Revenue billion Forecast, by End-user Industry 2020 & 2033
- Table 82: Global Polylactic Acid Market Volume Million Forecast, by End-user Industry 2020 & 2033
- Table 83: Global Polylactic Acid Market Revenue billion Forecast, by Country 2020 & 2033
- Table 84: Global Polylactic Acid Market Volume Million Forecast, by Country 2020 & 2033
- Table 85: Saudi Arabia Polylactic Acid Market Revenue (billion) Forecast, by Application 2020 & 2033
- Table 86: Saudi Arabia Polylactic Acid Market Volume (Million) Forecast, by Application 2020 & 2033
- Table 87: South Africa Polylactic Acid Market Revenue (billion) Forecast, by Application 2020 & 2033
- Table 88: South Africa Polylactic Acid Market Volume (Million) Forecast, by Application 2020 & 2033
- Table 89: Rest of Middle East and Africa Polylactic Acid Market Revenue (billion) Forecast, by Application 2020 & 2033
- Table 90: Rest of Middle East and Africa Polylactic Acid Market Volume (Million) Forecast, by Application 2020 & 2033
Frequently Asked Questions
1. What is the projected Compound Annual Growth Rate (CAGR) of the Polylactic Acid Market?
The projected CAGR is approximately 17.5%.
2. Which companies are prominent players in the Polylactic Acid Market?
Key companies in the market include BEWiSynbra Group, Total Corbion PLA, Sulzer Ltd, Musashino Chemical Laboratory Ltd, Futerro, BASF SE, Esun, Zhejiang Hisun Biomaterials Co Ltd*List Not Exhaustive, Shanghai Tong Jie Liang Biomaterials Co Ltd, NatureWorks LLC, Cofco, Polysciences Inc, Weforyou, Jiangxi Keyuan Bio-Material Co Ltd, Danimer Scientific.
3. What are the main segments of the Polylactic Acid Market?
The market segments include Raw Material, Form, End-user Industry.
4. Can you provide details about the market size?
The market size is estimated to be USD 2.01 billion as of 2022.
5. What are some drivers contributing to market growth?
Favorable Government Policies Promoting Bio-plastics; Other Drivers.
6. What are the notable trends driving market growth?
The Packaging Segment is Expected to Dominate the Market.
7. Are there any restraints impacting market growth?
High Price and Other Disadvantages; Other Restraints.
8. Can you provide examples of recent developments in the market?
September 2023: Danimer Scientific has announced its collaboration with Chevron Phillips Chemical to explore the development and commercialization of high-volume biodegradable plastic products using Danimer’s Rinnovo polymers. This partnership aims to boost the company’s profile of PLA-based bioplastic products in the market.
9. What pricing options are available for accessing the report?
Pricing options include single-user, multi-user, and enterprise licenses priced at USD 4750, USD 5250, and USD 8750 respectively.
10. Is the market size provided in terms of value or volume?
The market size is provided in terms of value, measured in billion and volume, measured in Million.
11. Are there any specific market keywords associated with the report?
Yes, the market keyword associated with the report is "Polylactic Acid Market," which aids in identifying and referencing the specific market segment covered.
12. How do I determine which pricing option suits my needs best?
The pricing options vary based on user requirements and access needs. Individual users may opt for single-user licenses, while businesses requiring broader access may choose multi-user or enterprise licenses for cost-effective access to the report.
13. Are there any additional resources or data provided in the Polylactic Acid Market report?
While the report offers comprehensive insights, it's advisable to review the specific contents or supplementary materials provided to ascertain if additional resources or data are available.
14. How can I stay updated on further developments or reports in the Polylactic Acid Market?
To stay informed about further developments, trends, and reports in the Polylactic Acid Market, consider subscribing to industry newsletters, following relevant companies and organizations, or regularly checking reputable industry news sources and publications.
Methodology
Step 1 - Identification of Relevant Samples Size from Population Database


Step 2 - Approaches for Defining Global Market Size (Value, Volume* & Price*)

Note*: In applicable scenarios
Step 3 - Data Sources
Primary Research
- Web Analytics
- Survey Reports
- Research Institute
- Latest Research Reports
- Opinion Leaders
Secondary Research
- Annual Reports
- White Paper
- Latest Press Release
- Industry Association
- Paid Database
- Investor Presentations

Step 4 - Data Triangulation
Involves using different sources of information in order to increase the validity of a study
These sources are likely to be stakeholders in a program - participants, other researchers, program staff, other community members, and so on.
Then we put all data in single framework & apply various statistical tools to find out the dynamic on the market.
During the analysis stage, feedback from the stakeholder groups would be compared to determine areas of agreement as well as areas of divergence